SOM cluster: 475
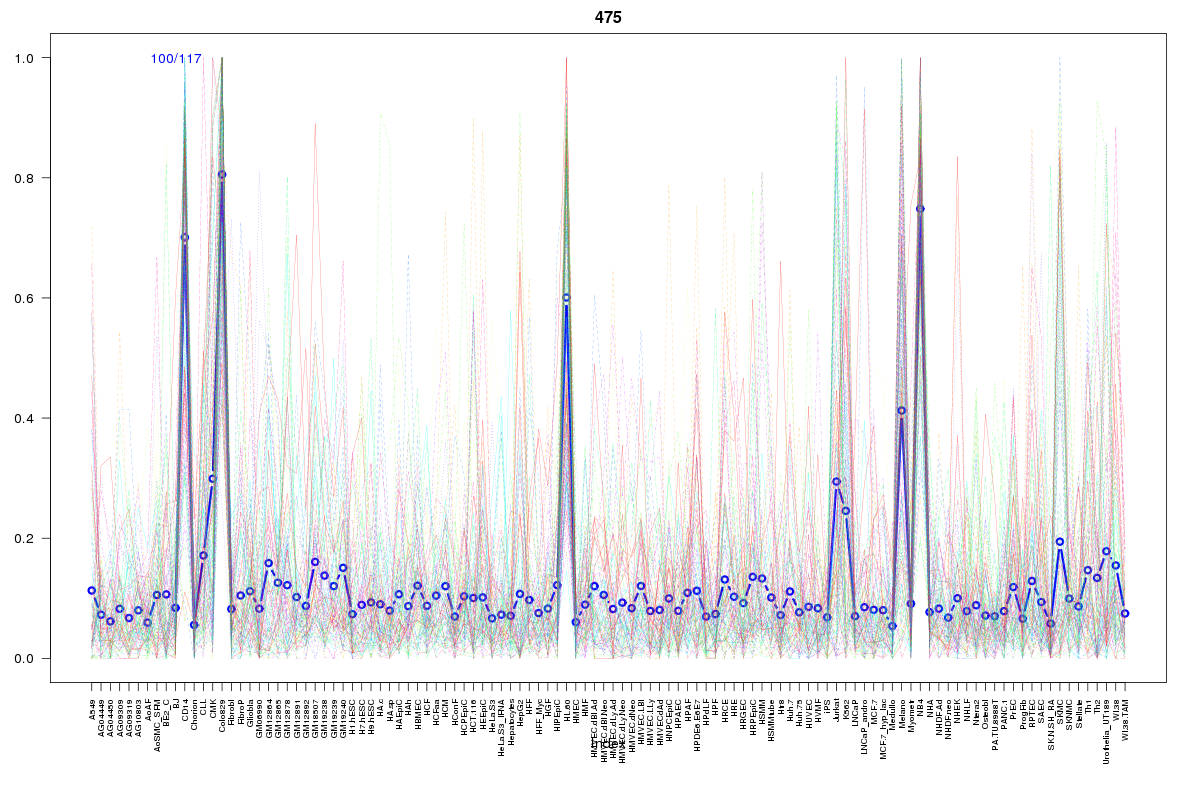
Cluster Hypersensitivity Profile

Genomic Location Trend
These plots show the distribution of the DHS sites surrounding the Transcript Start Site of the nearest gene.
Stats
Number of sites: 117Promoter: 7%
CpG-Island: 0%
Conserved: 48%
Enriched Motifs & Matches
Match Detail: [Jaspar]
|
| ||
|---|---|---|
| Sites: 56/100 | e-val: 2.3e-30 | ||
| Factor | e-val(match) | DB |
| SPI1 | 0.000000009836 | JASPAR |
| SPIB | 0.00000049993 | JASPAR |
| FEV | 0.000010465 | JASPAR |
| ELF5 | 0.000070205 | JASPAR |
| ELK4 | 0.00031066 | JASPAR |
BED file downloads
Top 10 Example Regions
| Location | Gene Link | Dist. |
|---|---|---|
| chr7: 134287740-134287890 | AKR1B15 | 50.42 |
| chr3: 53203460-53203610 | PRKCD | 52.31 |
| chr3: 53203460-53203610 | RFT1 | 52.31 |
| chr17: 9967240-9967390 | GAS7 | 59.31 |
| chr17: 47819820-47819970 | SPOP | 70.97 |
| chr17: 47819820-47819970 | RP11-613C6.2 | 70.97 |
| chr22: 17255640-17255790 | TPTEP1 | 74.03 |
| chr18: 77742860-77743010 | PQLC1 | 77.02 |
| chr2: 68968500-68968650 | ARHGAP25 | 78.64 |
| chr4: 84479980-84480130 | AGPAT9 | 80.87 |