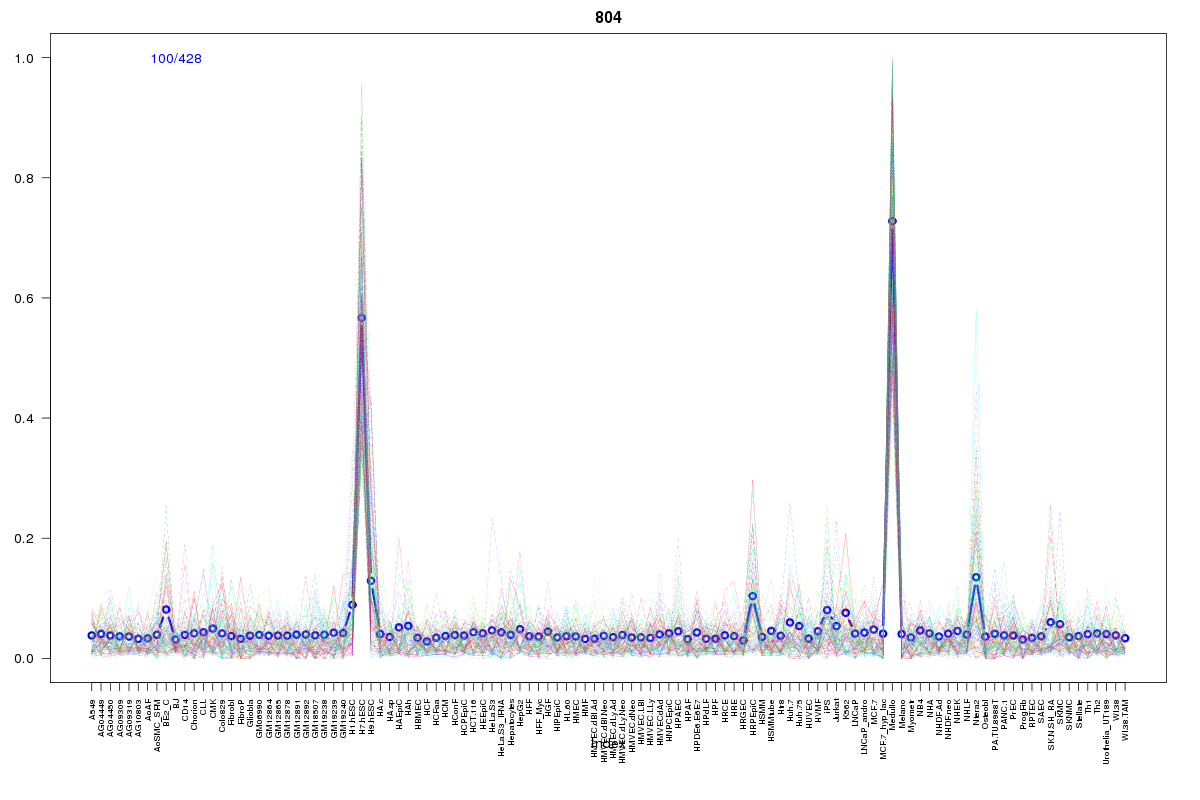
SOM cluster: 804
Cluster Hypersensitivity Profile

Genomic Location Trend
These plots show the distribution of the DHS sites surrounding the Transcript Start Site of the nearest gene.
Stats
Number of sites: 428Promoter: 0%
CpG-Island: 0%
Conserved: 56%
Enriched Motifs & Matches
Match Detail: [Jaspar]
|
| ||
|---|---|---|
| Sites: 43/100 | e-val: 0.00000011 | ||
| Factor | e-val(match) | DB |
| SPIB | 0.00015264 | JASPAR |
| NFKB1 | 0.00028643 | JASPAR |
| REL | 0.00072893 | JASPAR |
| RELA | 0.0014886 | JASPAR |
| MZF1_1-4 | 0.0032089 | JASPAR |
BED file downloads
Top 10 Example Regions
| Location | Gene Link | Dist. |
|---|---|---|
| chr5: 89859040-89859190 | GPR98 | 57.26 |
| chr8: 145898165-145898315 | ARHGAP39 | 65.71 |
| chr1: 226128965-226129115 | TMEM63A | 66.76 |
| chr4: 140488785-140488935 | MGST2 | 77.39 |
| chr12: 5500900-5501050 | NTF3 | 78.4 |
| chr14: 57126260-57126410 | RP11-1085N6.3 | 78.65 |
| chr19: 56040280-56040430 | SHISA7 | 80.09 |
| chr8: 24799140-24799290 | NEFM | 82.06 |
| chr8: 24799140-24799290 | NEFL | 82.06 |
| chr1: 166129020-166129170 | FAM78B | 83.77 |