SOM cluster: 836
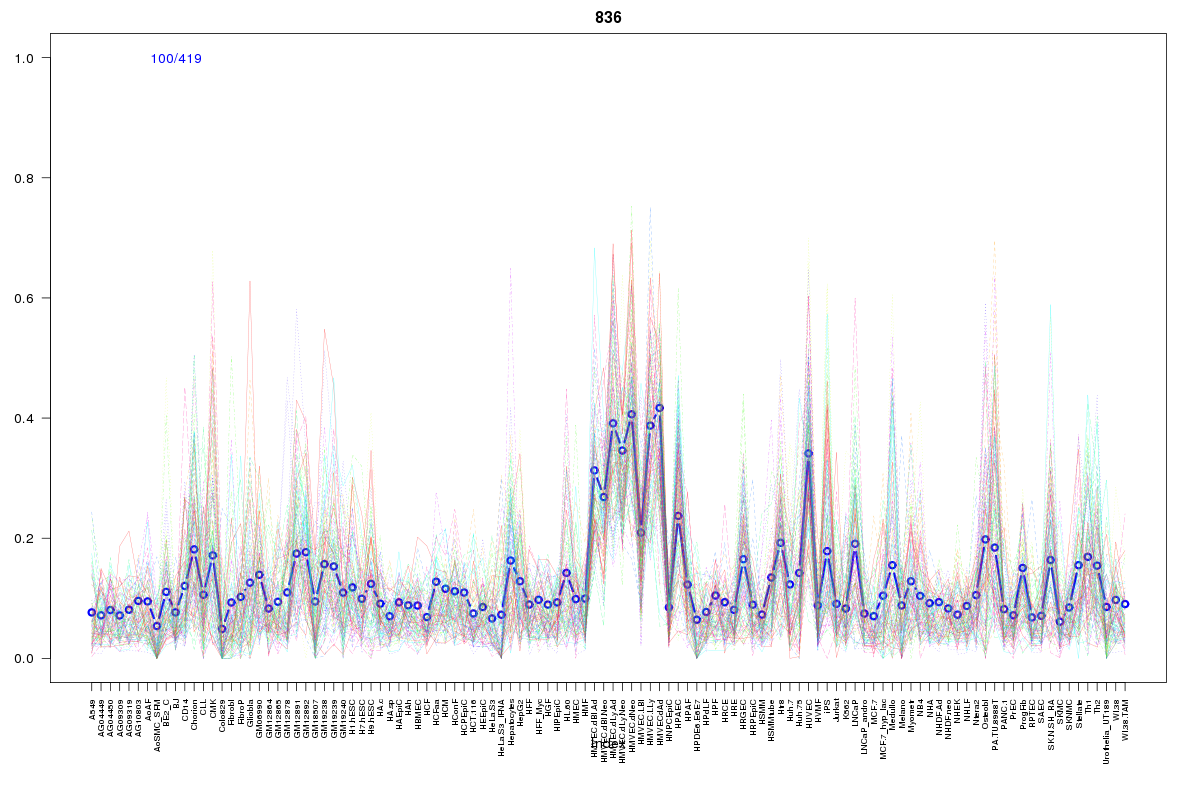
Cluster Hypersensitivity Profile

Genomic Location Trend
These plots show the distribution of the DHS sites surrounding the Transcript Start Site of the nearest gene.
Stats
Number of sites: 419Promoter: 12%
CpG-Island: 16%
Conserved: 48%
Enriched Motifs & Matches
Match Detail: [Jaspar]
|
| ||
|---|---|---|
| Sites: 83/100 | e-val: 0 | ||
| Factor | e-val(match) | DB |
| RREB1 | 0.0000000058853 | JASPAR |
| SP1 | 0.00000040292 | JASPAR |
| Pax4 | 0.000052016 | JASPAR |
| INSM1 | 0.0021648 | JASPAR |
| Klf4 | 0.0031327 | JASPAR |
|
| ||
| Sites: 57/100 | e-val: 0.000000000011 | ||
| Factor | e-val(match) | DB |
| Myf | 0.0001863 | JASPAR |
| CTCF | 0.00049726 | JASPAR |
| RREB1 | 0.0024154 | JASPAR |
| SP1 | 0.003791 | JASPAR |
| PLAG1 | 0.016477 | JASPAR |
BED file downloads
Top 10 Example Regions
| Location | Gene Link | Dist. |
|---|---|---|
| chr22: 45638700-45638850 | KIAA0930 | 34.75 |
| chr8: 10586180-10586330 | SOX7 | 38.09 |
| chr8: 10586180-10586330 | CTD-2135J3.3 | 38.09 |
| chr9: 131465965-131466115 | VTI1BP4 | 51.34 |
| chr9: 131465965-131466115 | HMGA1P4 | 51.34 |
| chr9: 131465965-131466115 | PKN3 | 51.34 |
| chr8: 19614160-19614310 | RP11-1105O14.1 | 54.74 |
| chr8: 19614160-19614310 | CSGALNACT1 | 54.74 |
| chr19: 14584305-14584455 | DNAJB1 | 55.12 |
| chr15: 85361385-85361535 | ALPK3 | 56.05 |