Gene: PER3
chr1: 7844379-7864018Expression Profile
(log scale)
Graphical Connections
Distribution of linked clusters:
You may find it interesting if many of the connected DHS sites belong to the same cluster.| Cluster Profile | Cluster ID | Number of DHS sites in this cluster |
|---|---|---|
 | 2055 | 1 |
 | 2211 | 1 |
 | 1078 | 1 |
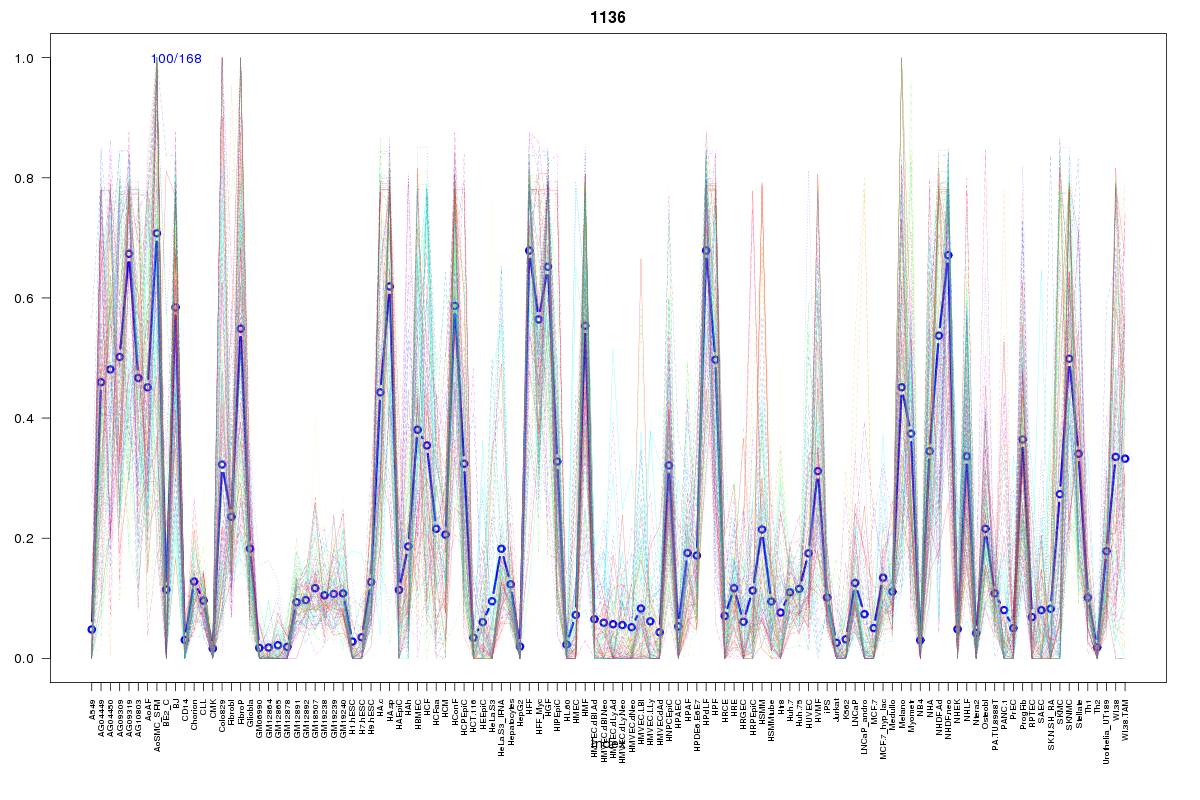 | 1136 | 1 |
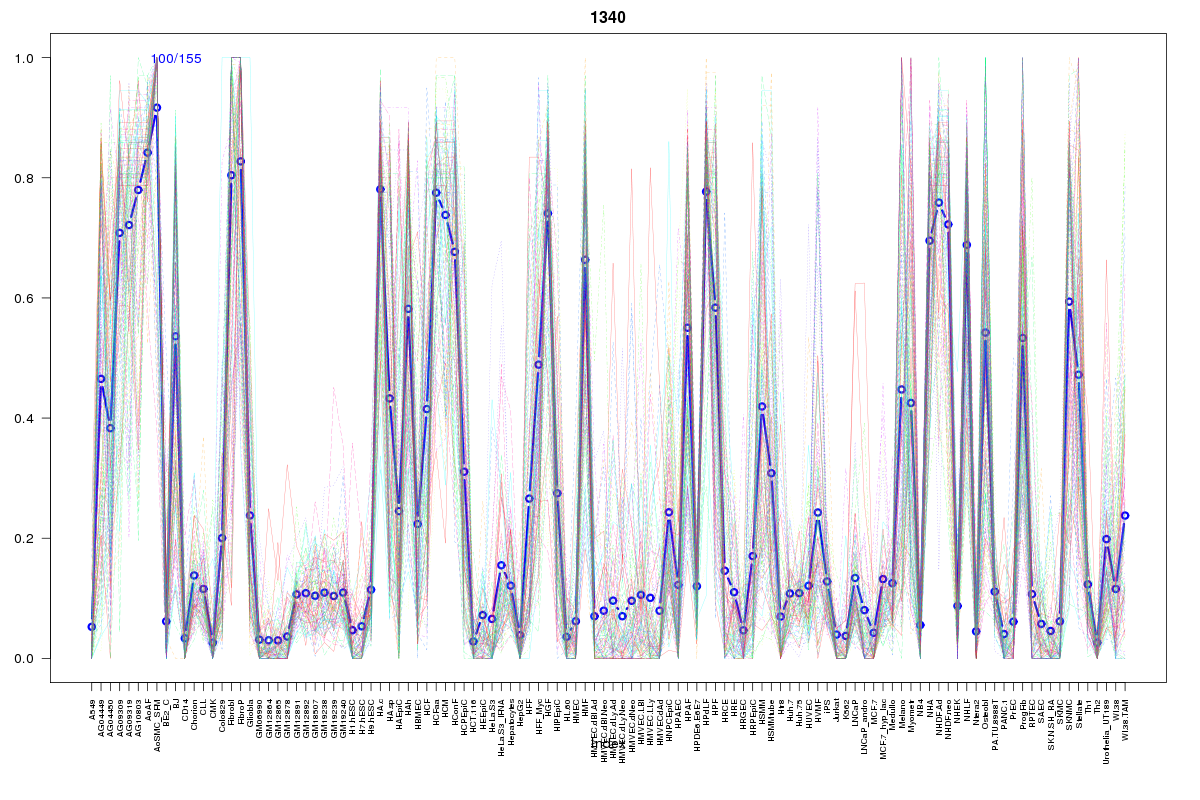 | 1340 | 1 |
Resources
BED file downloads
Connects to 5 DHS sitesTop 10 Correlated DHS Sites
p-values indiciate significant higher or lower correlation| Location | Cluster | P-value |
|---|---|---|
| chr1:7954000-7954150 | 1340 | 0.015 |
| chr1:7907800-7907950 | 1136 | 0.021 |
| chr1:7767905-7768055 | 2055 | 0.022 |
| chr1:7842345-7842495 | 2211 | 0.021 |
| chr1:7887225-7887375 | 1078 | 0.012 |
External Databases
UCSCEnsembl (ENSG00000049246)