Gene: SNTA1
chr20: 31995760-32031698Expression Profile
(log scale)
Graphical Connections
Distribution of linked clusters:
You may find it interesting if many of the connected DHS sites belong to the same cluster.| Cluster Profile | Cluster ID | Number of DHS sites in this cluster |
|---|---|---|
 | 1963 | 3 |
 | 2017 | 1 |
 | 510 | 1 |
 | 615 | 1 |
 | 1244 | 1 |
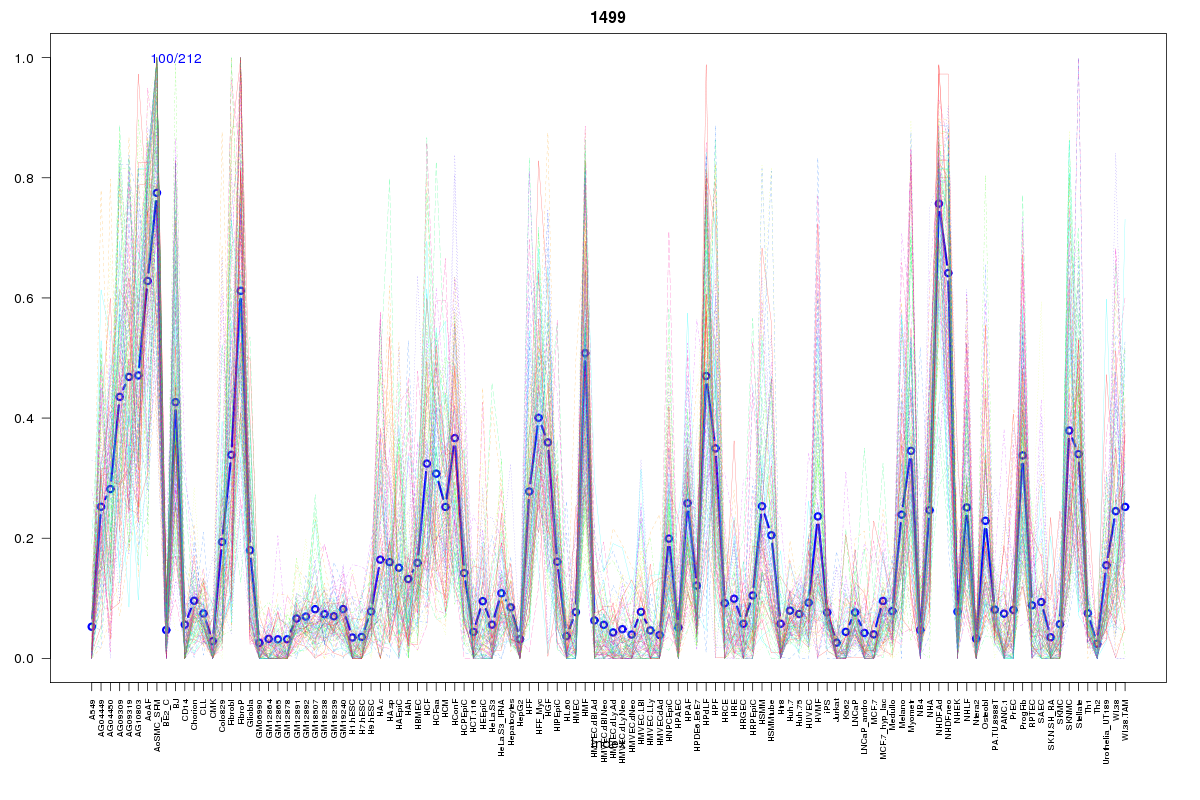 | 1499 | 1 |
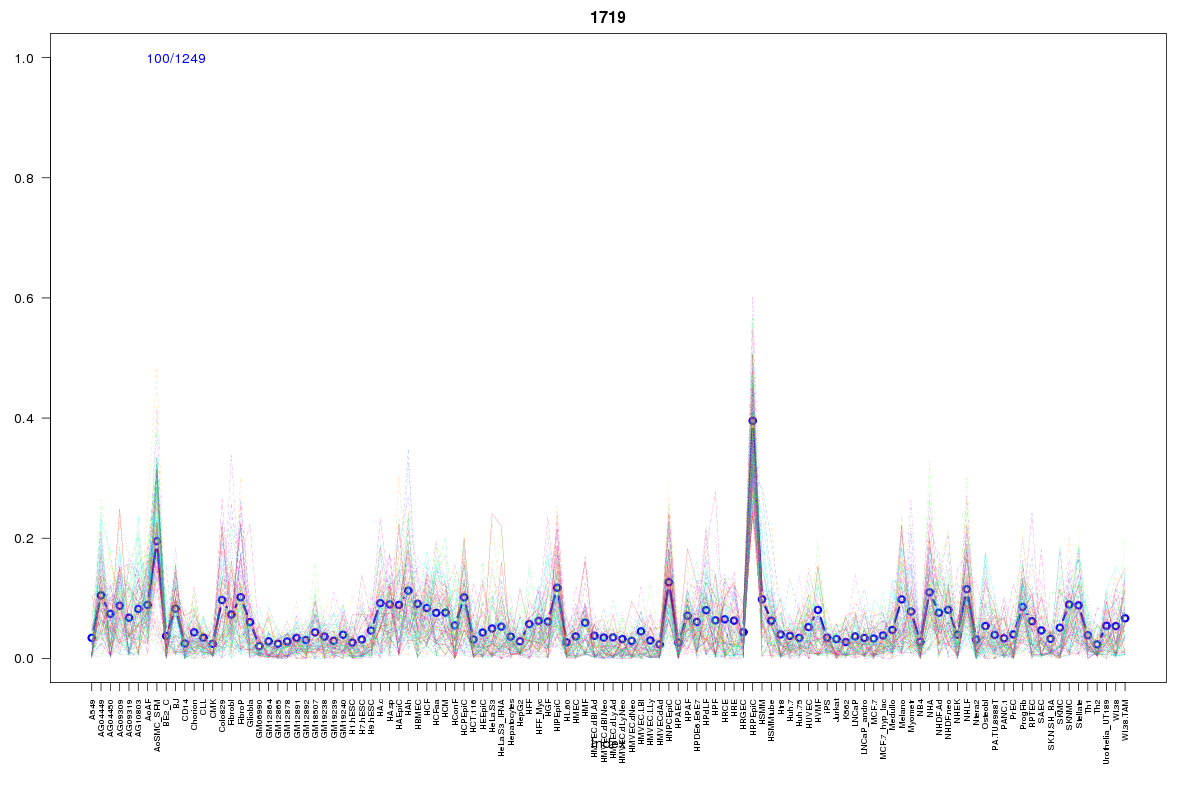 | 1719 | 1 |
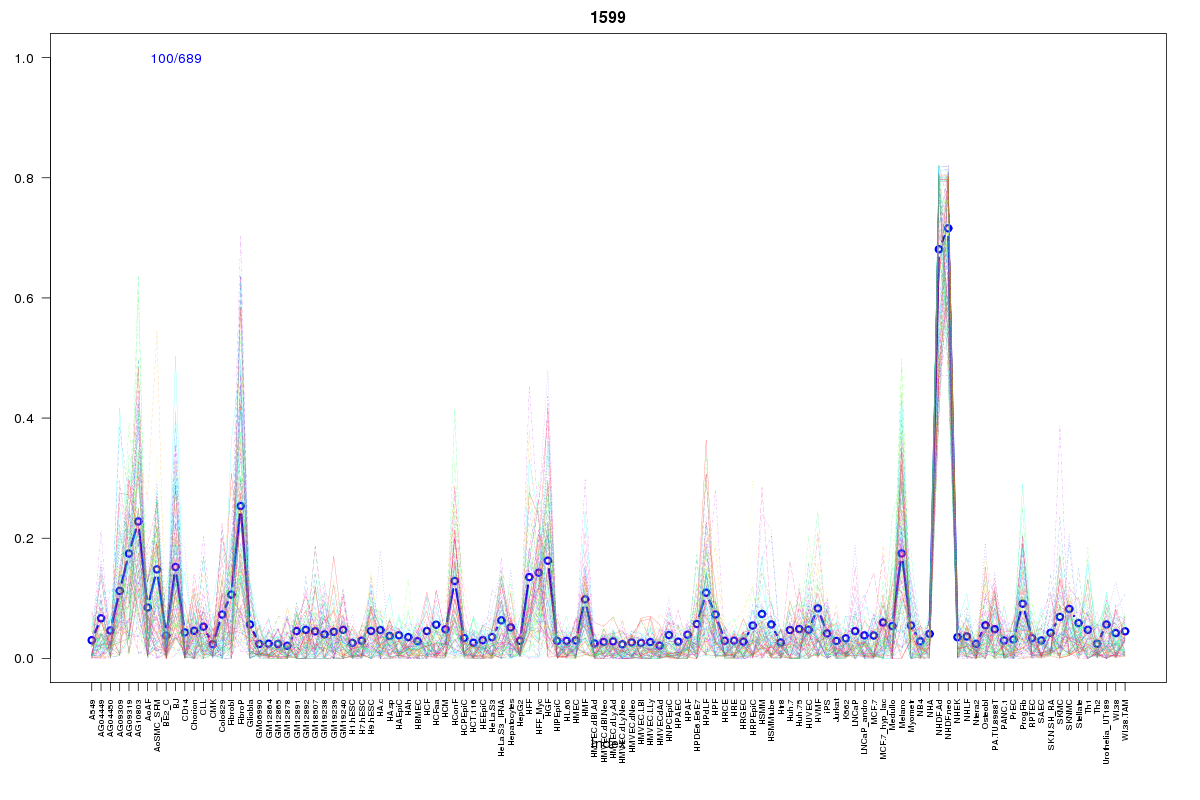 | 1599 | 1 |
 | 1605 | 1 |
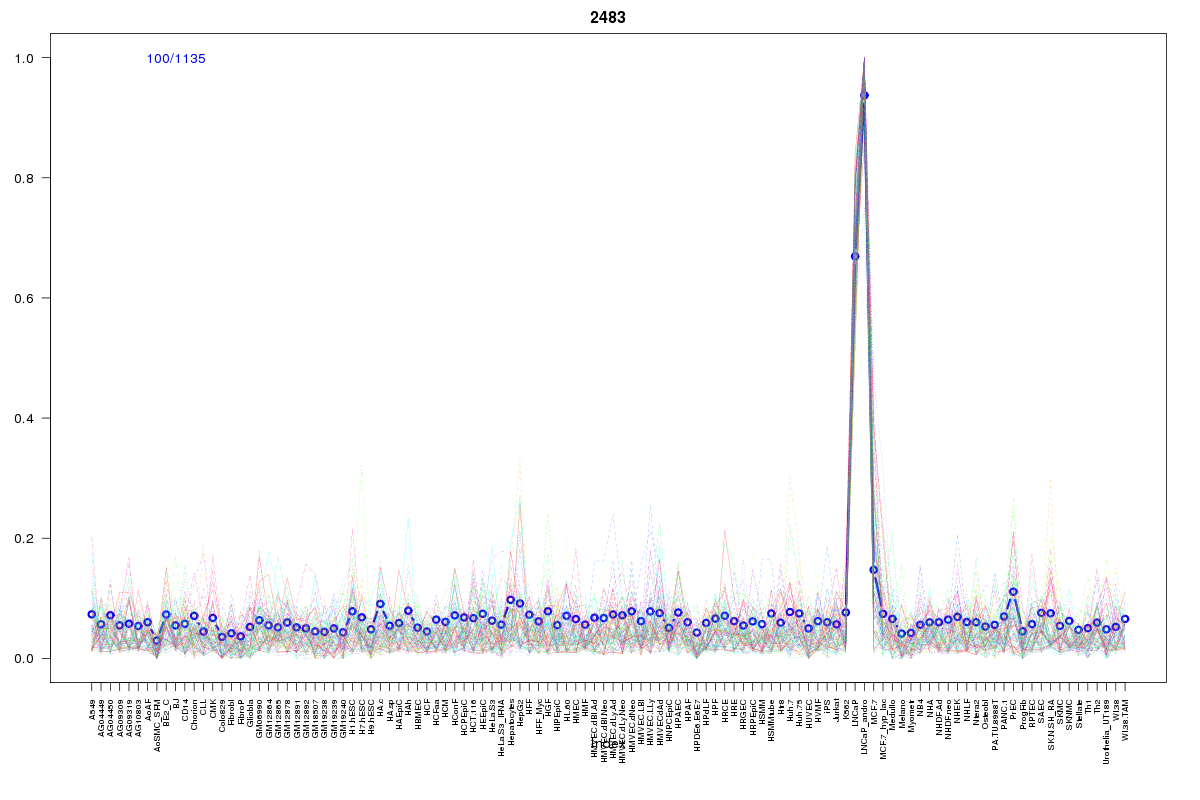 | 2483 | 1 |
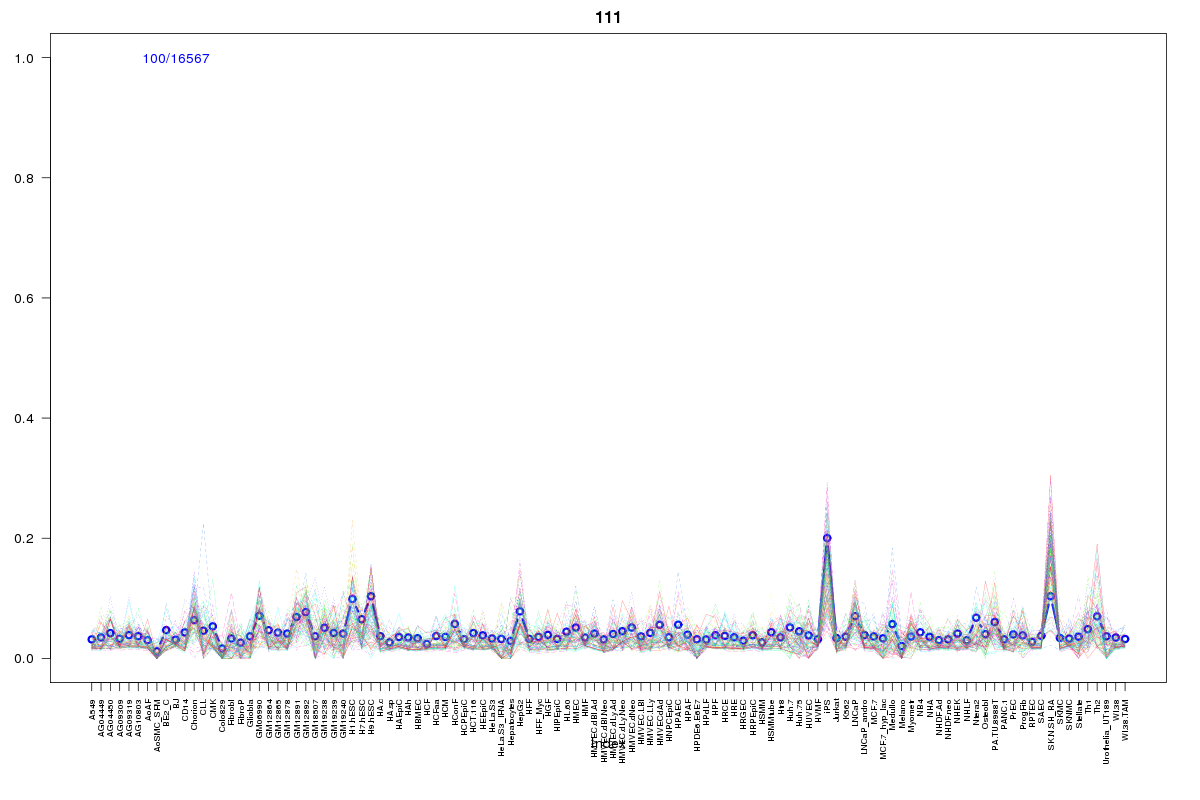 | 111 | 1 |
 | 1755 | 1 |
 | 15 | 1 |
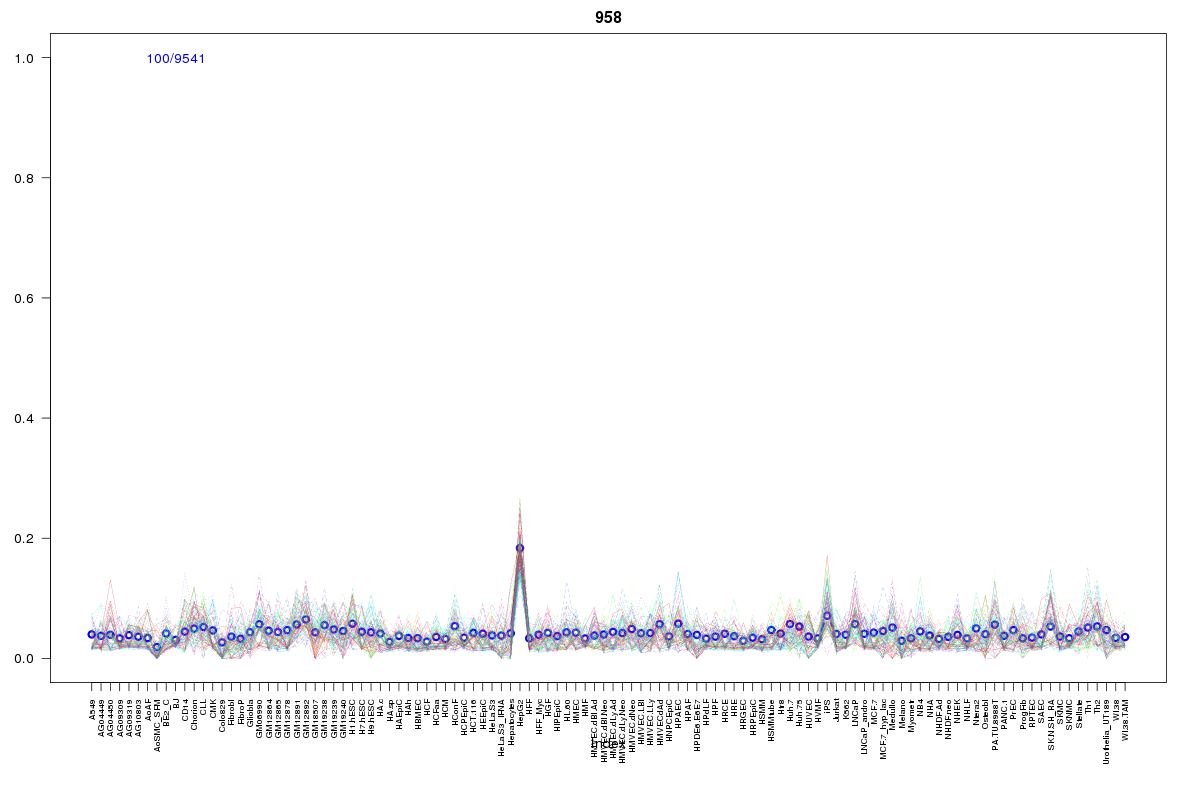 | 958 | 1 |
Resources
BED file downloads
Connects to 16 DHS sitesTop 10 Correlated DHS Sites
p-values indiciate significant higher or lower correlation| Location | Cluster | P-value |
|---|---|---|
| chr20:32067385-32067535 | 1755 | 0.001 |
| chr20:32022860-32023010 | 1605 | 0.001 |
| chr20:31990265-31990415 | 2017 | 0.001 |
| chr20:32011040-32011190 | 1244 | 0.001 |
| chr20:32005985-32006135 | 615 | 0.004 |
| chr20:32011420-32011570 | 1499 | 0.004 |
| chr20:32019760-32019910 | 1719 | 0.006 |
| chr20:32007520-32007670 | 1963 | 0.01 |
| chr20:32047520-32047670 | 1963 | 0.018 |
| chr20:32034620-32034770 | 2483 | 0.019 |
| chr20:31916265-31916415 | 958 | 0.021 |
External Databases
UCSCEnsembl (ENSG00000101400)