Gene: GLA
chrX: 100652790-100662913Expression Profile
(log scale)
Graphical Connections
Distribution of linked clusters:
You may find it interesting if many of the connected DHS sites belong to the same cluster.| Cluster Profile | Cluster ID | Number of DHS sites in this cluster |
|---|---|---|
 | 2017 | 3 |
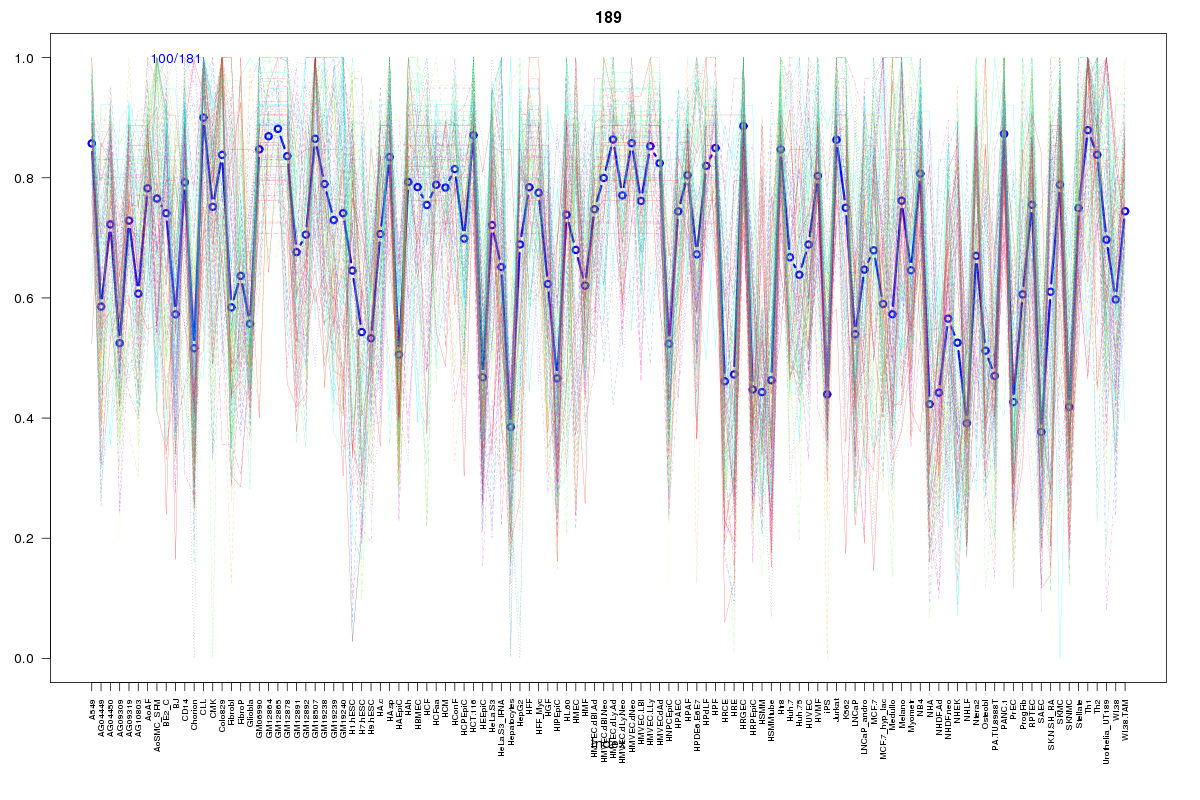 | 189 | 1 |
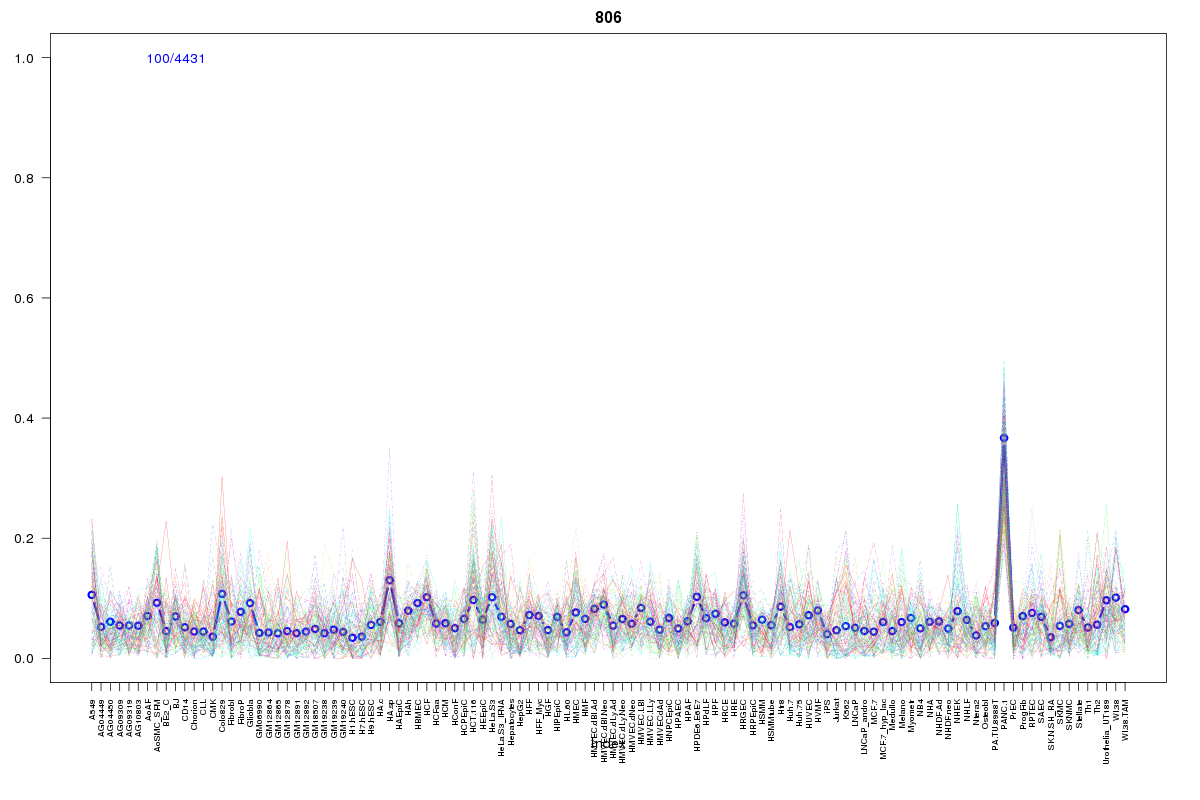 | 806 | 1 |
 | 1269 | 1 |
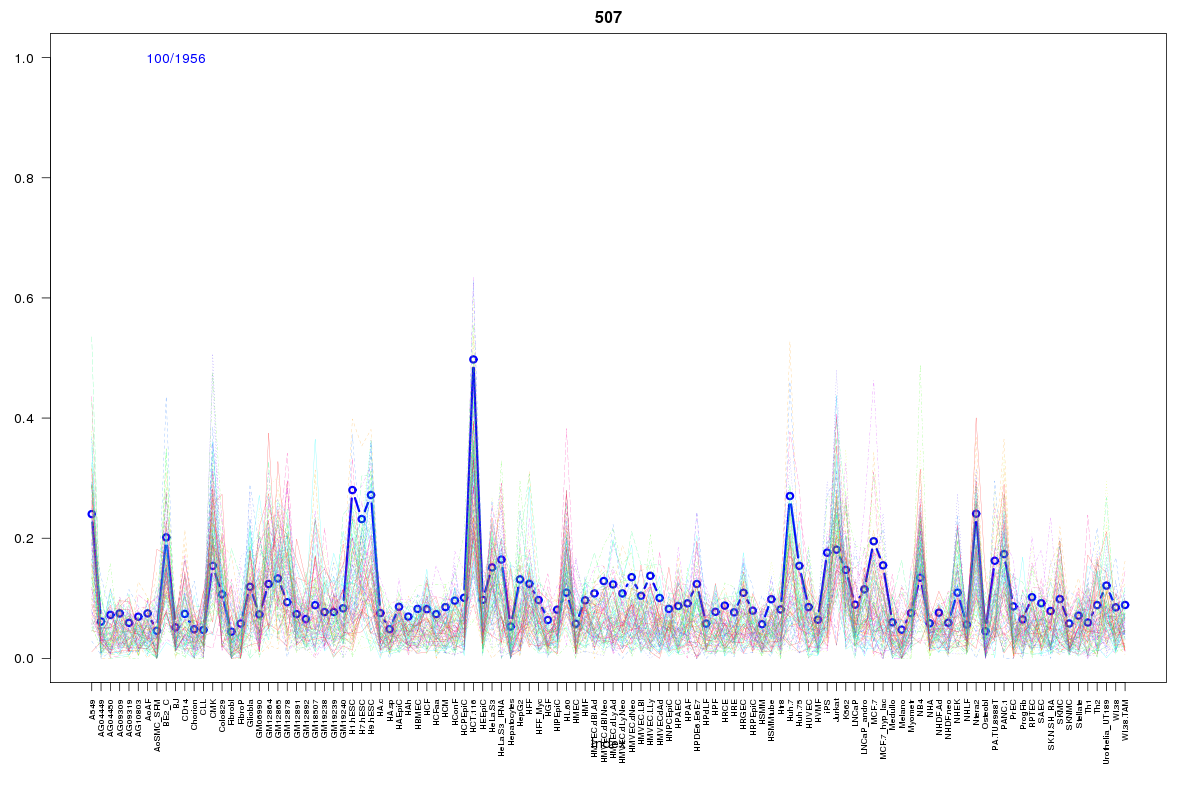 | 507 | 1 |
 | 1605 | 1 |
 | 1724 | 1 |
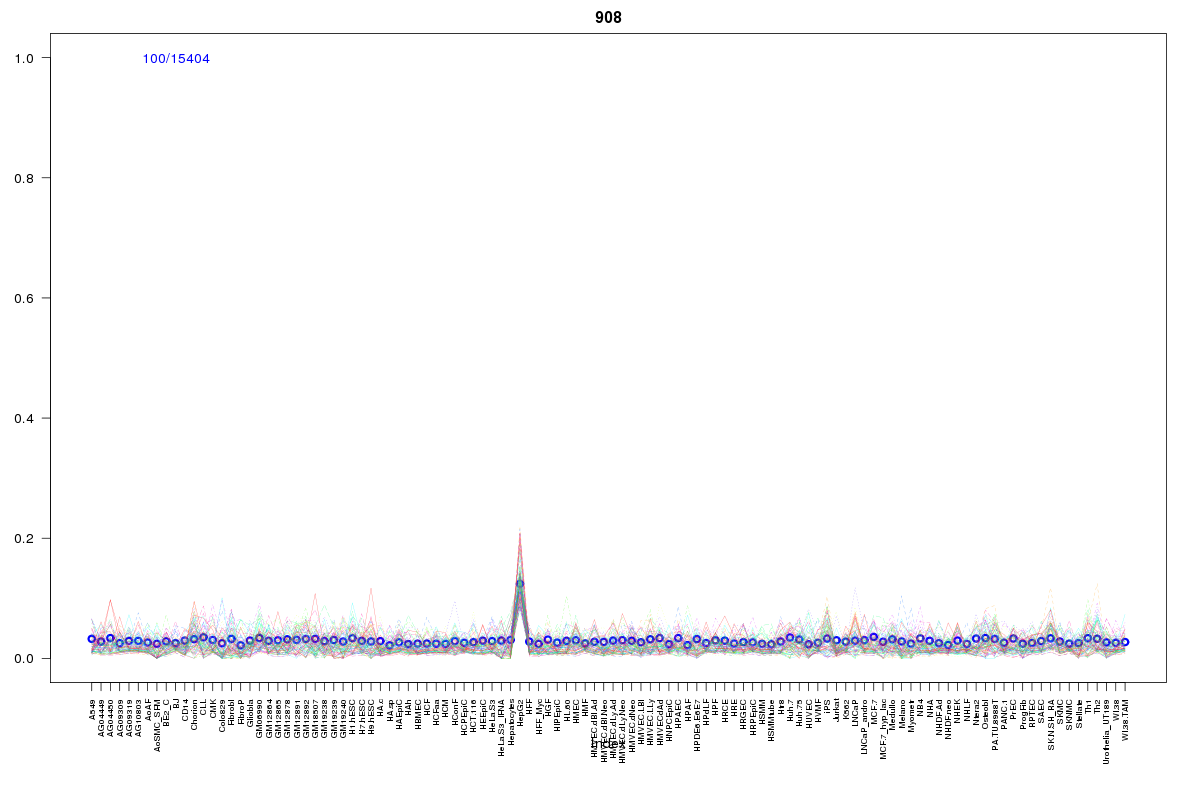 | 908 | 1 |
Resources
BED file downloads
Connects to 10 DHS sitesTop 10 Correlated DHS Sites
p-values indiciate significant higher or lower correlation| Location | Cluster | P-value |
|---|---|---|
| chrX:100604225-100604375 | 2017 | 0.002 |
| chrX:100648880-100649030 | 1605 | 0.005 |
| chrX:100685760-100685910 | 806 | 0.006 |
| chrX:100603945-100604095 | 1269 | 0.008 |
| chrX:100612260-100612410 | 507 | 0.008 |
| chrX:100649520-100649670 | 2017 | 0.009 |
| chrX:100651065-100651215 | 1724 | 0.013 |
| chrX:100661825-100661975 | 908 | 0.015 |
| chrX:100602785-100602935 | 2017 | 0.015 |
| chrX:100662840-100662990 | 189 | 0.018 |
External Databases
UCSCEnsembl (ENSG00000102393)