Gene: GTPBP10
chr7: 89964536-89973408Expression Profile
(log scale)
Graphical Connections
Distribution of linked clusters:
You may find it interesting if many of the connected DHS sites belong to the same cluster.| Cluster Profile | Cluster ID | Number of DHS sites in this cluster |
|---|---|---|
 | 2186 | 2 |
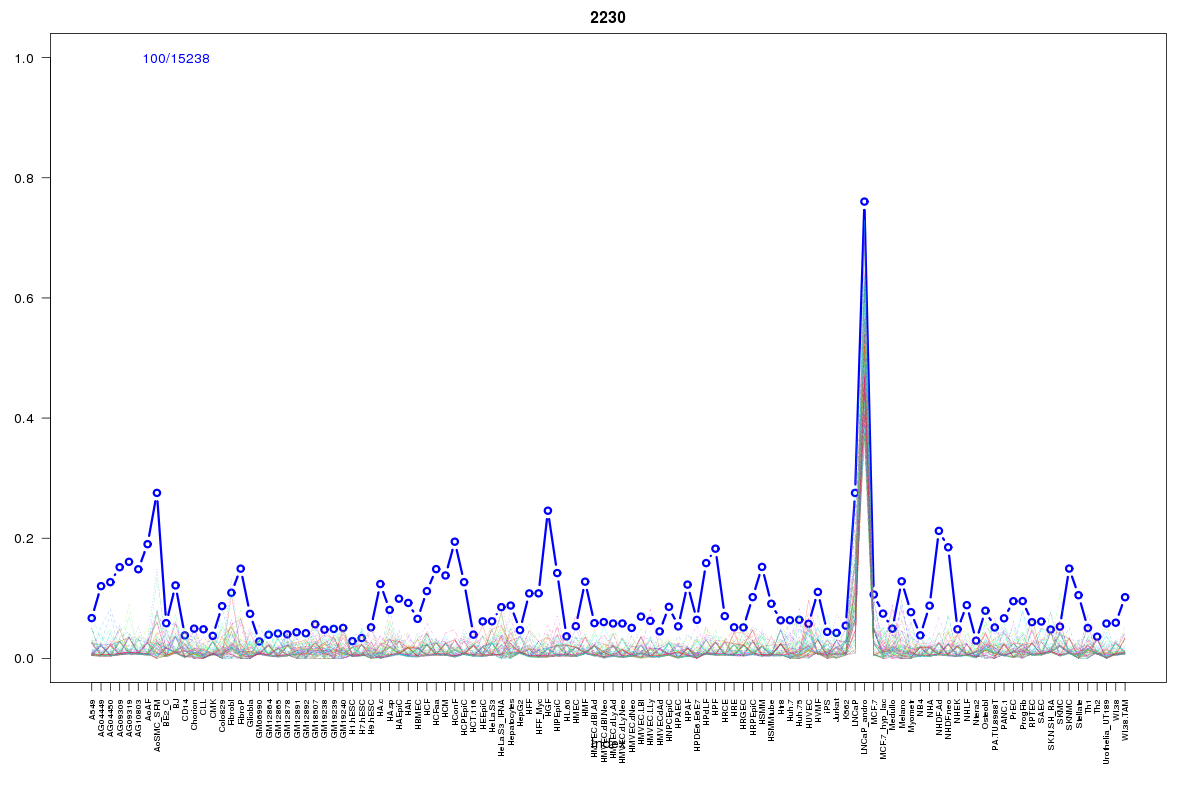 | 2230 | 2 |
 | 927 | 1 |
 | 1269 | 1 |
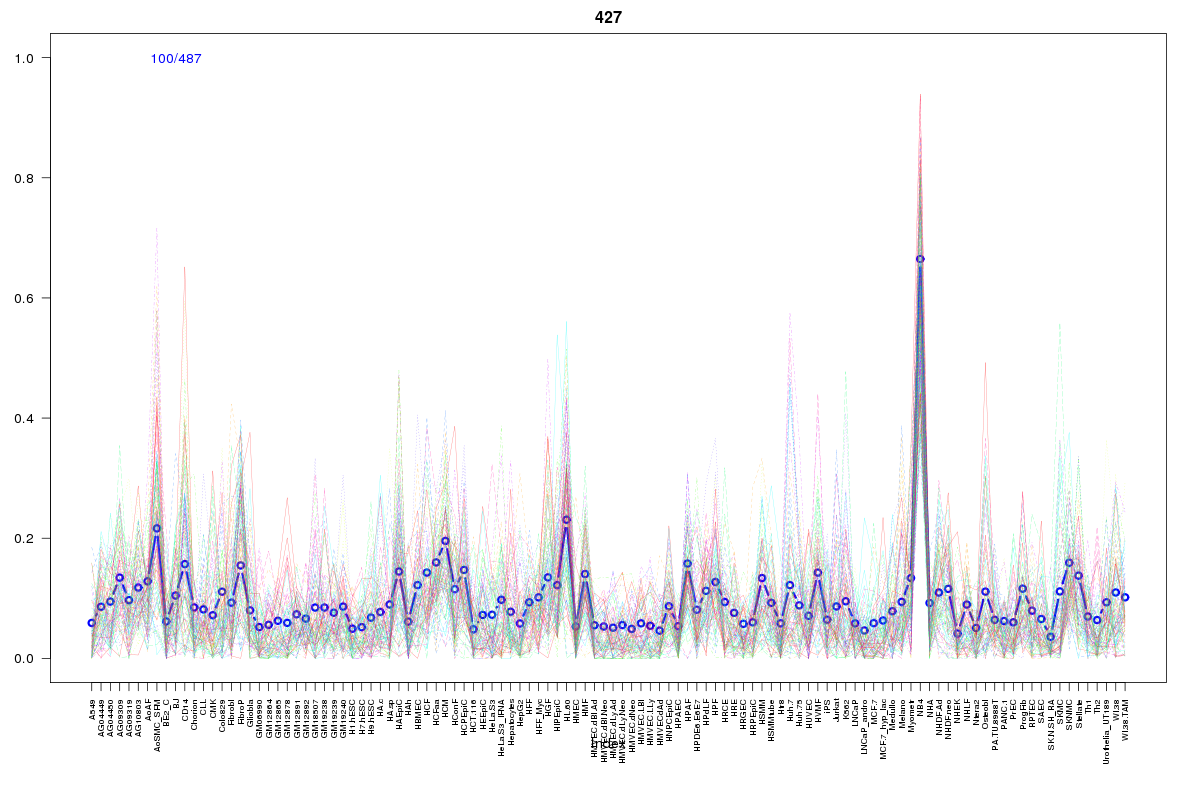 | 427 | 1 |
 | 2110 | 1 |
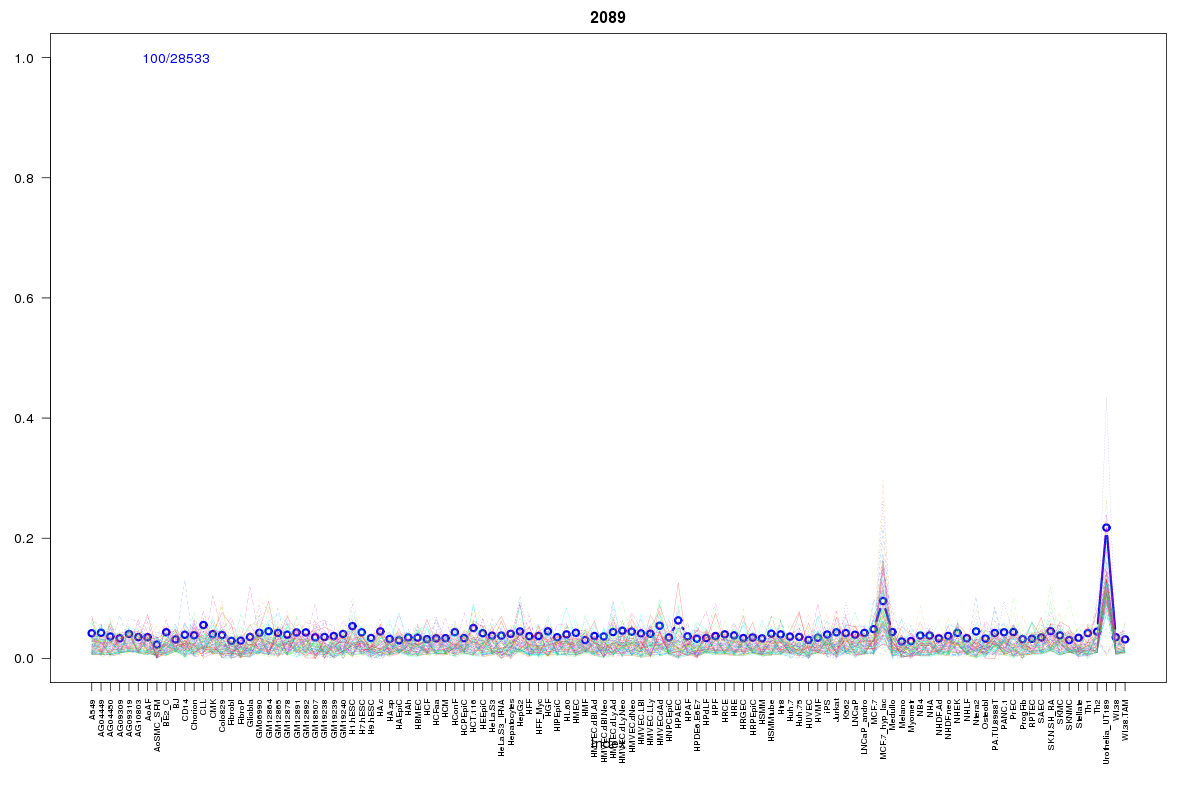 | 2089 | 1 |
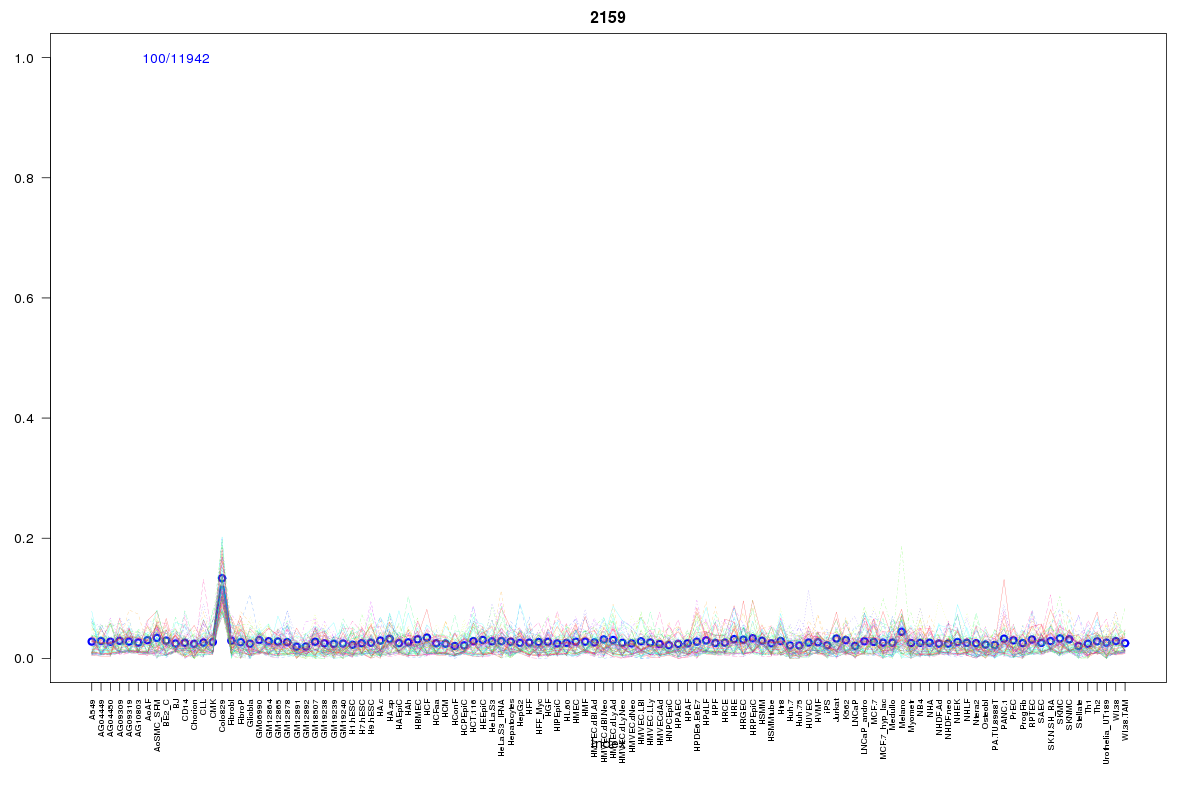 | 2159 | 1 |
Resources
BED file downloads
Connects to 10 DHS sitesTop 10 Correlated DHS Sites
p-values indiciate significant higher or lower correlation| Location | Cluster | P-value |
|---|---|---|
| chr7:89976180-89976330 | 1269 | 0 |
| chr7:90033725-90033875 | 2110 | 0.003 |
| chr7:90033500-90033650 | 427 | 0.006 |
| chr7:89895180-89895330 | 2230 | 0.009 |
| chr7:89873385-89873535 | 2159 | 0.019 |
| chr7:89954920-89955070 | 2186 | 0.024 |
| chr7:89880680-89880830 | 2230 | 0.024 |
| chr7:90115160-90115310 | 2186 | 0.024 |
| chr7:89951105-89951255 | 927 | 0.017 |
| chr7:90071945-90072095 | 2089 | 0.002 |
External Databases
UCSCEnsembl (ENSG00000105793)