Gene: ATP13A4
chr3: 193119865-193136772Expression Profile
(log scale)
Graphical Connections
Distribution of linked clusters:
You may find it interesting if many of the connected DHS sites belong to the same cluster.| Cluster Profile | Cluster ID | Number of DHS sites in this cluster |
|---|---|---|
 | 1605 | 2 |
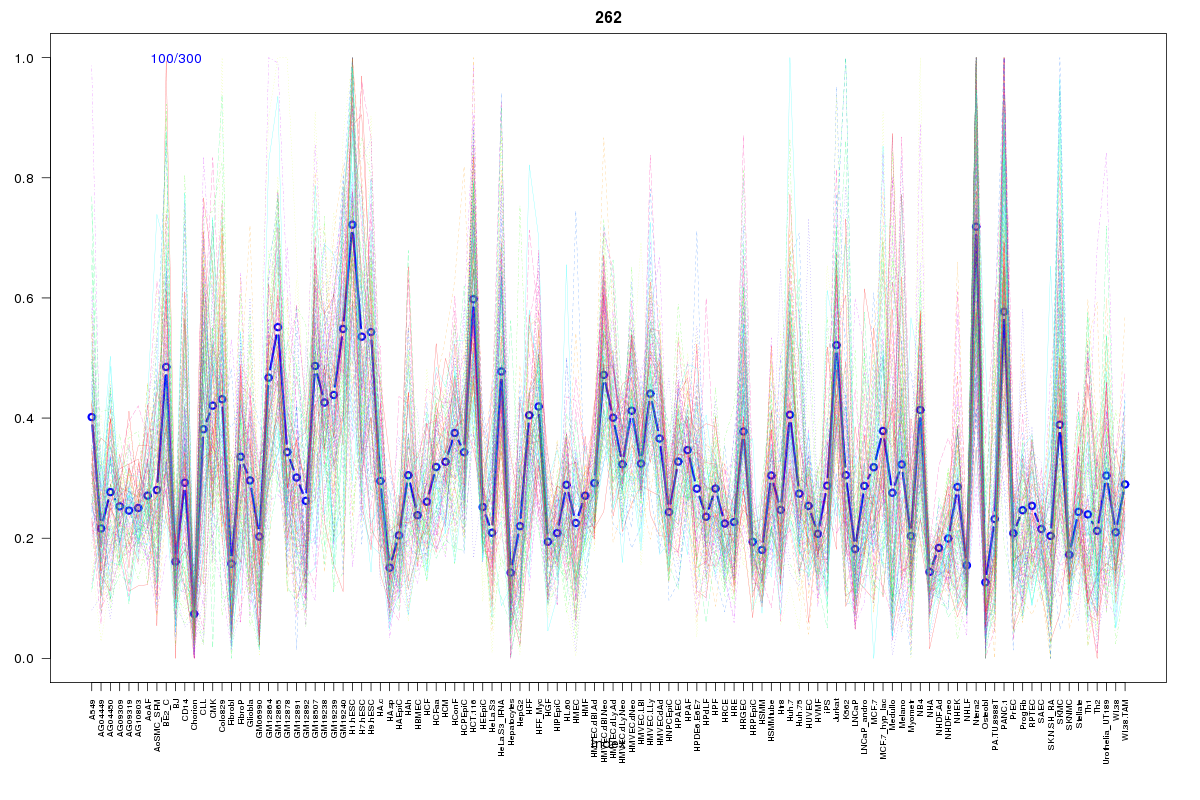 | 262 | 1 |
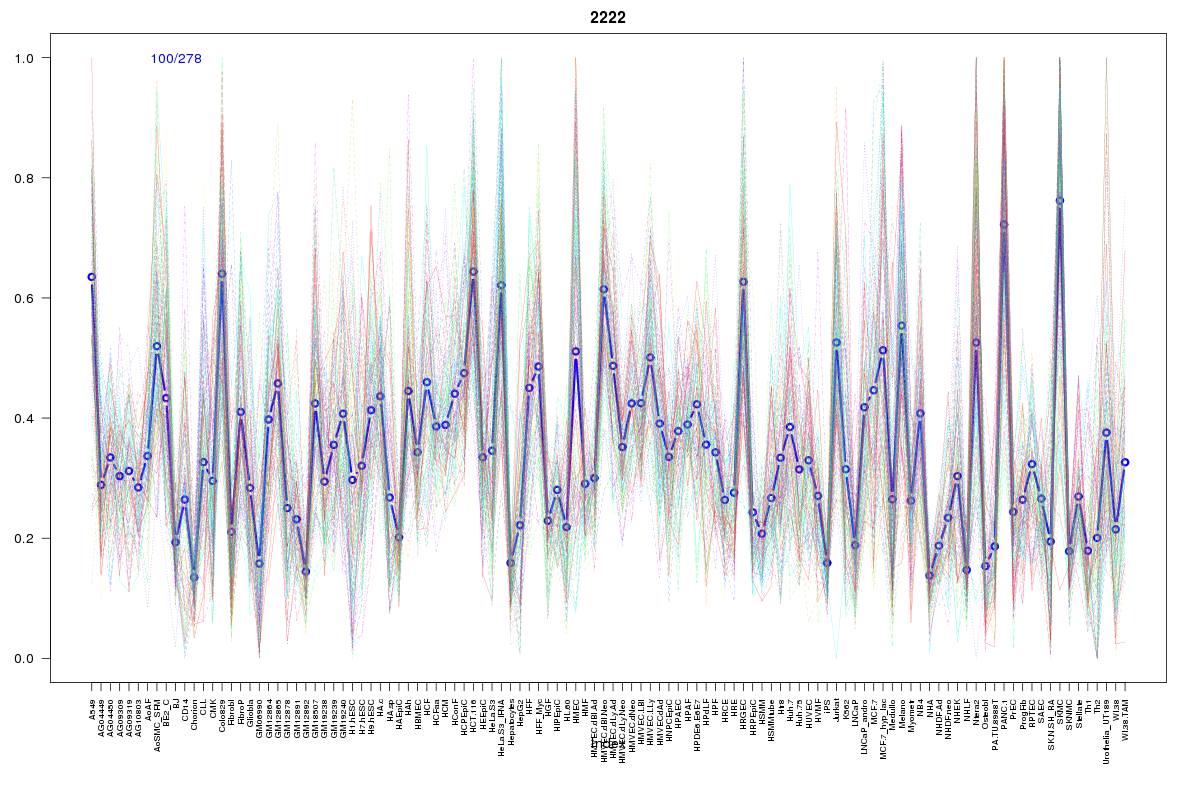 | 2222 | 1 |
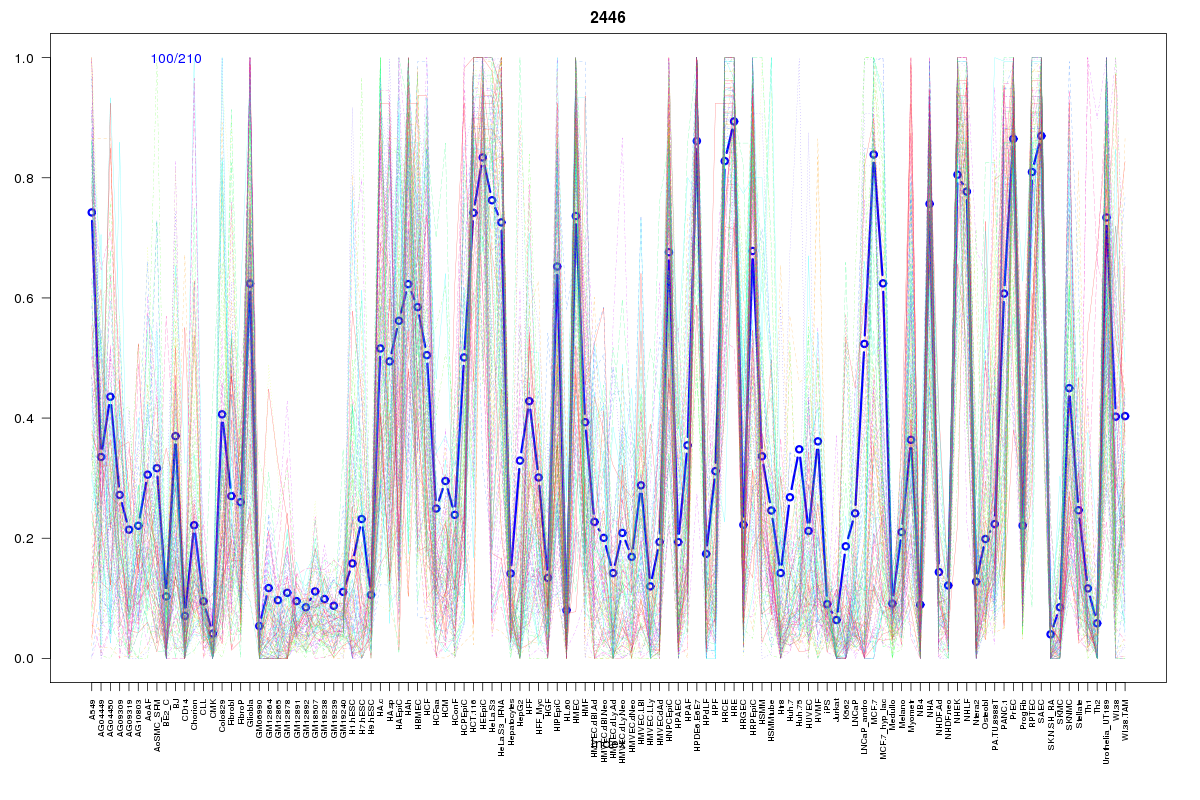 | 2446 | 1 |
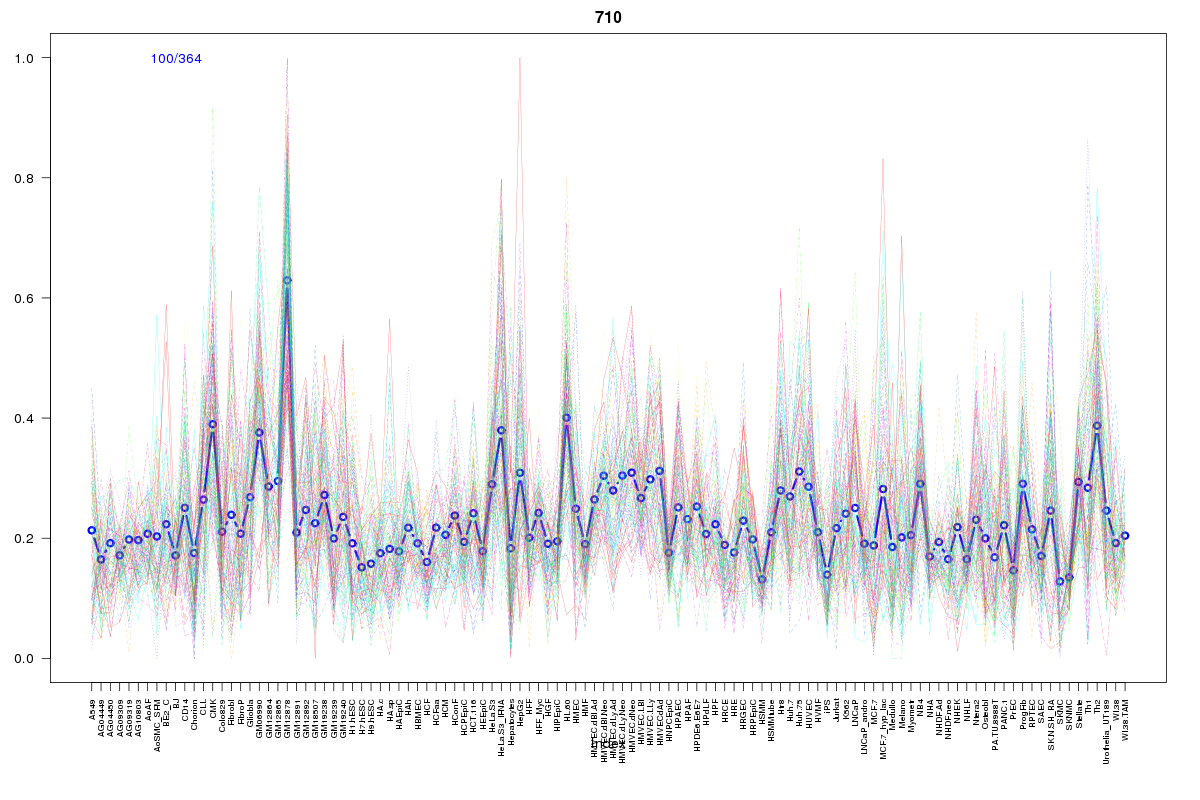 | 710 | 1 |
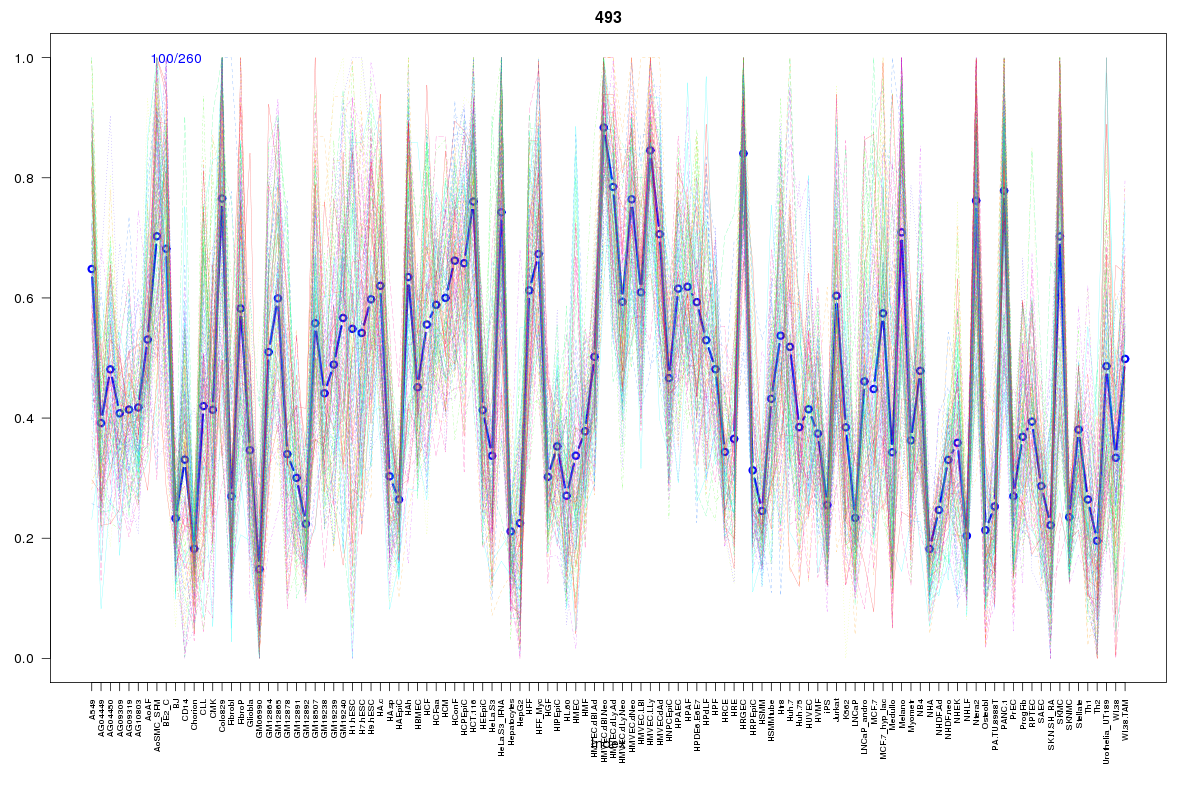 | 493 | 1 |
Resources
BED file downloads
Connects to 7 DHS sitesTop 10 Correlated DHS Sites
p-values indiciate significant higher or lower correlation| Location | Cluster | P-value |
|---|---|---|
| chr3:193238625-193238775 | 1605 | 0.017 |
| chr3:193262200-193262350 | 1605 | 0.021 |
| chr3:193308020-193308170 | 2446 | 0.017 |
| chr3:193311640-193311790 | 710 | 0.01 |
| chr3:193290320-193290470 | 2222 | 0.006 |
| chr3:193179540-193179690 | 262 | 0.003 |
| chr3:193323820-193323970 | 493 | 0.003 |
External Databases
UCSCEnsembl (ENSG00000127249)