Gene: Y_RNA
chr1: 89485928-89486048Expression Profile
(log scale)
Graphical Connections
Distribution of linked clusters:
You may find it interesting if many of the connected DHS sites belong to the same cluster.| Cluster Profile | Cluster ID | Number of DHS sites in this cluster |
|---|---|---|
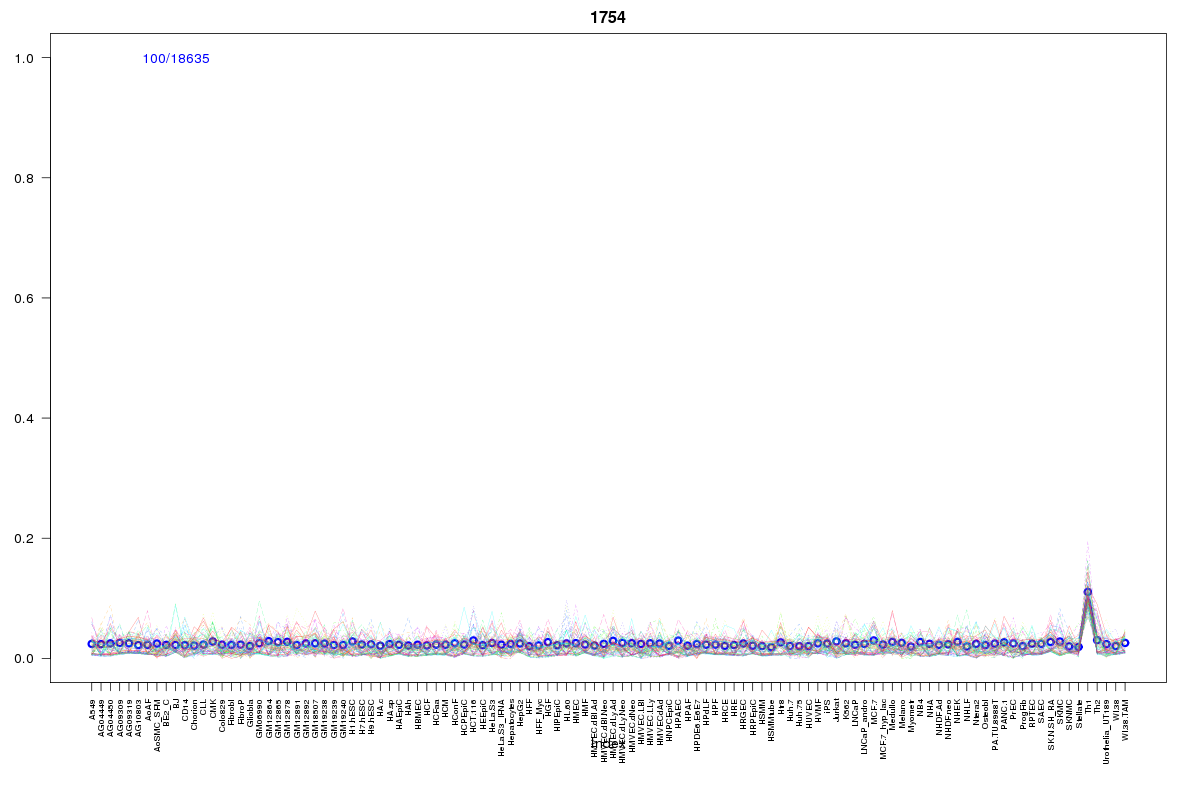 | 1754 | 3 |
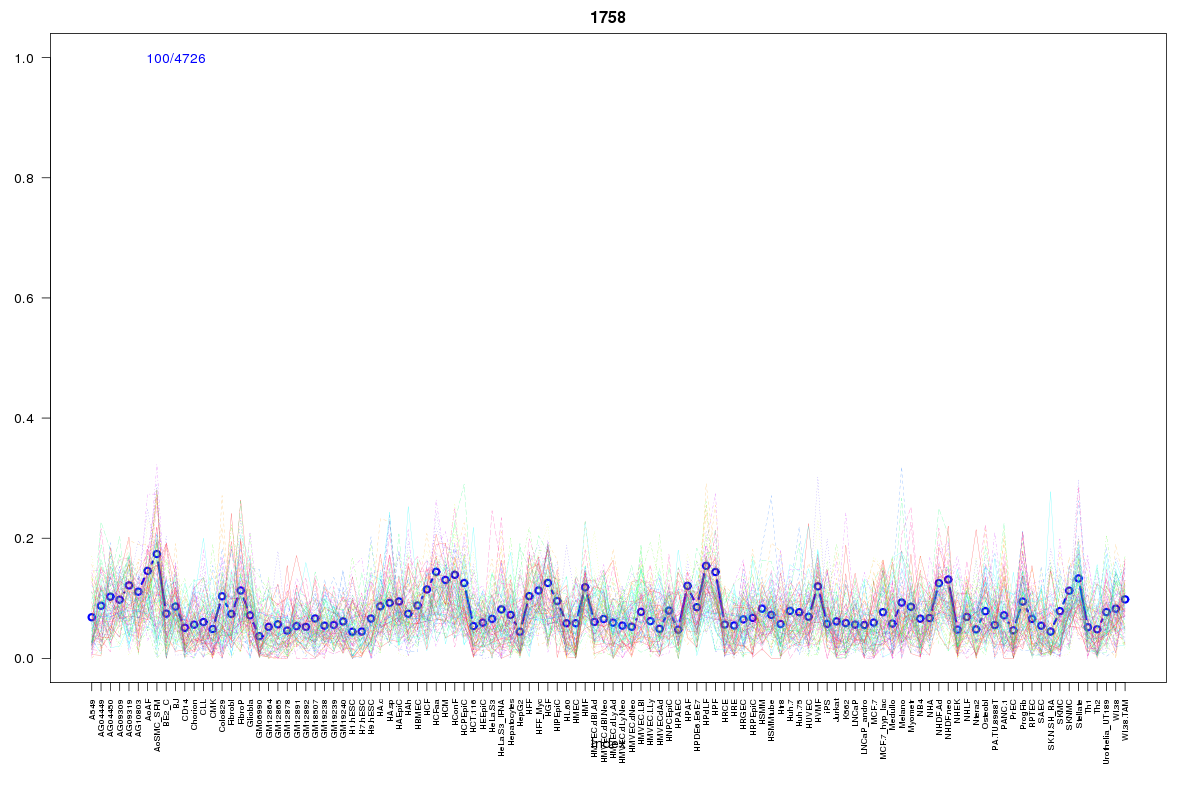 | 1758 | 1 |
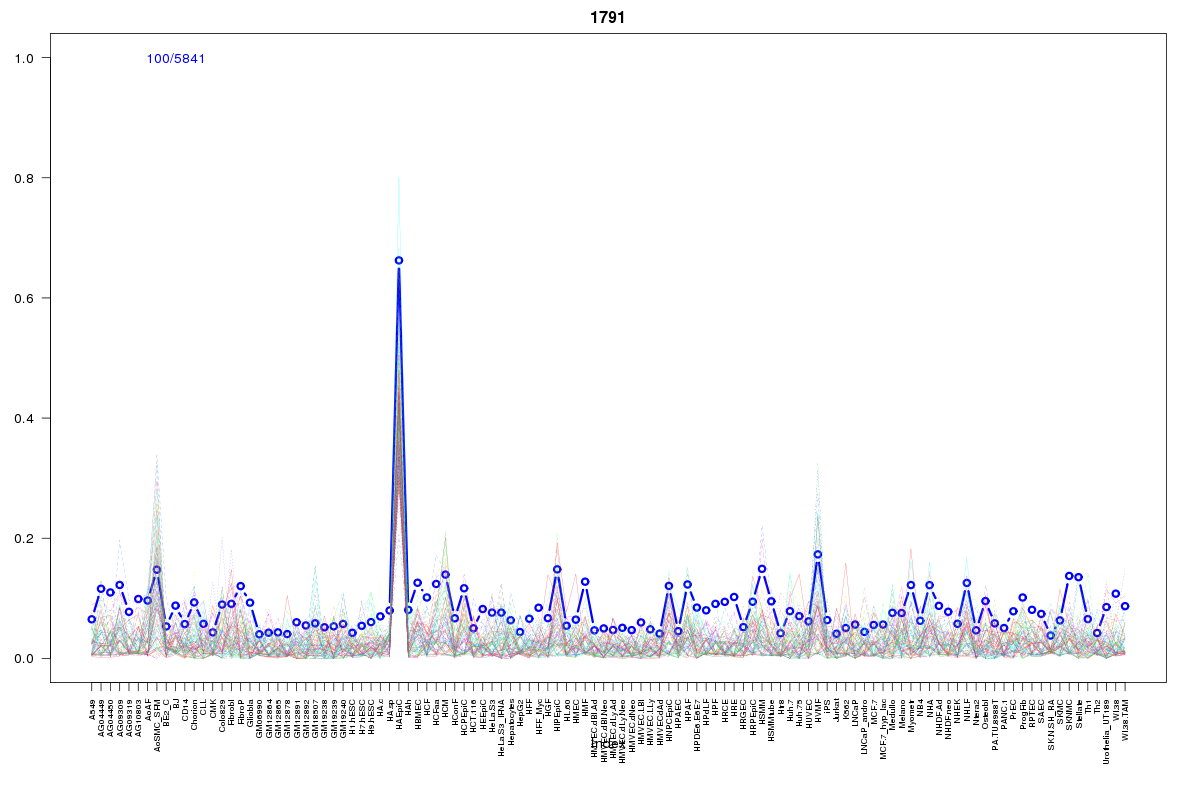 | 1791 | 1 |
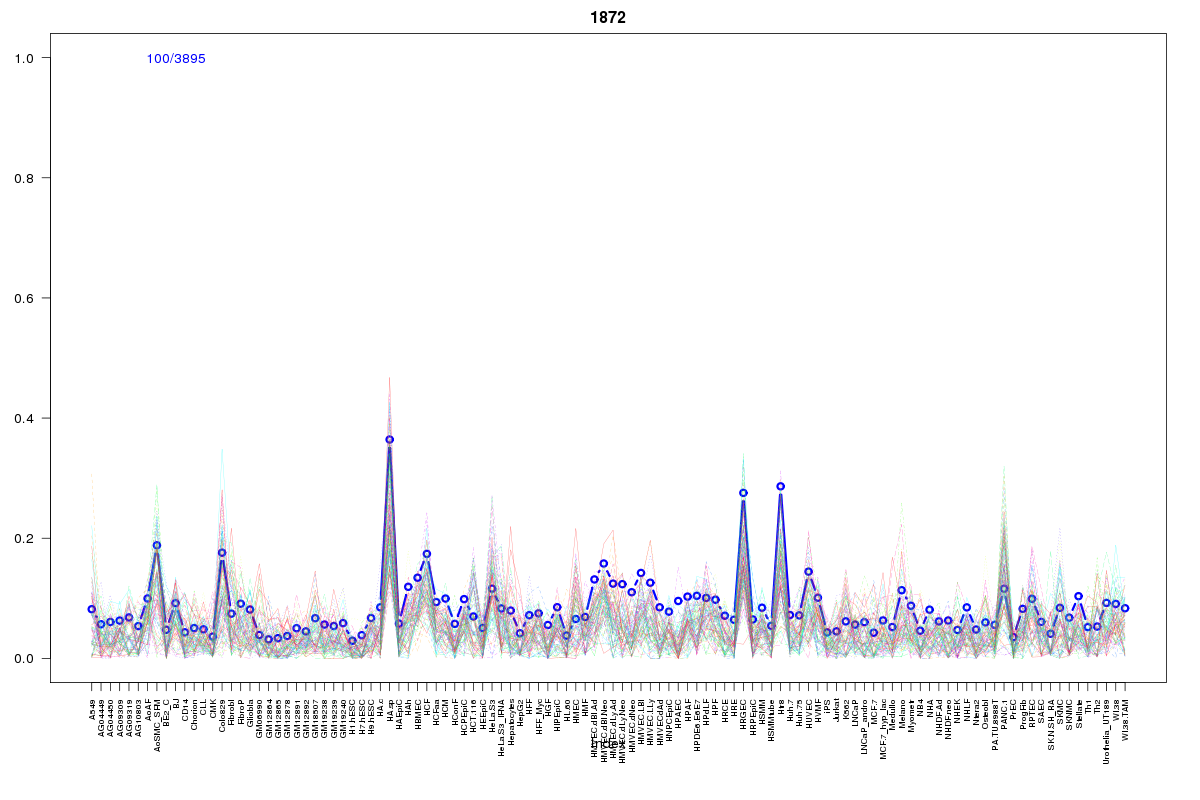 | 1872 | 1 |
 | 1721 | 1 |
 | 1755 | 1 |
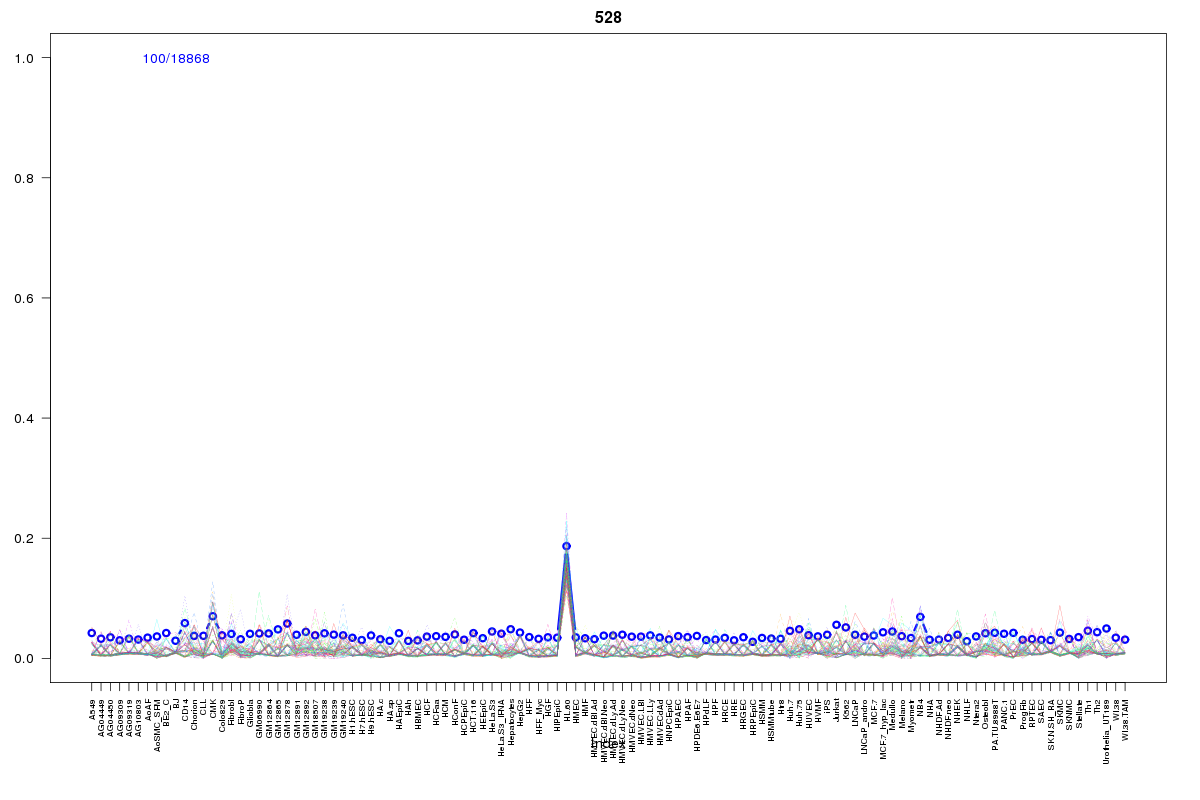 | 528 | 1 |
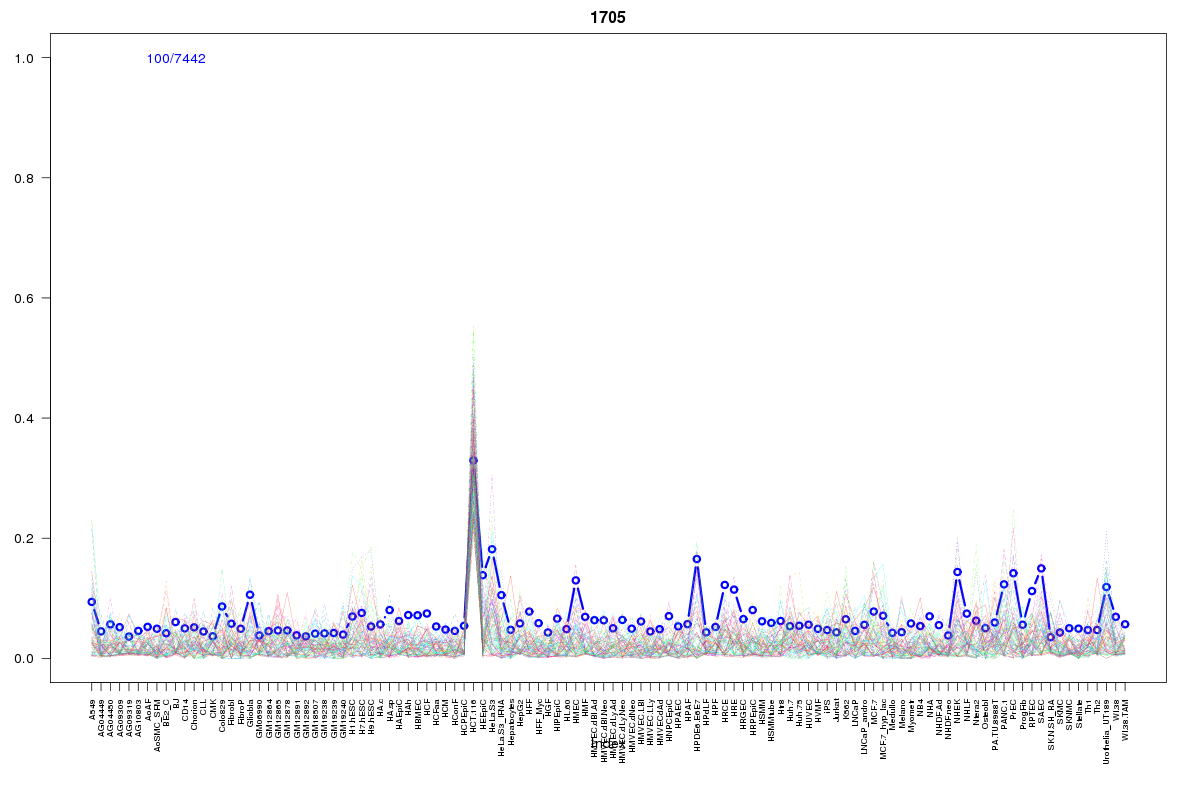 | 1705 | 1 |
Resources
BED file downloads
Connects to 10 DHS sitesTop 10 Correlated DHS Sites
p-values indiciate significant higher or lower correlation| Location | Cluster | P-value |
|---|---|---|
| chr1:89528745-89528895 | 1754 | 0.009 |
| chr1:89578280-89578430 | 1721 | 0.009 |
| chr1:89463400-89463550 | 1754 | 0.01 |
| chr1:89512580-89512730 | 1791 | 0.013 |
| chr1:89579105-89579255 | 1755 | 0.016 |
| chr1:89581765-89581915 | 1754 | 0.018 |
| chr1:89530380-89530530 | 1872 | 0.019 |
| chr1:89451440-89451590 | 1705 | 0.021 |
| chr1:89395980-89396130 | 528 | 0.021 |
| chr1:89457220-89457370 | 1758 | 0.02 |
External Databases
UCSCEnsembl (ENSG00000202385)