SOM cluster: 1055
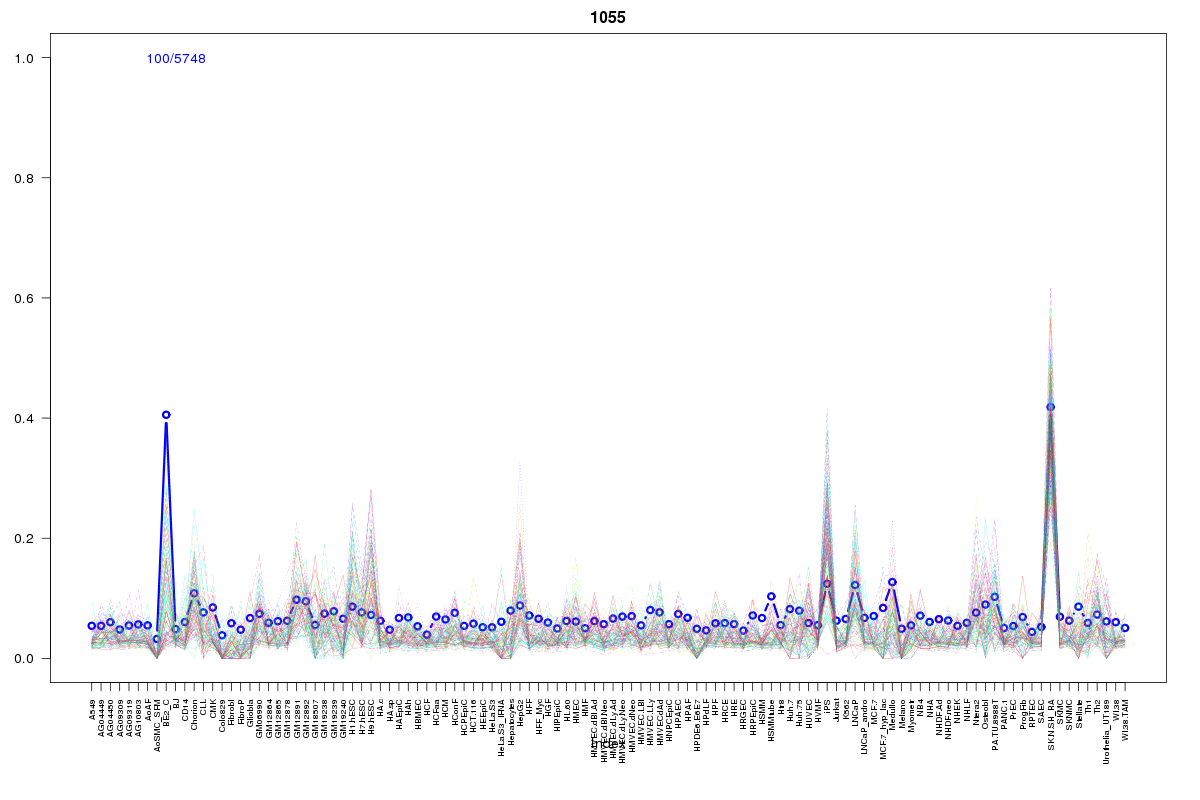
Cluster Hypersensitivity Profile

Genomic Location Trend
These plots show the distribution of the DHS sites surrounding the Transcript Start Site of the nearest gene.
Stats
Number of sites: 5748Promoter: 10%
CpG-Island: 47%
Conserved: 45%
Enriched Motifs & Matches
Match Detail: [Jaspar]
|
| ||
|---|---|---|
| Sites: 100/100 | e-val: 0 | ||
| Factor | e-val(match) | DB |
| SP1 | 0.0000019917 | JASPAR |
| PLAG1 | 0.00019569 | JASPAR |
| TFAP2A | 0.00055672 | JASPAR |
| Klf4 | 0.00081839 | JASPAR |
| Pax4 | 0.007834 | JASPAR |
|
| ||
| Sites: 73/100 | e-val: 8.7e-31 | ||
| Factor | e-val(match) | DB |
| SP1 | 0.000000046825 | JASPAR |
| ESR1 | 0.000093218 | JASPAR |
| RXR::RAR_DR5 | 0.00012593 | JASPAR |
| PLAG1 | 0.00014591 | JASPAR |
| INSM1 | 0.00035597 | JASPAR |
|
| ||
| Sites: 51/100 | e-val: 0.0069 | ||
| Factor | e-val(match) | DB |
| Myf | 0.0015937 | JASPAR |
| NHLH1 | 0.0023776 | JASPAR |
| TFAP2A | 0.021883 | JASPAR |
| Klf4 | 0.041833 | JASPAR |
| SP1 | 0.071243 | JASPAR |
BED file downloads
Top 10 Example Regions
| Location | Gene Link | Dist. |
|---|---|---|
| chr3: 38621260-38621410 | DDTP1 | 35.85 |
| chrX: 102000545-102000695 | BHLHB9 | 39.36 |
| chrX: 102000545-102000695 | GPRASP2 | 39.36 |
| chrX: 110339525-110339675 | PAK3 | 40.84 |
| chr3: 128174765-128174915 | TMED10P2 | 40.95 |
| chr17: 48698565-48698715 | LUC7L3 | 42.33 |
| chr17: 72804200-72804350 | FDXR | 42.58 |
| chr4: 96046320-96046470 | BMPR1B | 43.96 |
| chr17: 15821125-15821275 | ZSWIM7 | 44.93 |
| chr1: 2799605-2799755 | TTC34 | 46.55 |