SOM cluster: 1686
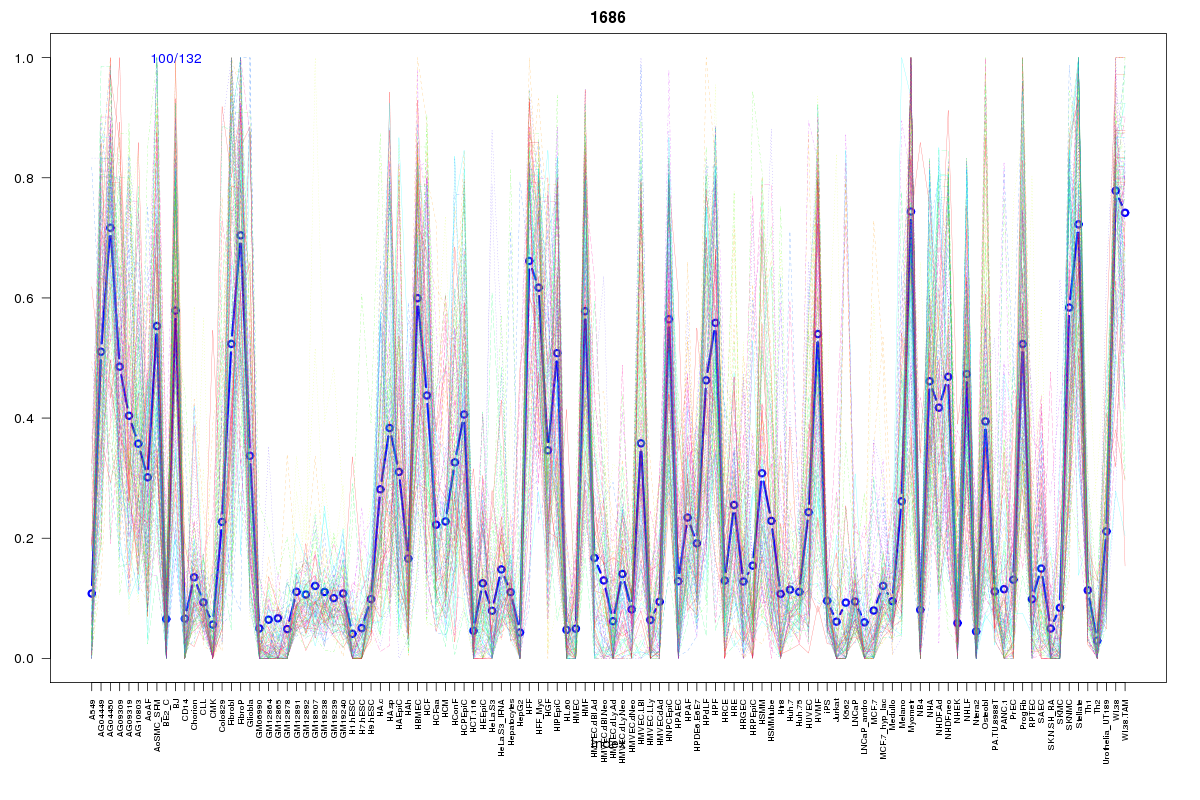
Cluster Hypersensitivity Profile

Genomic Location Trend
These plots show the distribution of the DHS sites surrounding the Transcript Start Site of the nearest gene.
Stats
Number of sites: 132Promoter: 2%
CpG-Island: 0%
Conserved: 37%
Enriched Motifs & Matches
Match Detail: [Jaspar]
|
| ||
|---|---|---|
| Sites: 47/100 | e-val: 5.9e-24 | ||
| Factor | e-val(match) | DB |
| AP1 | 0.00000000067123 | JASPAR |
| NFE2L2 | 0.0000013936 | JASPAR |
| PBX1 | 0.0040546 | JASPAR |
| NFE2L1::MafG | 0.013852 | JASPAR |
| Pax6 | 0.021299 | JASPAR |
BED file downloads
Top 10 Example Regions
| Location | Gene Link | Dist. |
|---|---|---|
| chrX: 7057420-7057570 | STS | 40.5 |
| chr5: 148585740-148585890 | ABLIM3 | 45.62 |
| chr5: 148585740-148585890 | RN7SKP145 | 45.62 |
| chr5: 148585740-148585890 | CTC-529P8.1 | 45.62 |
| chr3: 169529440-169529590 | LRRC31 | 49.55 |
| chr1: 45277400-45277550 | PLK3 | 56.28 |
| chr1: 45277400-45277550 | RP11-269F19.2 | 56.28 |
| chr1: 45277400-45277550 | PTCH2 | 56.28 |
| chr1: 45277400-45277550 | SNORD46 | 56.28 |
| chr1: 45277400-45277550 | RPS8 | 56.28 |