SOM cluster: 1976
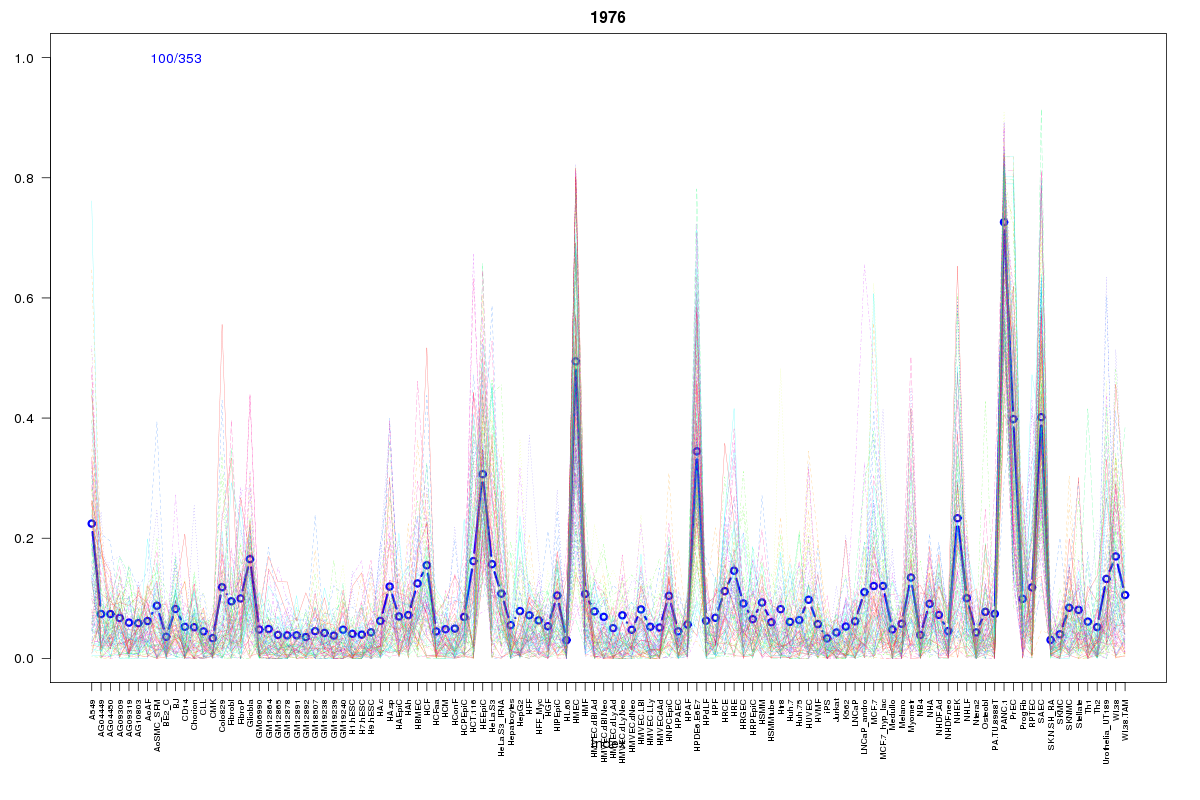
Cluster Hypersensitivity Profile

Genomic Location Trend
These plots show the distribution of the DHS sites surrounding the Transcript Start Site of the nearest gene.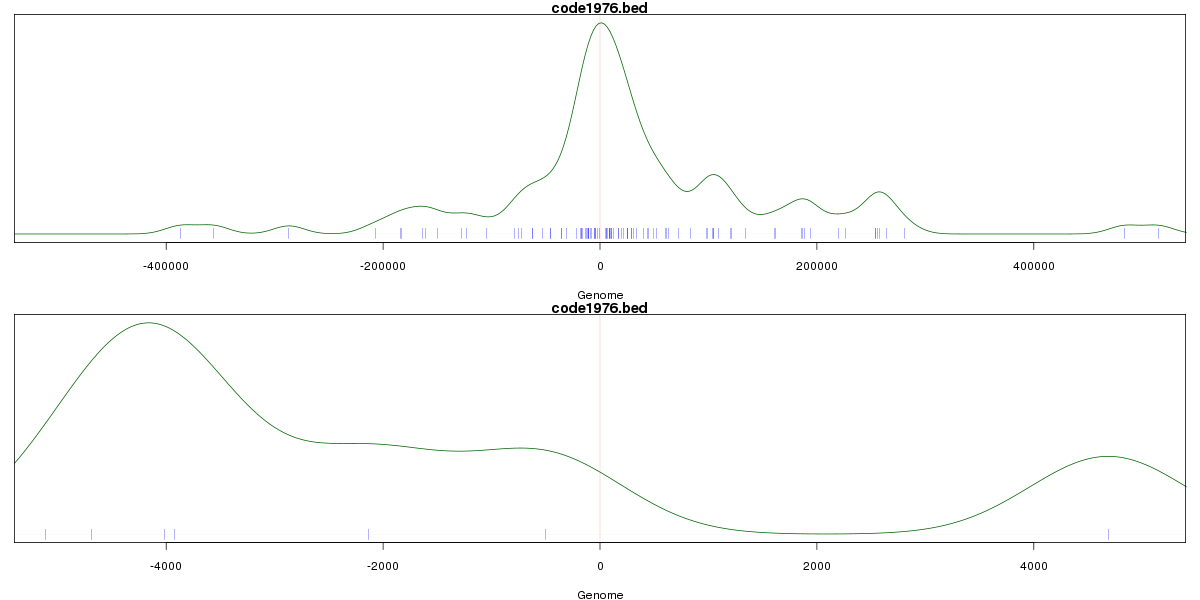
Stats
Number of sites: 353Promoter: 1%
CpG-Island: 0%
Conserved: 17%
Enriched Motifs & Matches
No motifs found.BED file downloads
Top 10 Example Regions
| Location | Gene Link | Dist. |
|---|---|---|
| chr12: 117699160-117699310 | NOS1 | 27.4 |
| chr2: 26223460-26223610 | RAB10 | 30.11 |
| chr8: 110610080-110610230 | SYBU | 43.69 |
| chr8: 110610080-110610230 | RP11-422N16.3 | 43.69 |
| chr4: 187649500-187649650 | FAT1 | 48.38 |
| chr1: 8085220-8085370 | TNFRSF9 | 55.7 |
| chr1: 8085220-8085370 | CTA-215D11.4 | 55.7 |
| chr7: 55177320-55177470 | EGFR | 62.66 |
| chr3: 12793160-12793310 | TMEM40 | 63.49 |
| chr3: 45186885-45187035 | CDCP1 | 64.74 |