Gene: TCN1
chr11: 59620272-59634048Expression Profile
(log scale)
Graphical Connections
Distribution of linked clusters:
You may find it interesting if many of the connected DHS sites belong to the same cluster.| Cluster Profile | Cluster ID | Number of DHS sites in this cluster |
|---|---|---|
 | 862 | 4 |
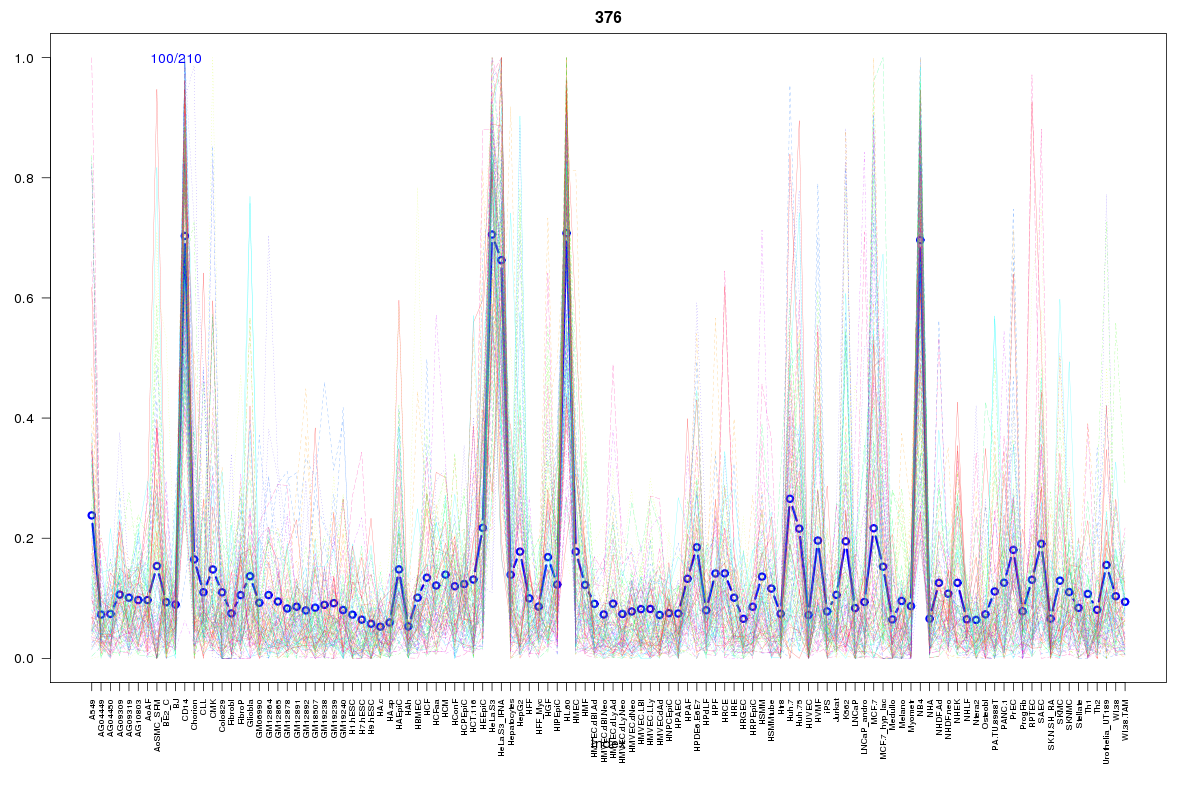 | 376 | 1 |
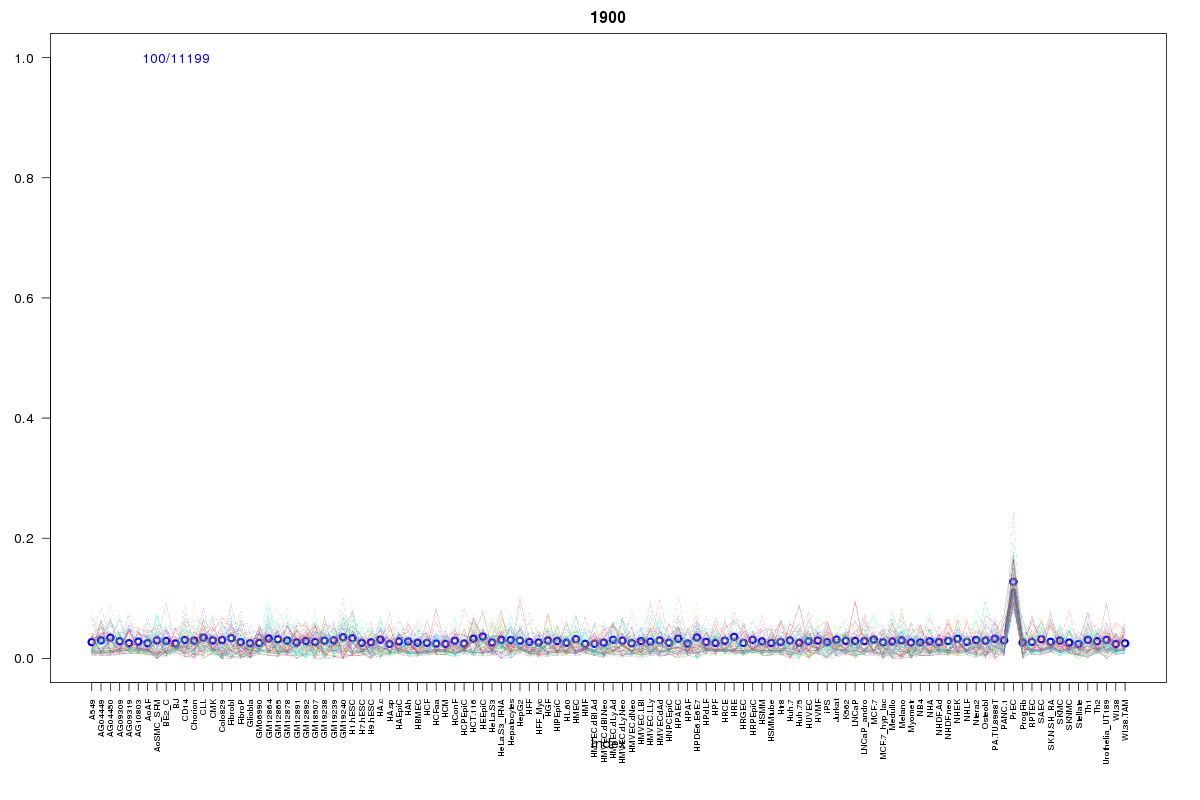 | 1900 | 1 |
 | 1605 | 1 |
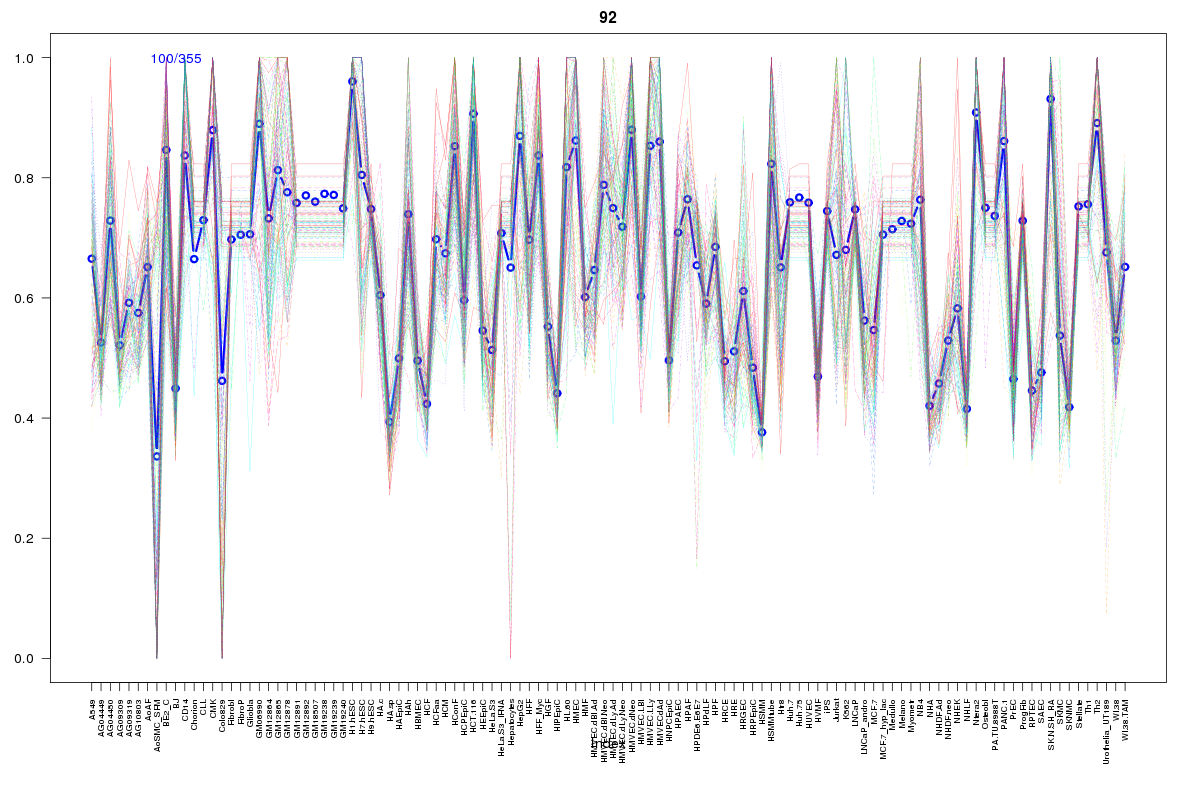 | 92 | 1 |
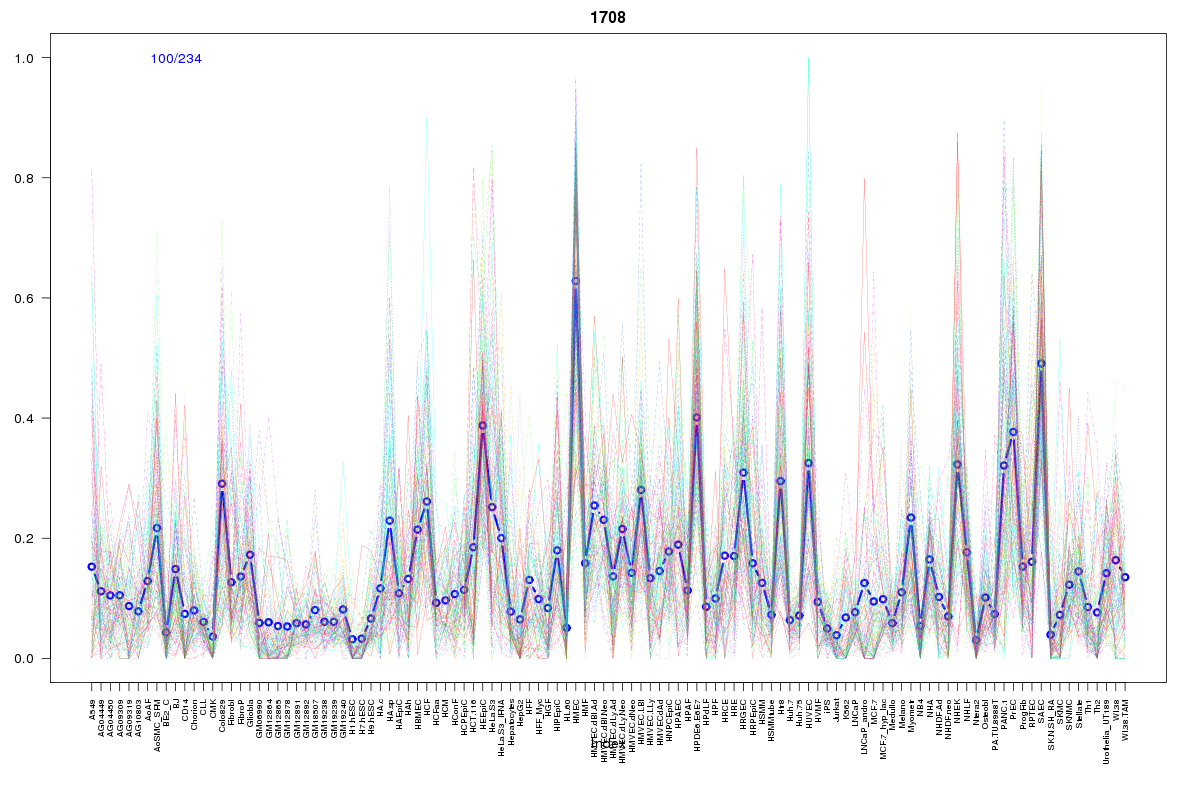 | 1708 | 1 |
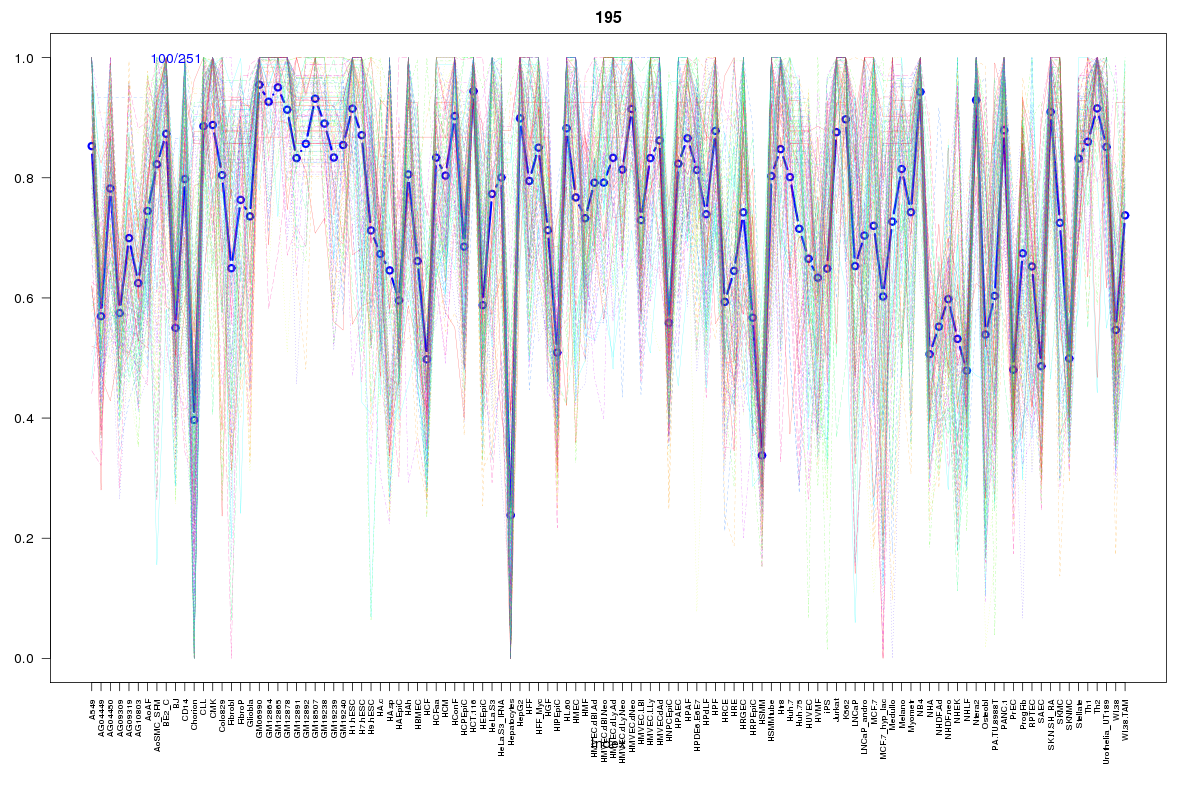 | 195 | 1 |
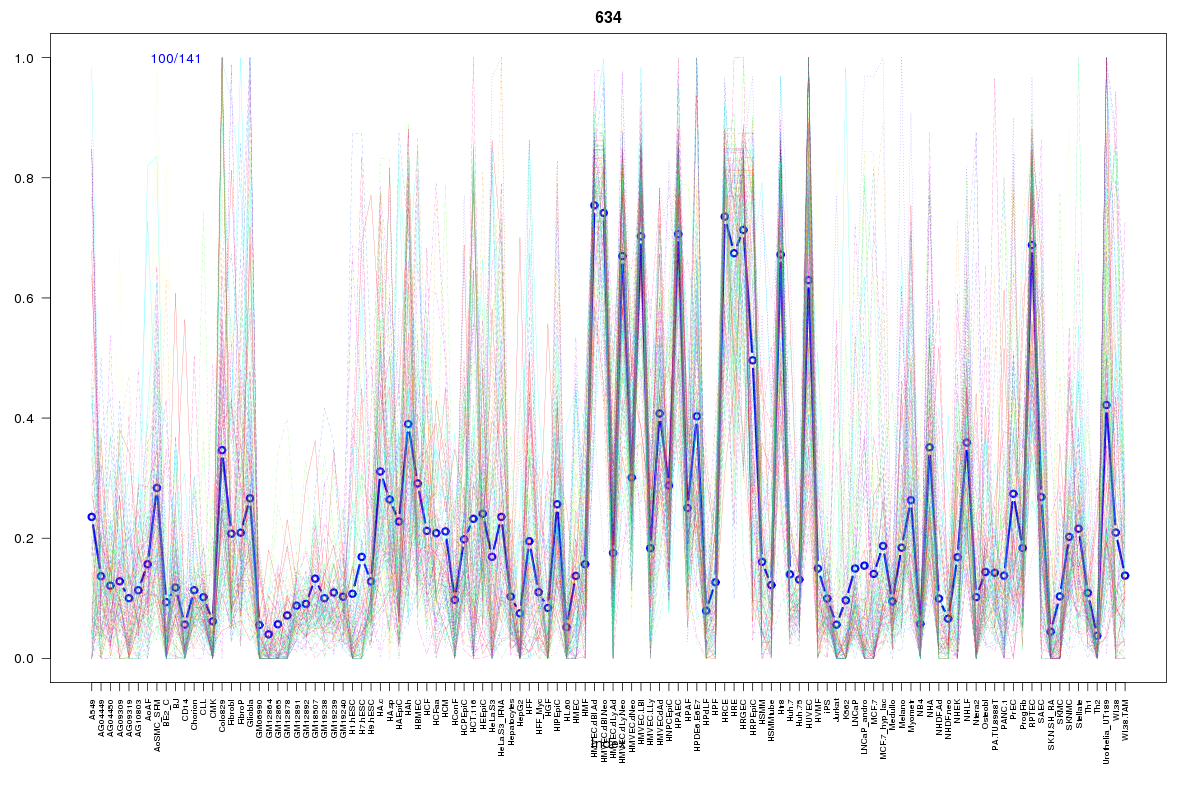 | 634 | 1 |
Resources
BED file downloads
Connects to 11 DHS sitesTop 10 Correlated DHS Sites
p-values indiciate significant higher or lower correlation| Location | Cluster | P-value |
|---|---|---|
| chr11:59524020-59524170 | 1708 | 0.009 |
| chr11:59634000-59634150 | 376 | 0.01 |
| chr11:59528360-59528510 | 862 | 0.014 |
| chr11:59685500-59685650 | 1900 | 0.015 |
| chr11:59616485-59616635 | 862 | 0.017 |
| chr11:59547080-59547230 | 862 | 0.017 |
| chr11:59716480-59716630 | 862 | 0.018 |
| chr11:59632640-59632790 | 634 | 0.02 |
| chr11:59723120-59723270 | 1605 | 0.024 |
| chr11:59521600-59521750 | 92 | 0.013 |
| chr11:59578285-59578435 | 195 | 0.01 |
External Databases
UCSCEnsembl (ENSG00000134827)