Gene: S100A1
chr1: 153600401-153604510Expression Profile
(log scale)
Graphical Connections
Distribution of linked clusters:
You may find it interesting if many of the connected DHS sites belong to the same cluster.| Cluster Profile | Cluster ID | Number of DHS sites in this cluster |
|---|---|---|
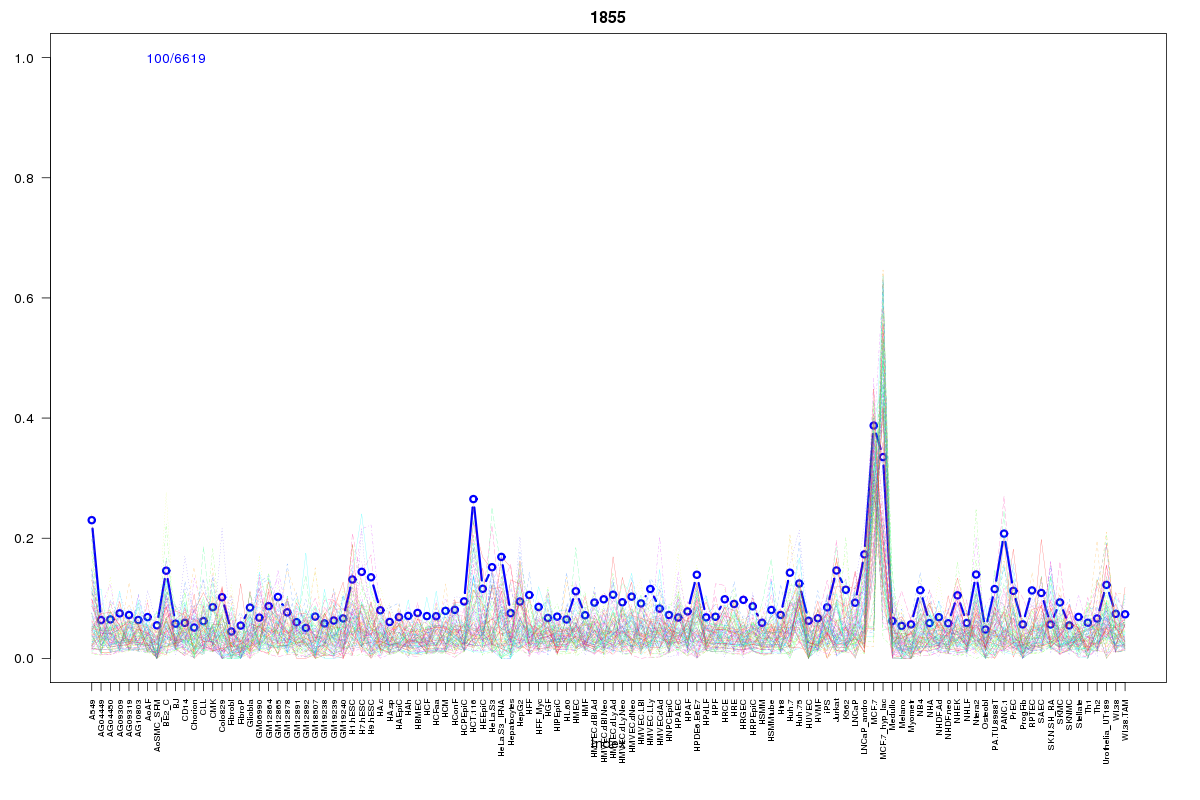 | 1855 | 1 |
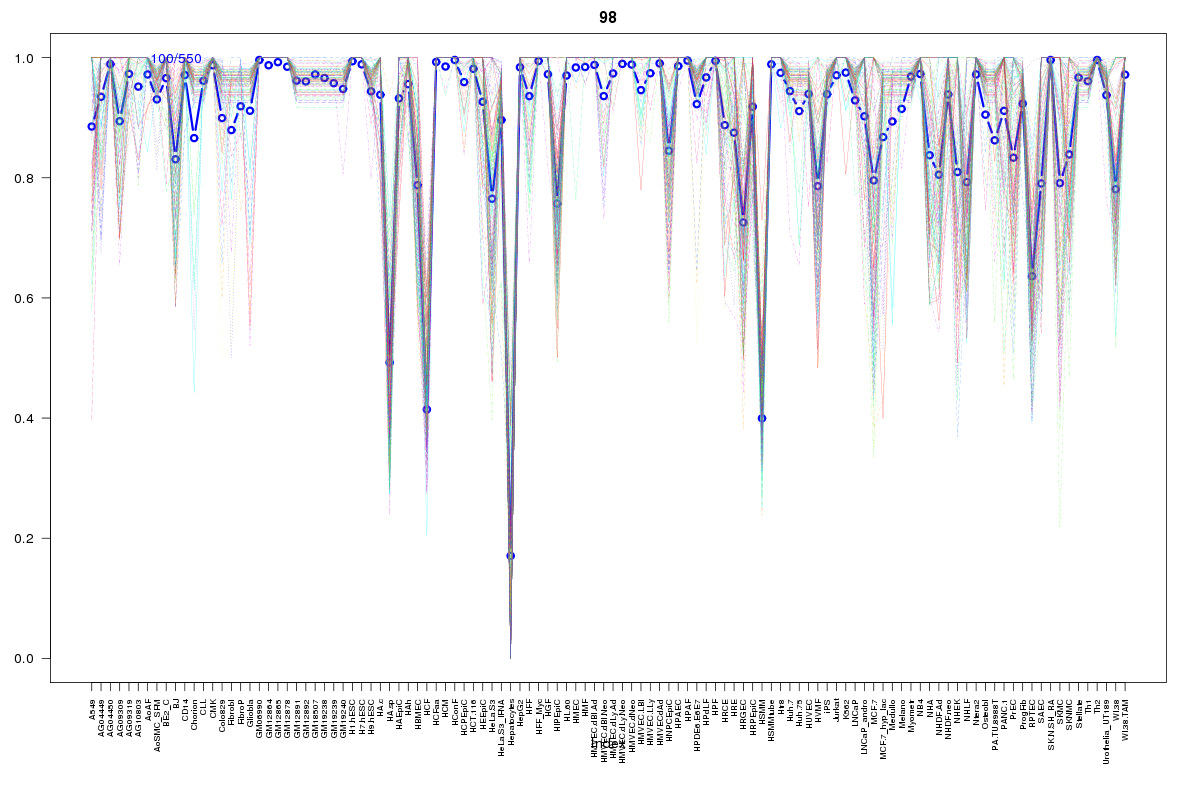 | 98 | 1 |
 | 979 | 1 |
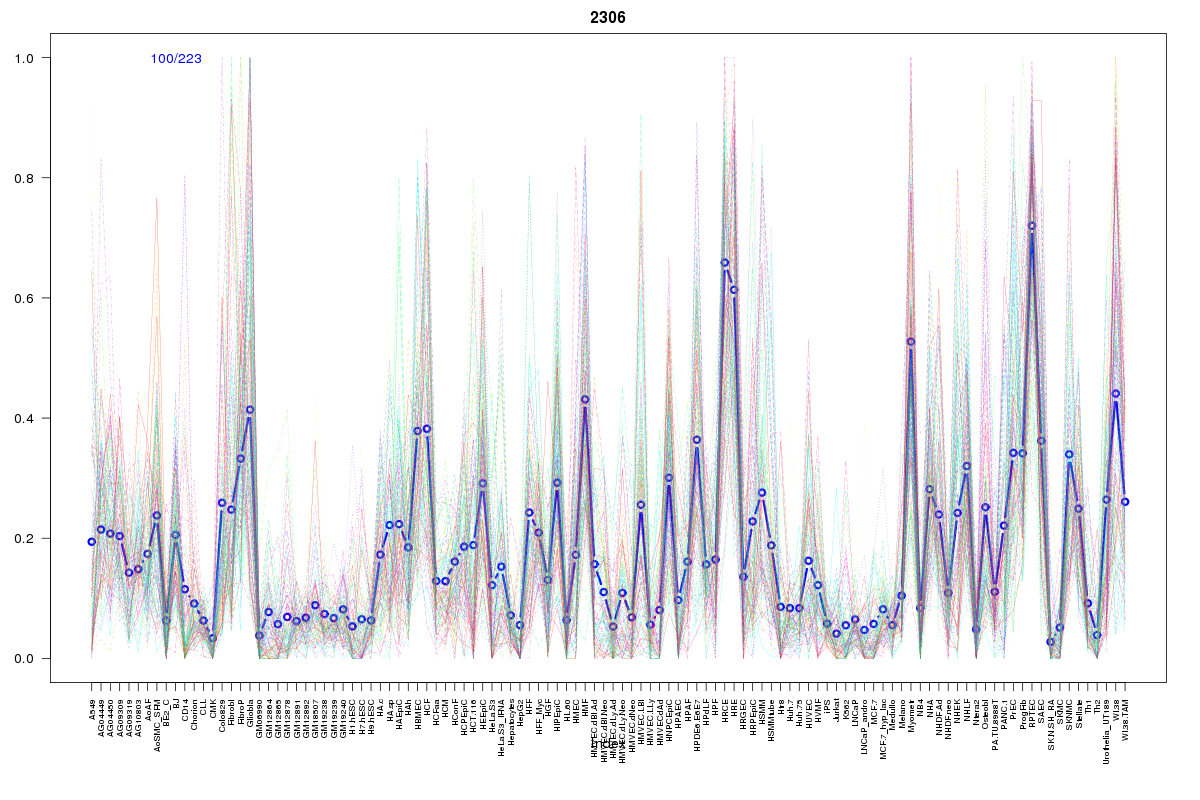 | 2306 | 1 |
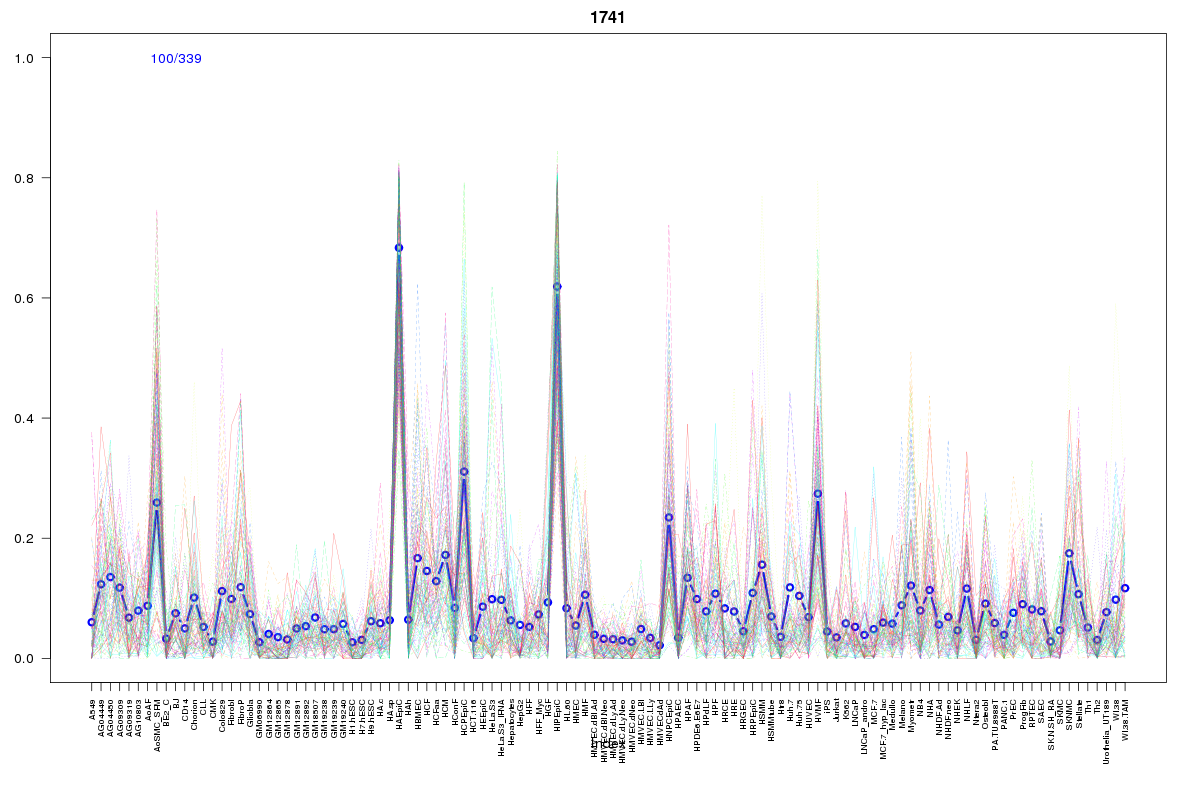 | 1741 | 1 |
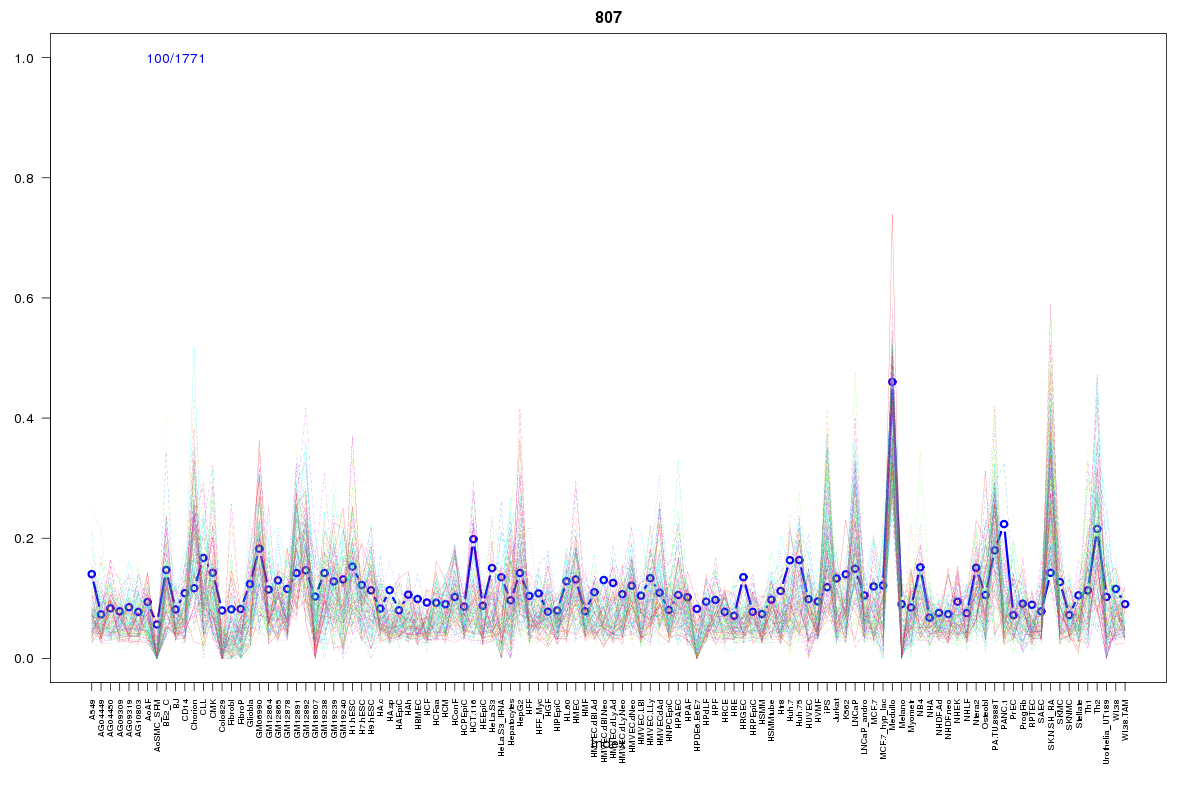 | 807 | 1 |
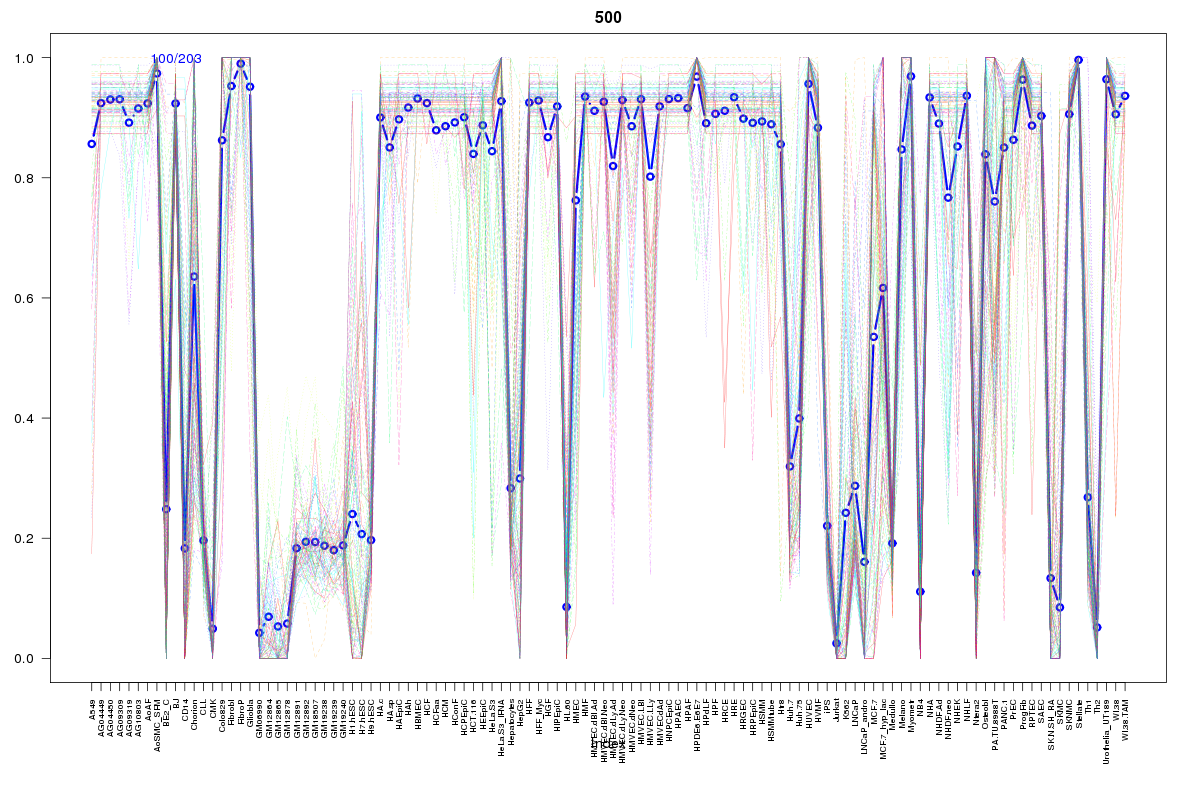 | 500 | 1 |
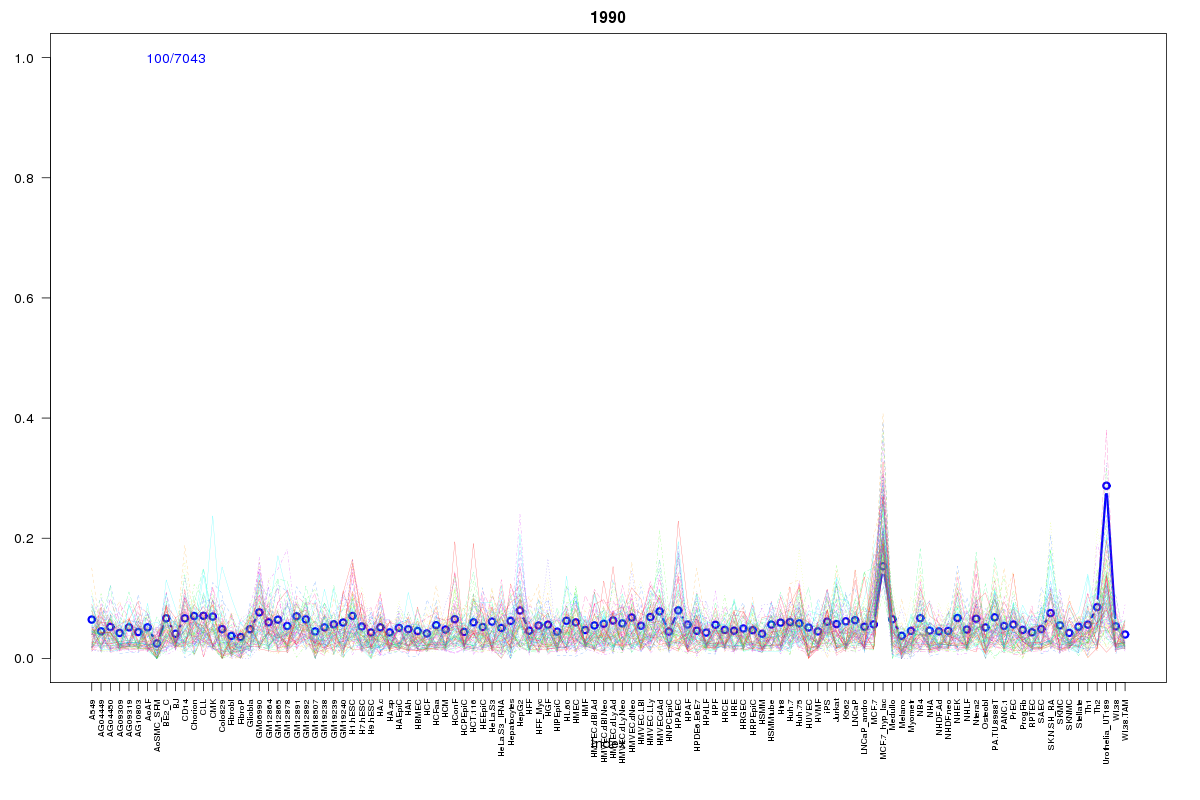 | 1990 | 1 |
Resources
BED file downloads
Connects to 8 DHS sitesTop 10 Correlated DHS Sites
p-values indiciate significant higher or lower correlation| Location | Cluster | P-value |
|---|---|---|
| chr1:153515685-153515835 | 1990 | 0.02 |
| chr1:153605885-153606035 | 1855 | 0.024 |
| chr1:153635820-153635970 | 1741 | 0.018 |
| chr1:153625480-153625630 | 979 | 0.017 |
| chr1:153606840-153606990 | 98 | 0.015 |
| chr1:153506300-153506450 | 500 | 0.009 |
| chr1:153625720-153625870 | 2306 | 0.009 |
| chr1:153651765-153651915 | 807 | 0.009 |
External Databases
UCSCEnsembl (ENSG00000160678)