Gene: TTC30A
chr2: 178477719-178483694Expression Profile
(log scale)
Graphical Connections
Distribution of linked clusters:
You may find it interesting if many of the connected DHS sites belong to the same cluster.| Cluster Profile | Cluster ID | Number of DHS sites in this cluster |
|---|---|---|
 | 2186 | 3 |
 | 1755 | 1 |
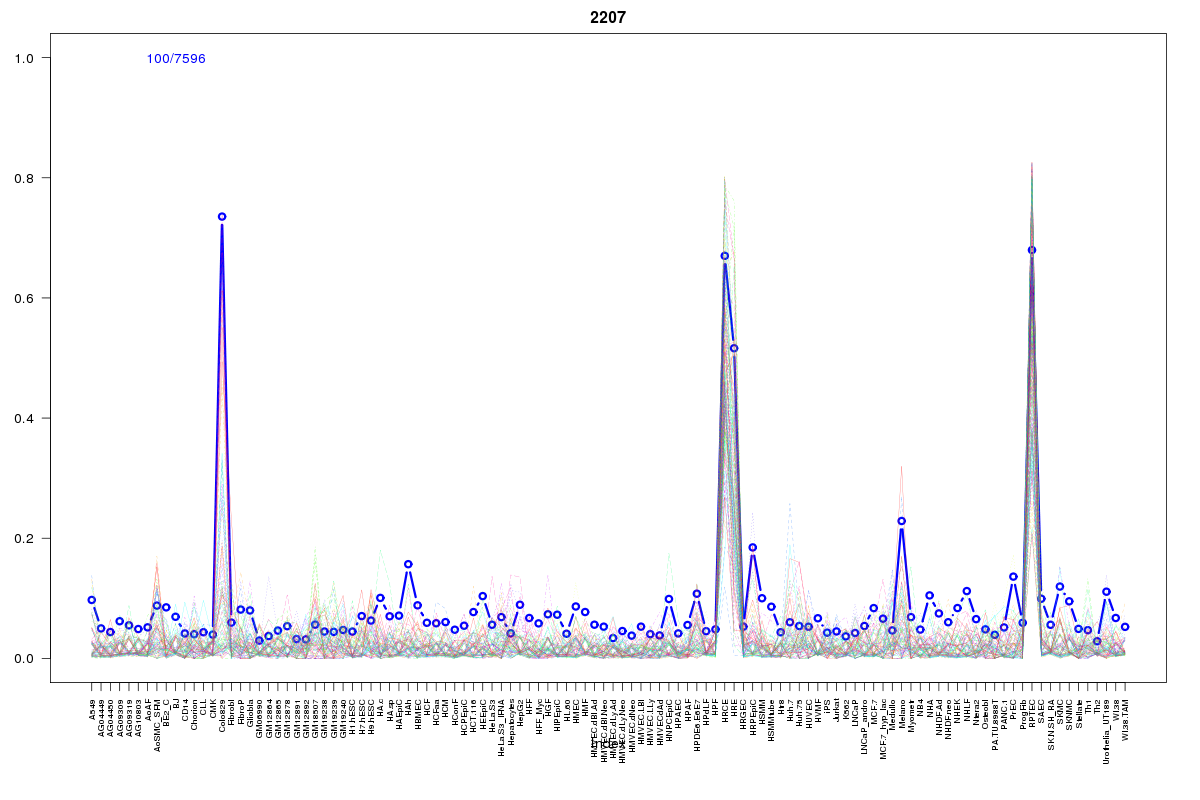 | 2207 | 1 |
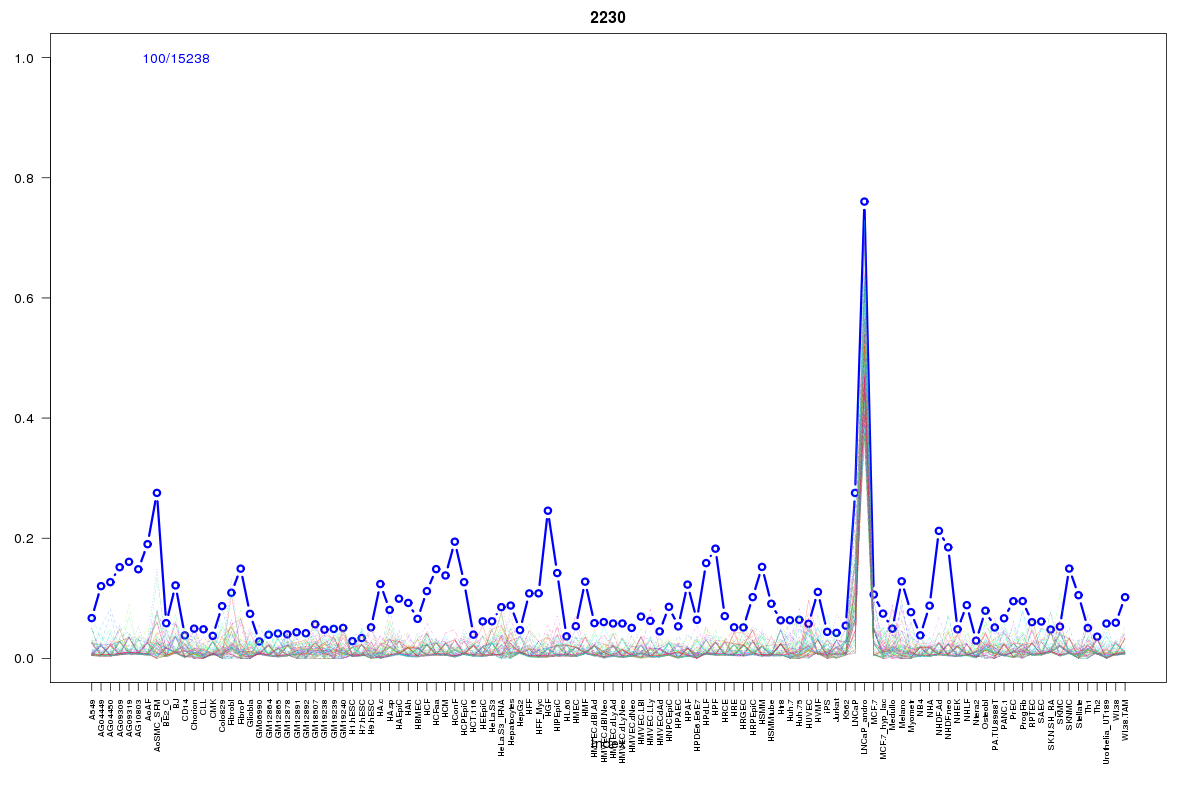 | 2230 | 1 |
 | 568 | 1 |
Resources
BED file downloads
Connects to 7 DHS sitesTop 10 Correlated DHS Sites
p-values indiciate significant higher or lower correlation| Location | Cluster | P-value |
|---|---|---|
| chr2:178437960-178438110 | 2207 | 0.004 |
| chr2:178450320-178450470 | 2230 | 0.004 |
| chr2:178525360-178525510 | 2186 | 0.006 |
| chr2:178424525-178424675 | 2186 | 0.013 |
| chr2:178471960-178472110 | 2186 | 0.013 |
| chr2:178579585-178579735 | 568 | 0.02 |
| chr2:178432945-178433095 | 1755 | 0.016 |
External Databases
UCSCEnsembl (ENSG00000197557)