Gene: TRIM13
chr13: 50570023-50586463Expression Profile
(log scale)
Graphical Connections
Distribution of linked clusters:
You may find it interesting if many of the connected DHS sites belong to the same cluster.| Cluster Profile | Cluster ID | Number of DHS sites in this cluster |
|---|---|---|
 | 2110 | 2 |
 | 2114 | 2 |
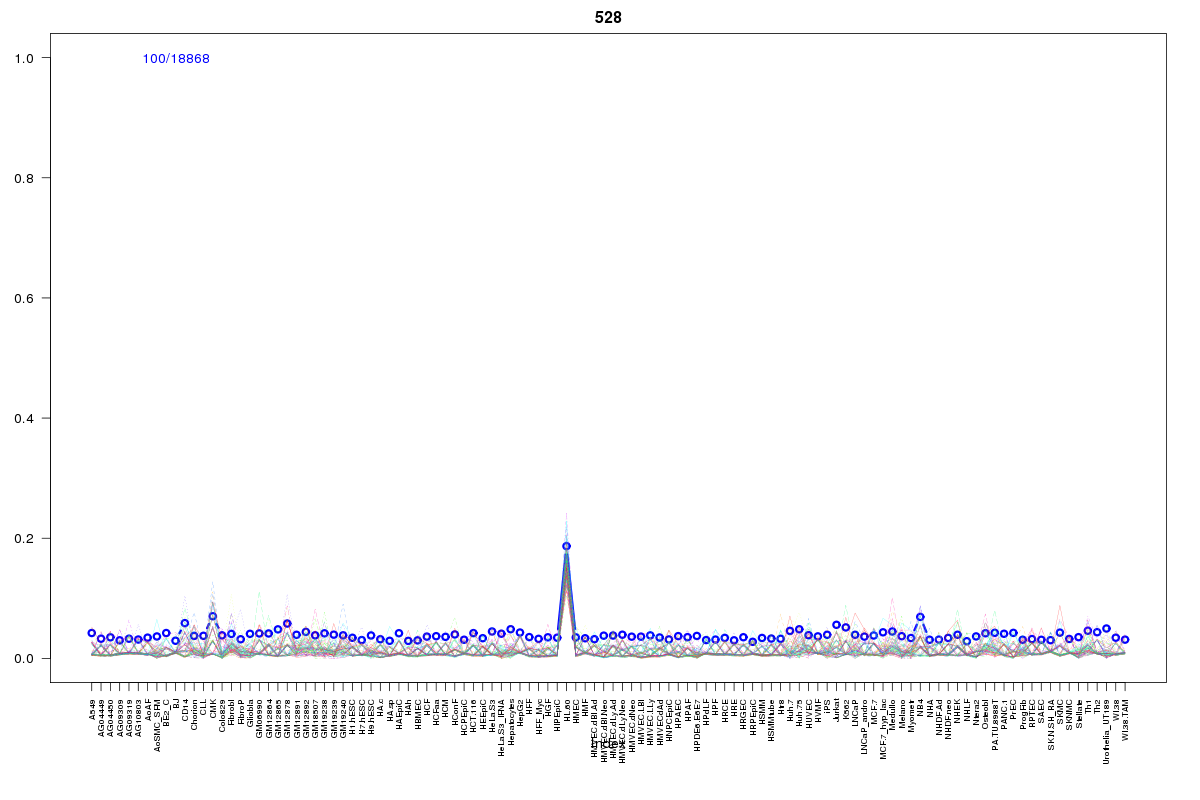 | 528 | 1 |
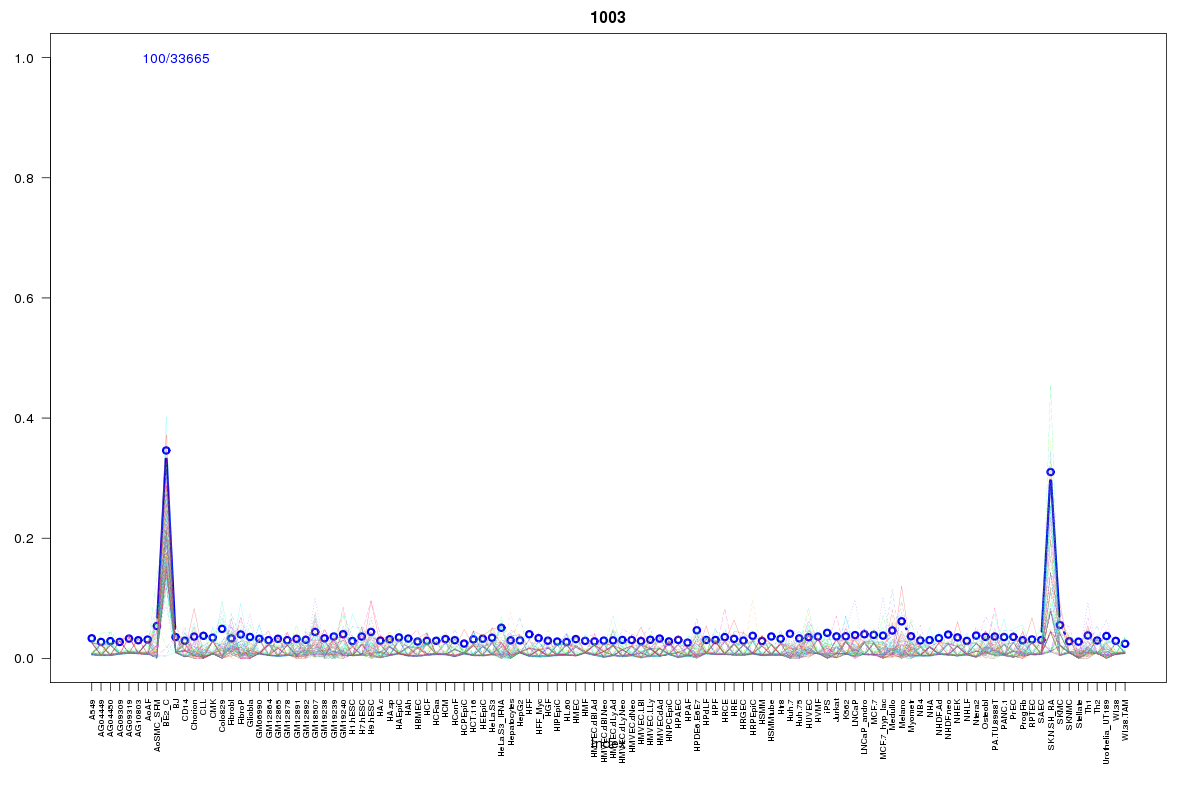 | 1003 | 1 |
 | 1355 | 1 |
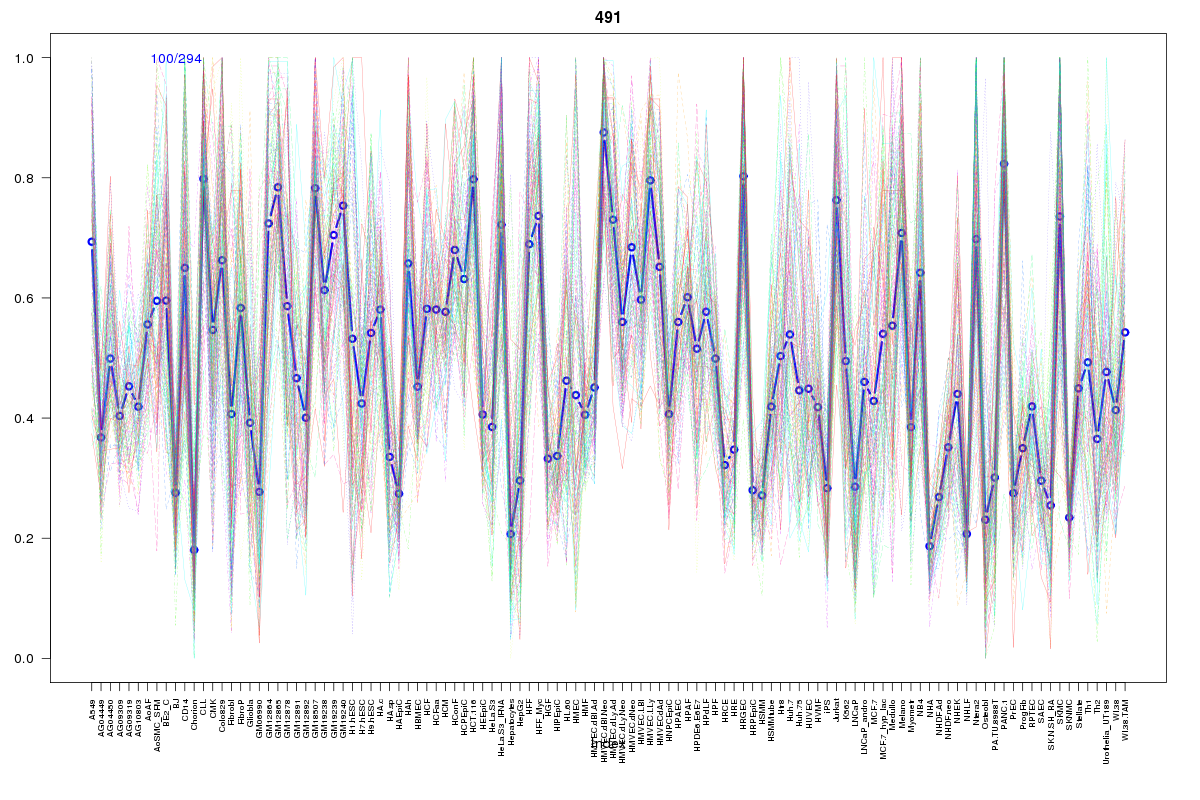 | 491 | 1 |
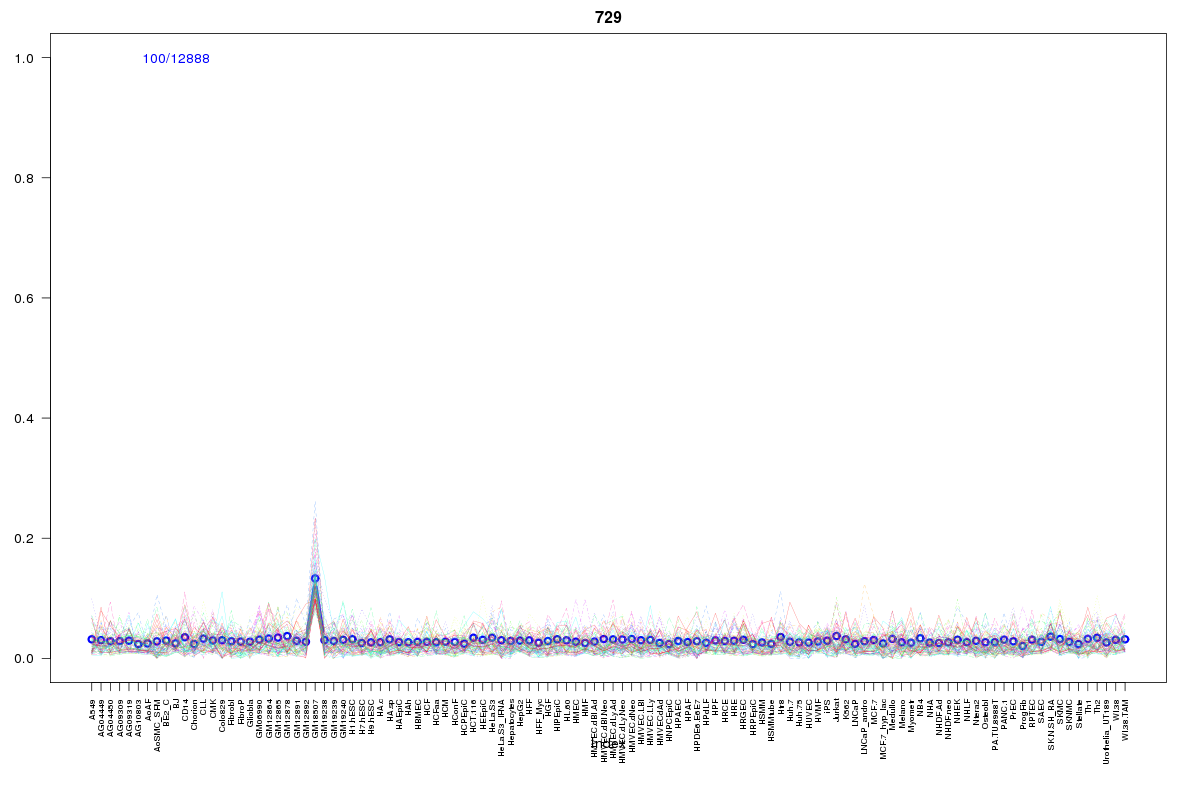 | 729 | 1 |
Resources
BED file downloads
Connects to 9 DHS sitesTop 10 Correlated DHS Sites
p-values indiciate significant higher or lower correlation| Location | Cluster | P-value |
|---|---|---|
| chr13:50550880-50551030 | 491 | 0.002 |
| chr13:50478980-50479130 | 2114 | 0.006 |
| chr13:50612885-50613035 | 2110 | 0.006 |
| chr13:50627480-50627630 | 528 | 0.007 |
| chr13:50645620-50645770 | 2114 | 0.011 |
| chr13:50488500-50488650 | 1003 | 0.012 |
| chr13:50610300-50610450 | 2110 | 0.014 |
| chr13:50552025-50552175 | 729 | 0.016 |
| chr13:50513205-50513355 | 1355 | 0.004 |
External Databases
UCSCEnsembl (ENSG00000204977)