Gene: CTD-2090I13.2
chr1: 227598317-227599020Expression Profile
(log scale)
Graphical Connections
Distribution of linked clusters:
You may find it interesting if many of the connected DHS sites belong to the same cluster.| Cluster Profile | Cluster ID | Number of DHS sites in this cluster |
|---|---|---|
 | 2186 | 3 |
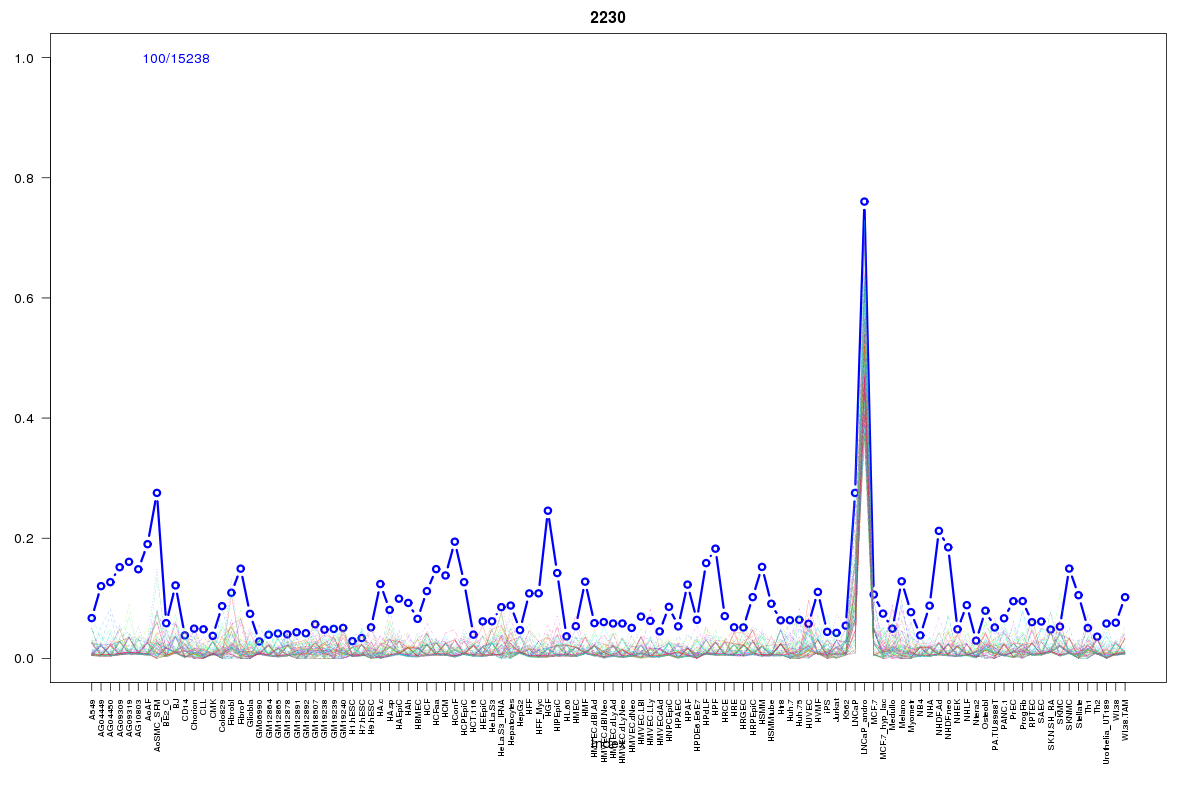 | 2230 | 2 |
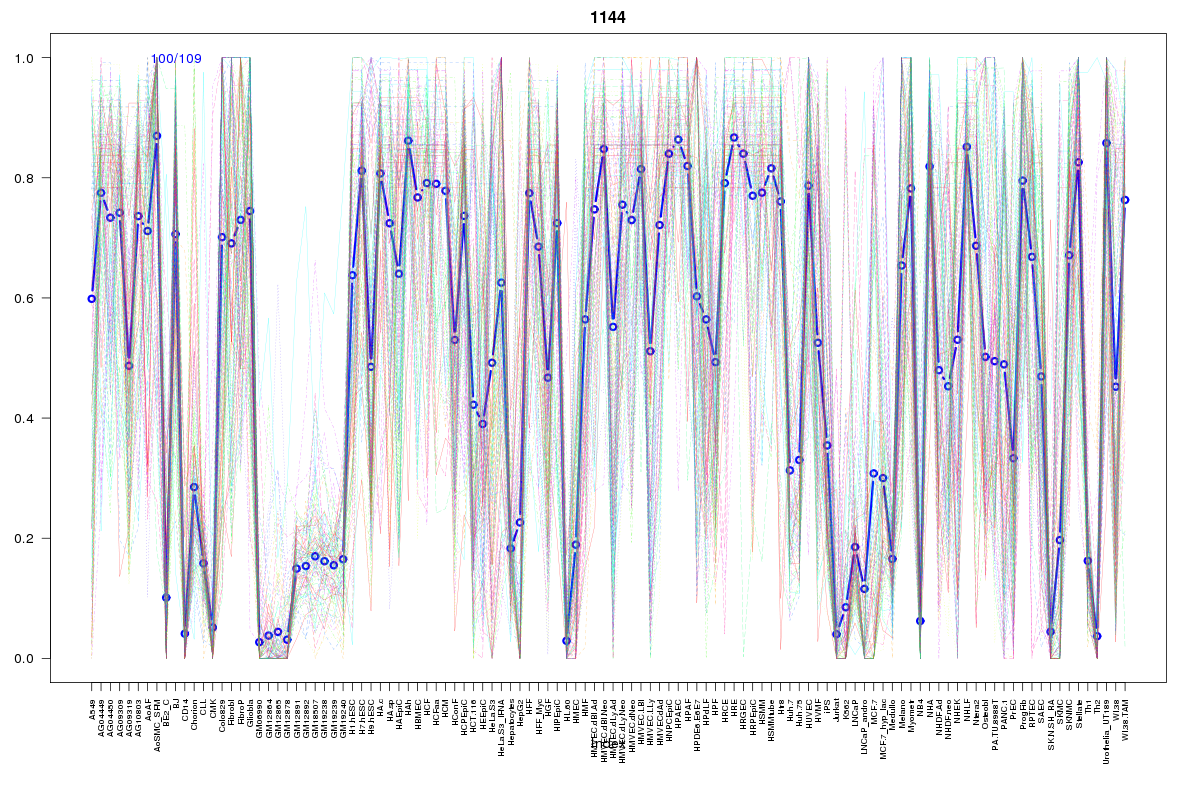 | 1144 | 1 |
 | 934 | 1 |
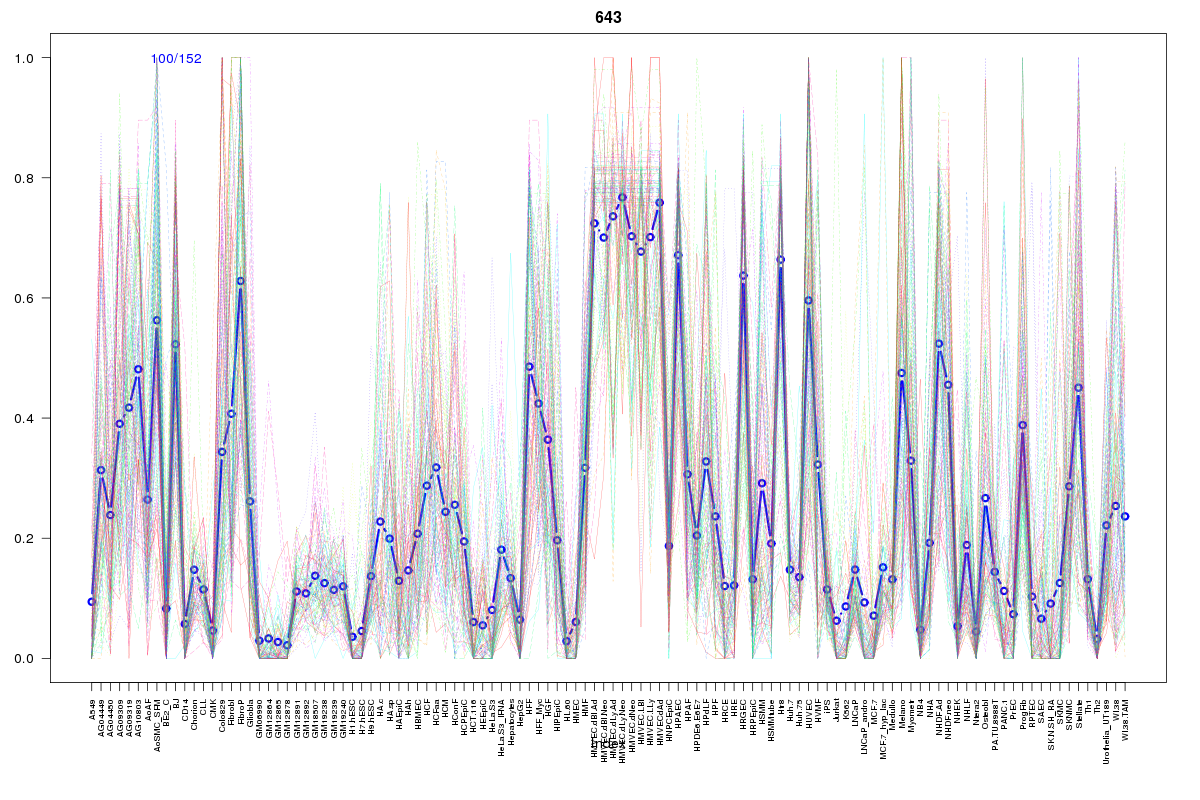 | 643 | 1 |
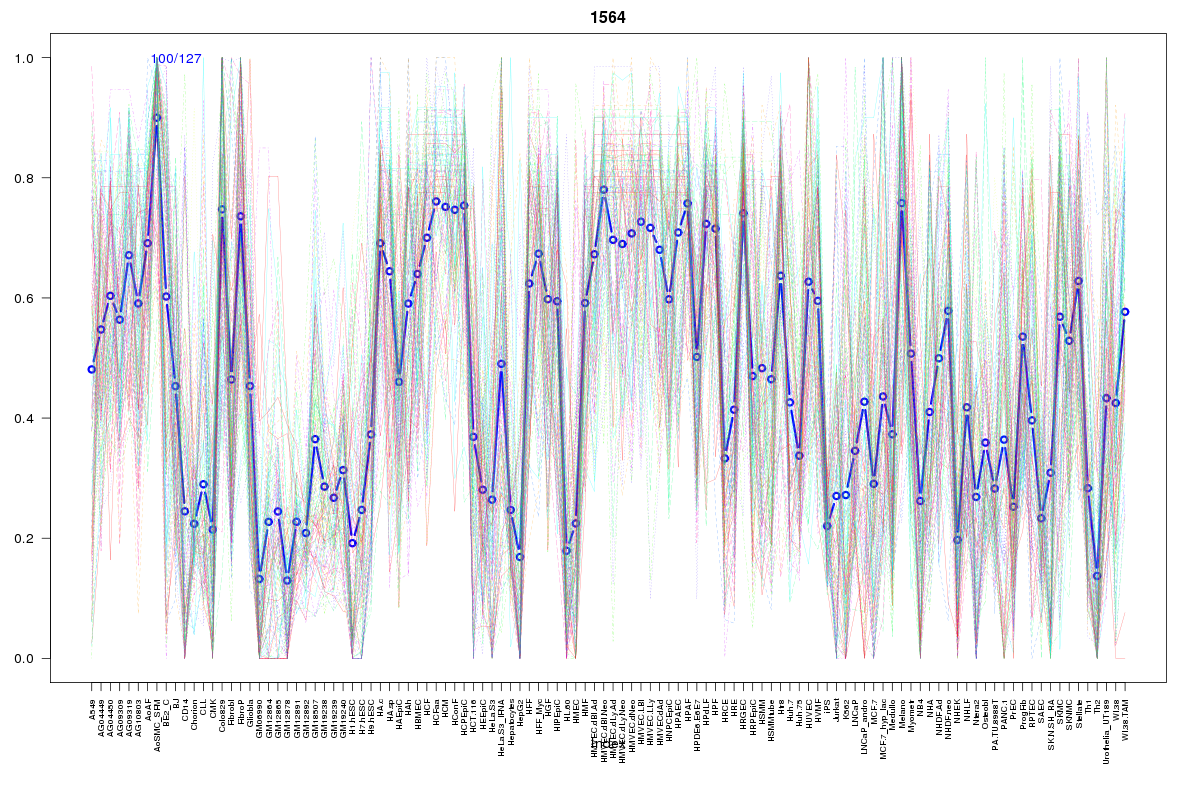 | 1564 | 1 |
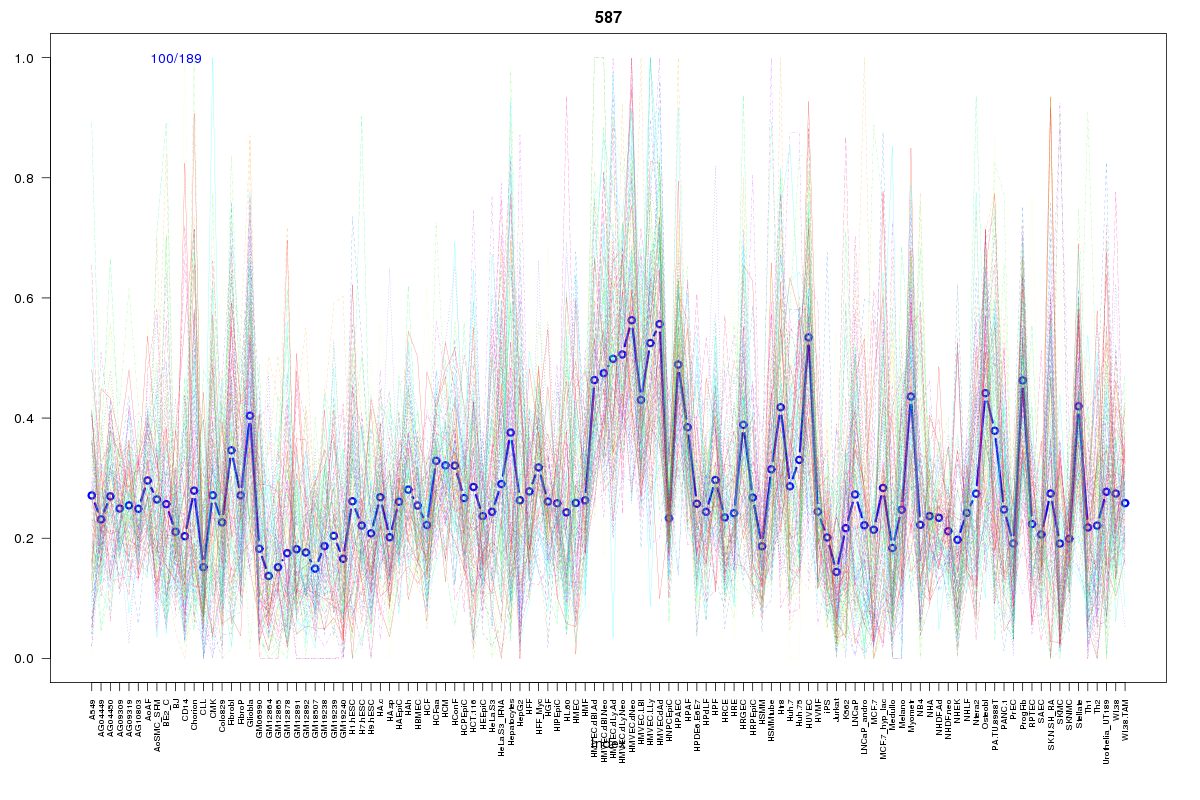 | 587 | 1 |
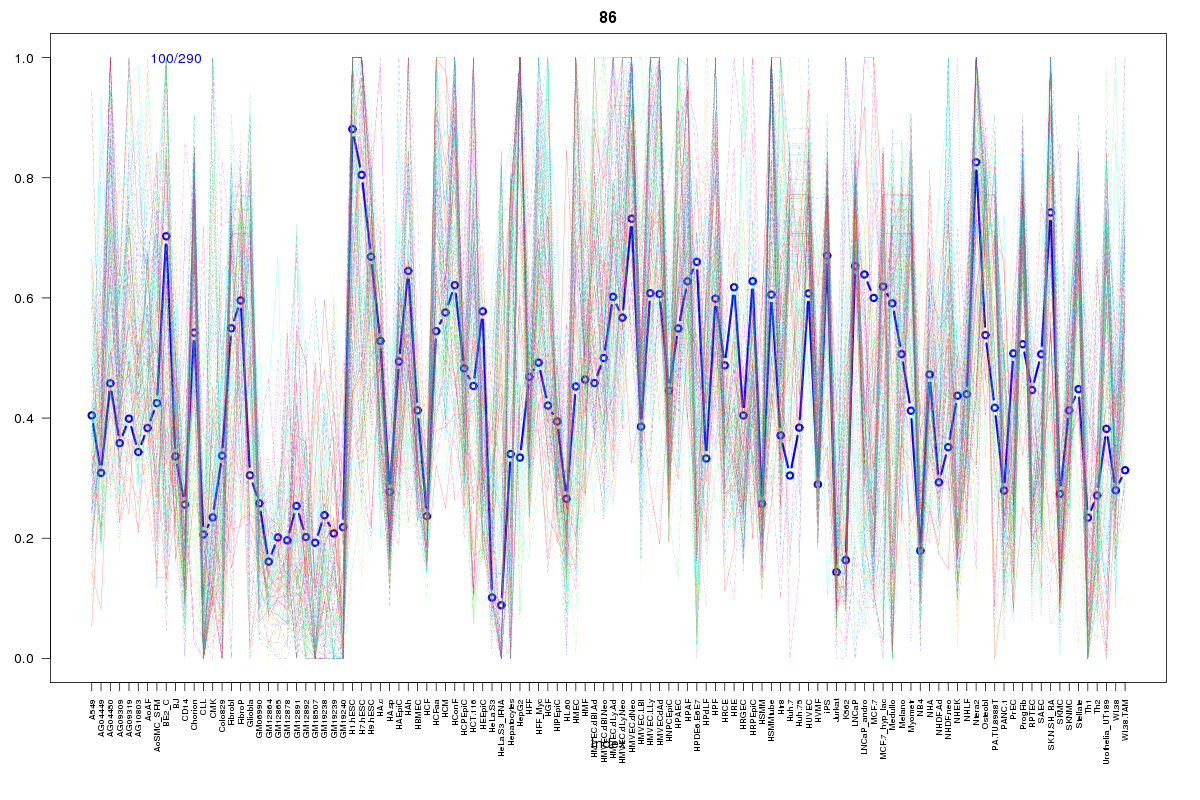 | 86 | 1 |
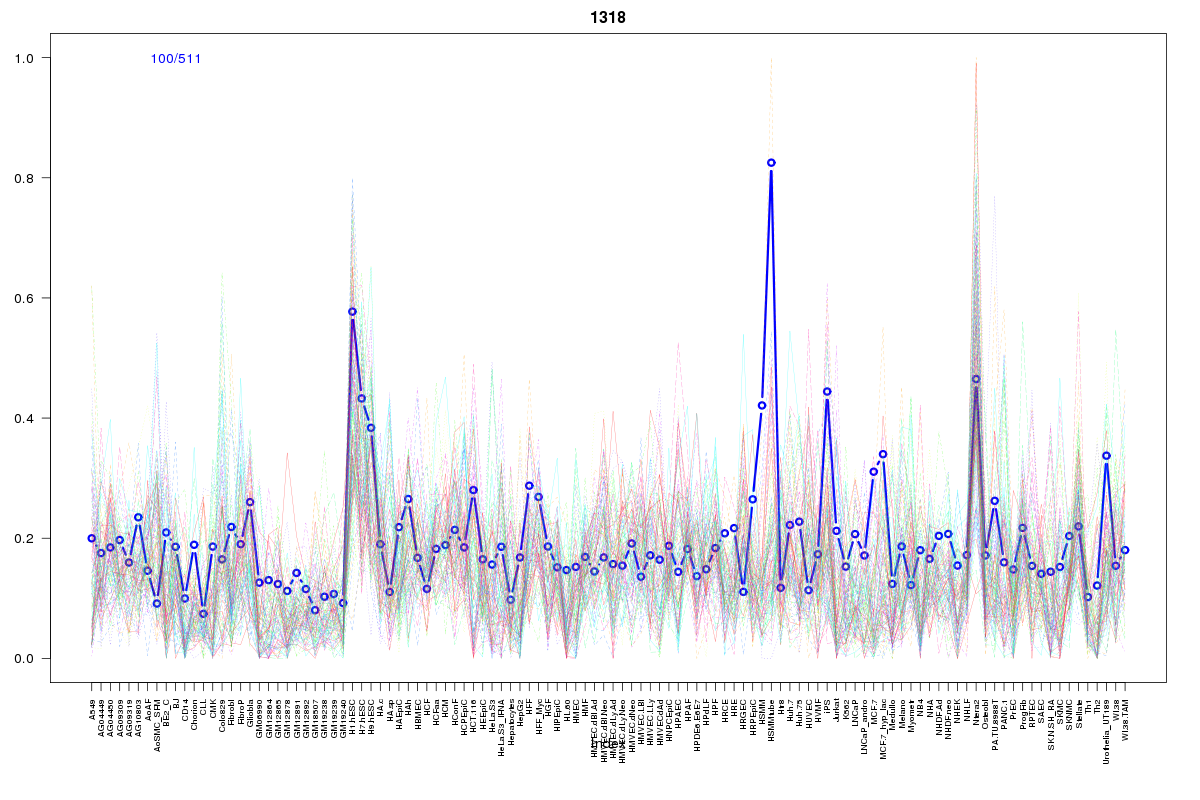 | 1318 | 1 |
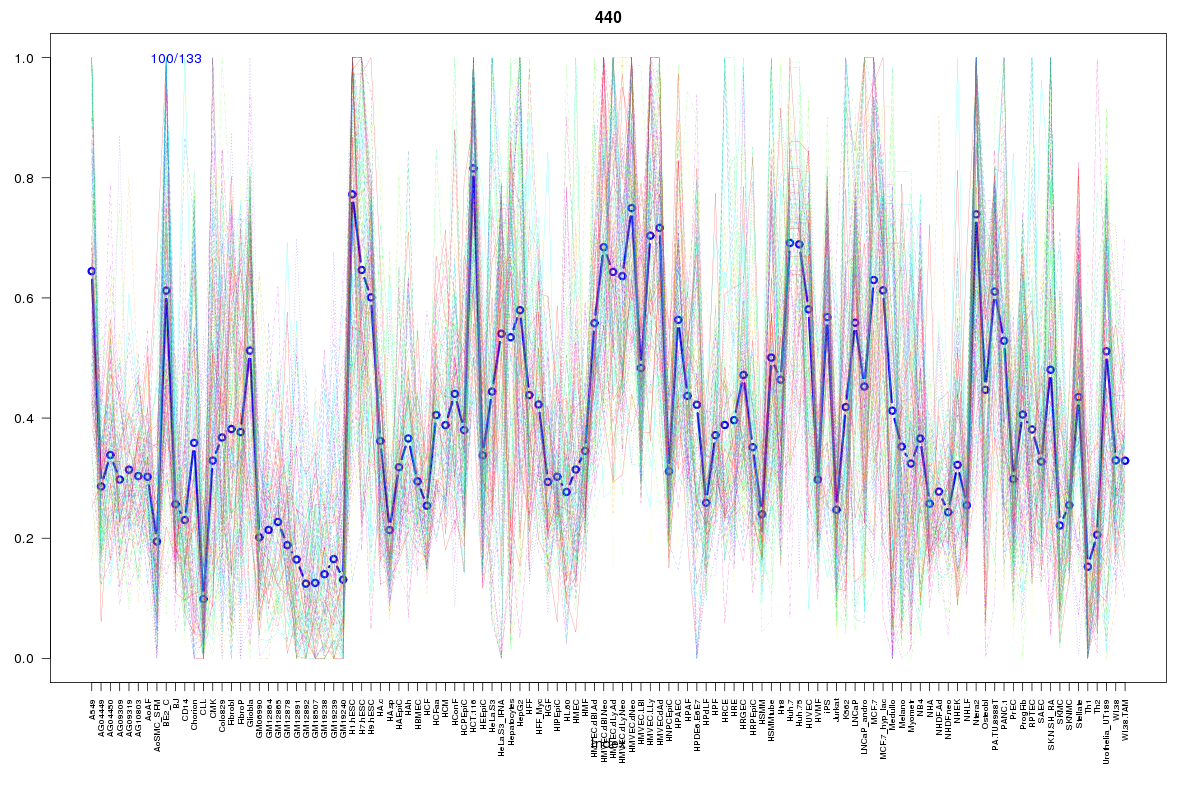 | 440 | 1 |
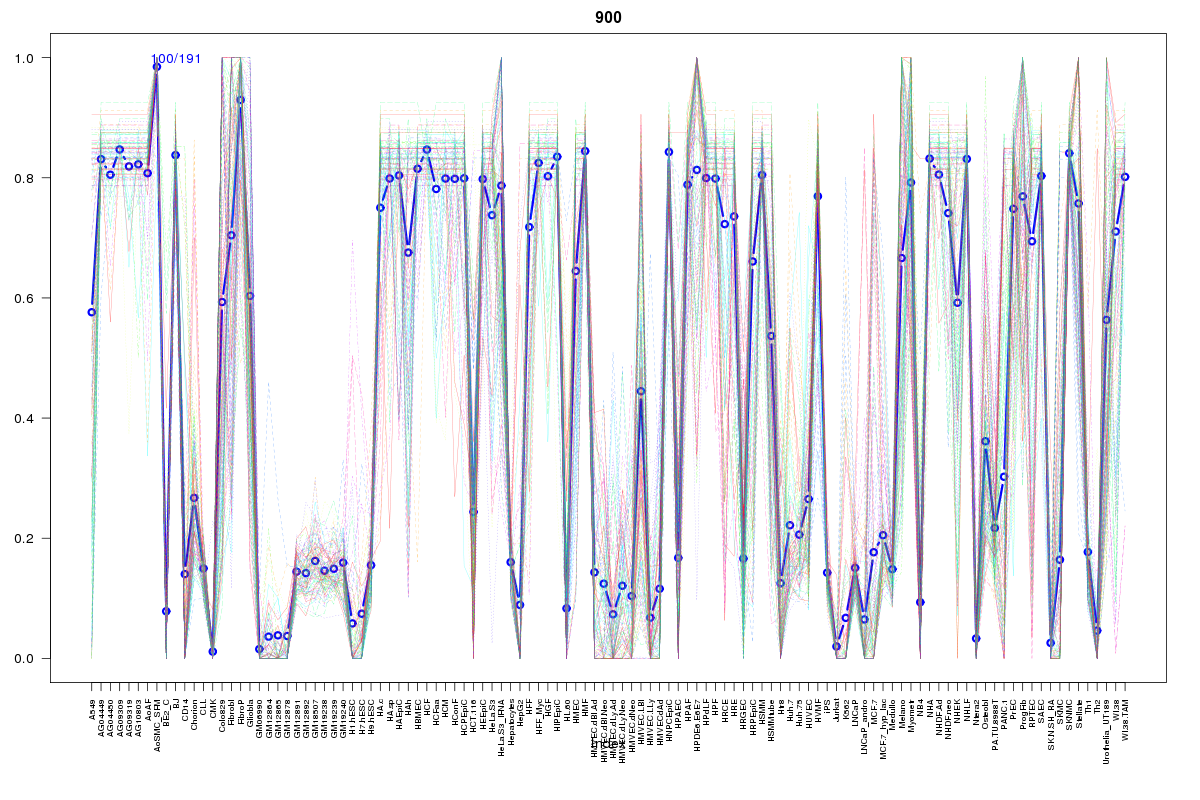 | 900 | 1 |
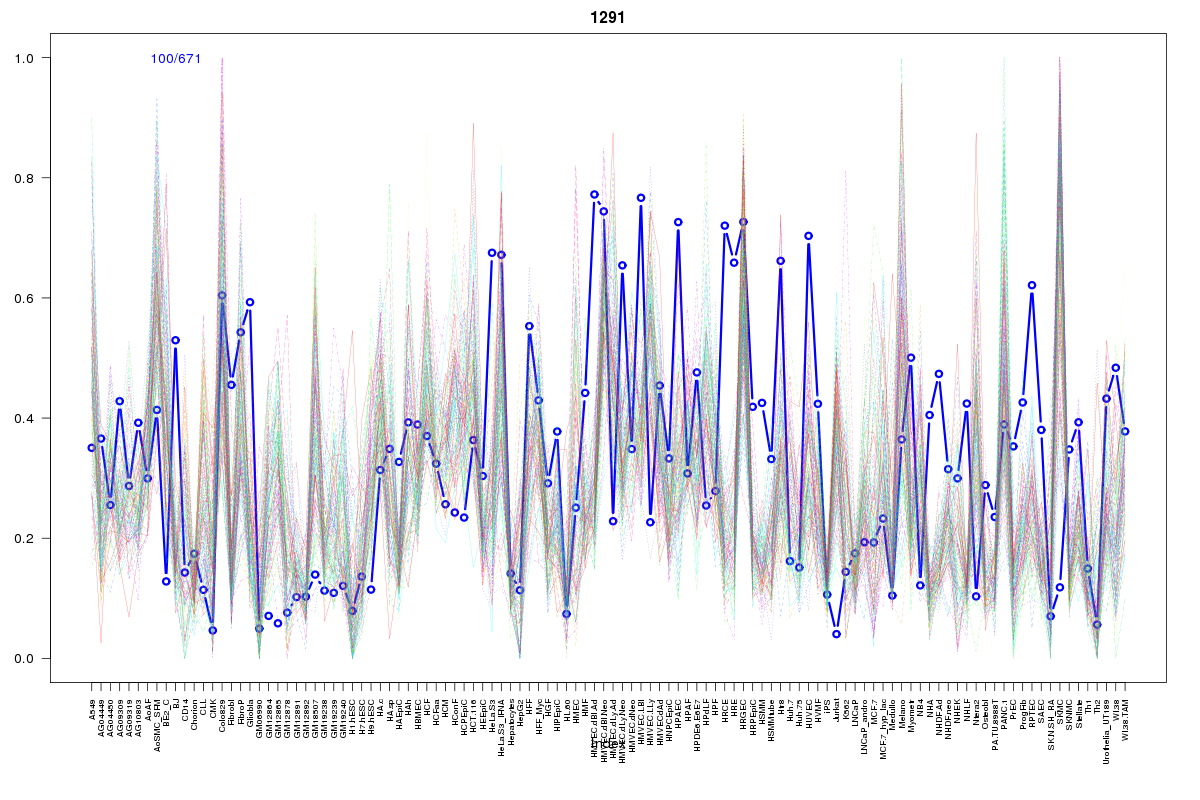 | 1291 | 1 |
Resources
BED file downloads
Connects to 15 DHS sitesTop 10 Correlated DHS Sites
p-values indiciate significant higher or lower correlation| Location | Cluster | P-value |
|---|---|---|
| chr1:227594160-227594310 | 2230 | 0 |
| chr1:227573060-227573210 | 2230 | 0.01 |
| chr1:227618760-227618910 | 2186 | 0.013 |
| chr1:227660660-227660810 | 2186 | 0.015 |
| chr1:227587260-227587410 | 934 | 0.017 |
| chr1:227585400-227585550 | 2186 | 0.018 |
| chr1:227617460-227617610 | 643 | 0.017 |
| chr1:227506765-227506915 | 1318 | 0.017 |
| chr1:227531820-227531970 | 900 | 0.017 |
| chr1:227506200-227506350 | 86 | 0.016 |
| chr1:227505260-227505410 | 587 | 0.015 |
External Databases
UCSCEnsembl (ENSG00000232864)