Gene: CTD-2501O3.2
chr3: 154369444-154370212Expression Profile
(log scale)
Graphical Connections
Distribution of linked clusters:
You may find it interesting if many of the connected DHS sites belong to the same cluster.| Cluster Profile | Cluster ID | Number of DHS sites in this cluster |
|---|---|---|
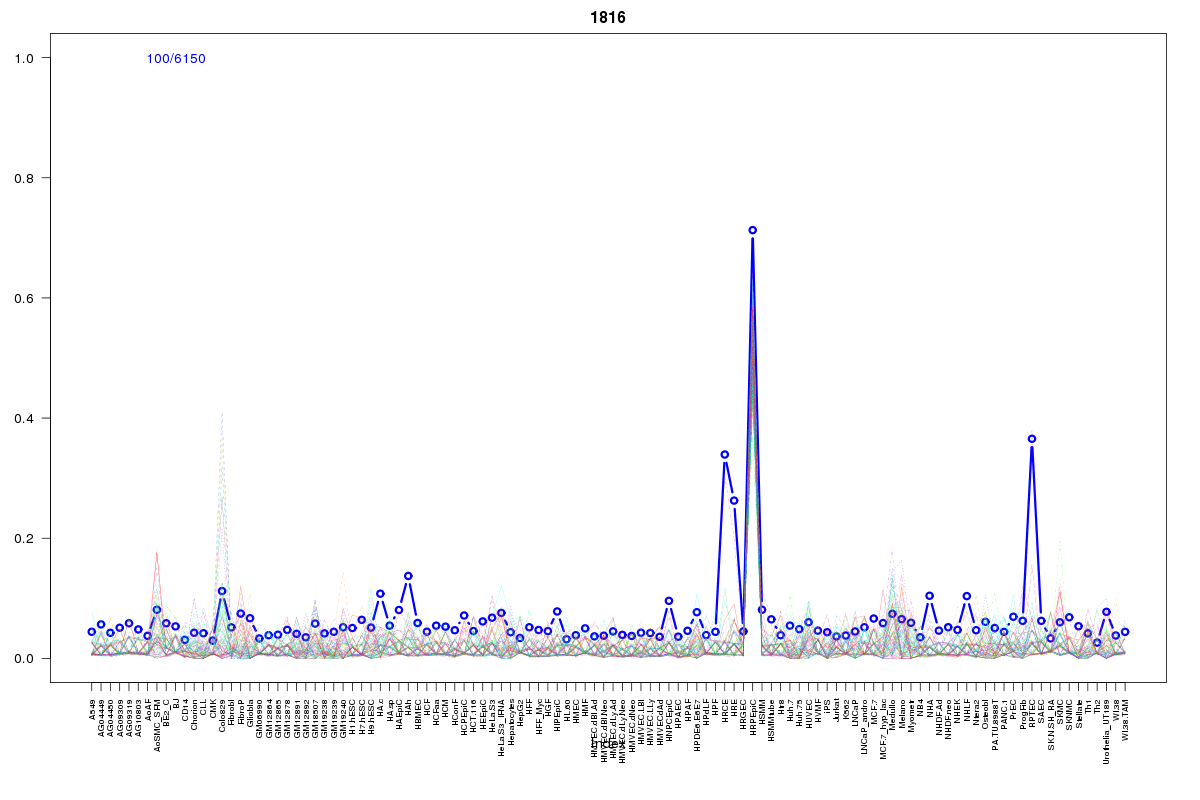 | 1816 | 4 |
 | 1820 | 2 |
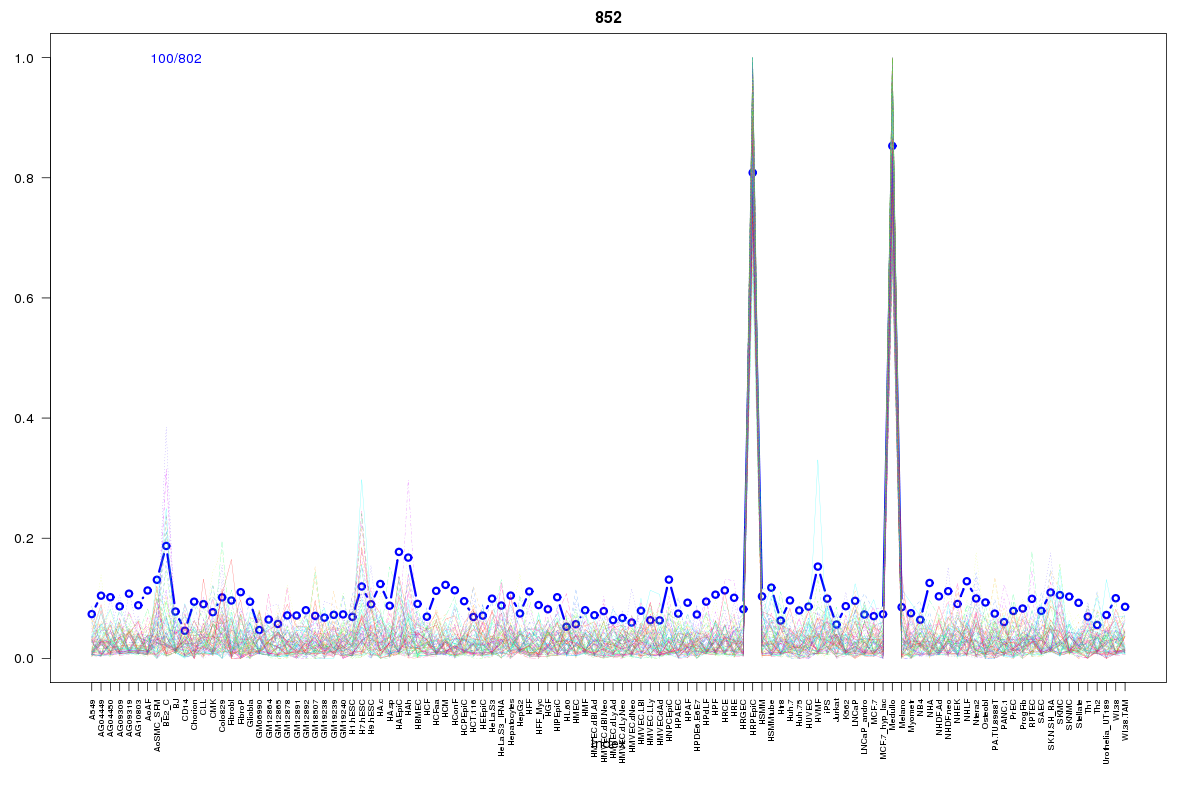 | 852 | 1 |
Resources
BED file downloads
Connects to 7 DHS sitesTop 10 Correlated DHS Sites
p-values indiciate significant higher or lower correlation| Location | Cluster | P-value |
|---|---|---|
| chr3:154296100-154296250 | 1820 | 0.003 |
| chr3:154318040-154318190 | 1816 | 0.004 |
| chr3:154359460-154359610 | 1820 | 0.006 |
| chr3:154386380-154386530 | 1816 | 0.008 |
| chr3:154316060-154316210 | 852 | 0.009 |
| chr3:154448180-154448330 | 1816 | 0.009 |
| chr3:154289740-154289890 | 1816 | 0.022 |
External Databases
UCSCEnsembl (ENSG00000243154)