Gene: TPM3P6
chr19: 53982603-53983345Expression Profile
(log scale)
Graphical Connections
Distribution of linked clusters:
You may find it interesting if many of the connected DHS sites belong to the same cluster.| Cluster Profile | Cluster ID | Number of DHS sites in this cluster |
|---|---|---|
 | 510 | 1 |
 | 1605 | 1 |
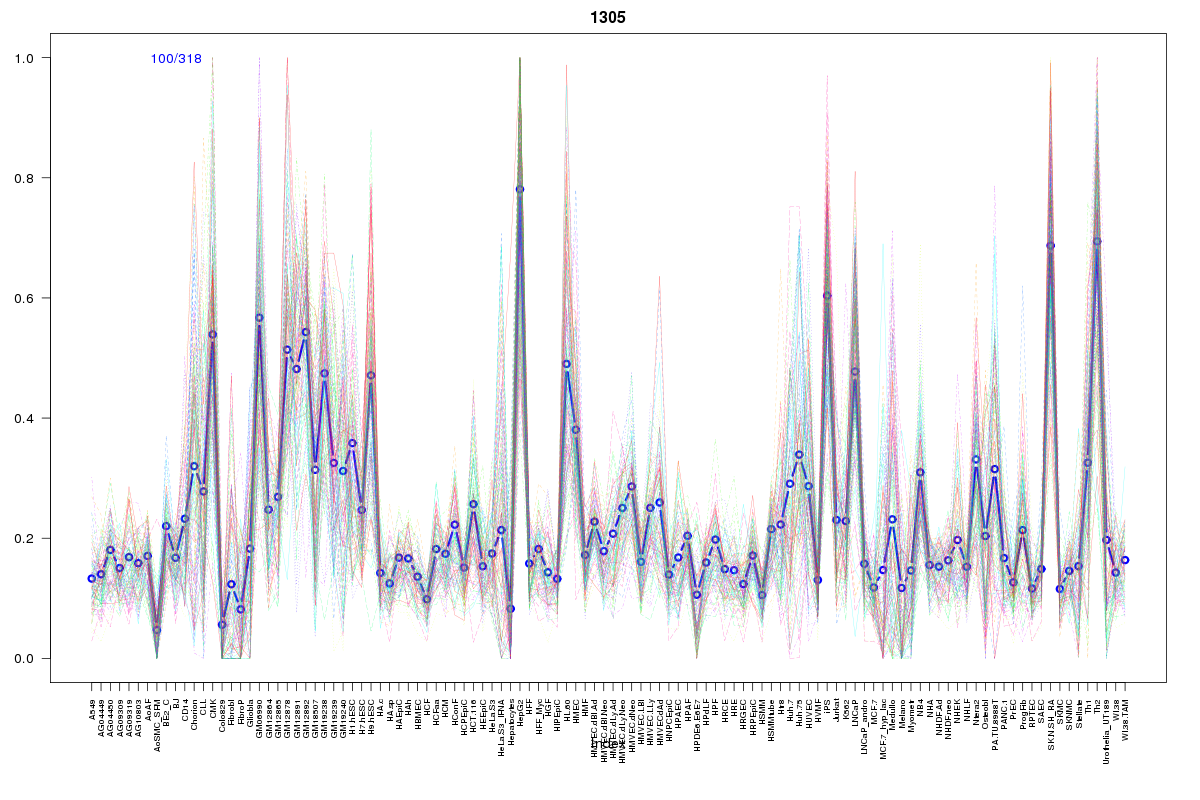 | 1305 | 1 |
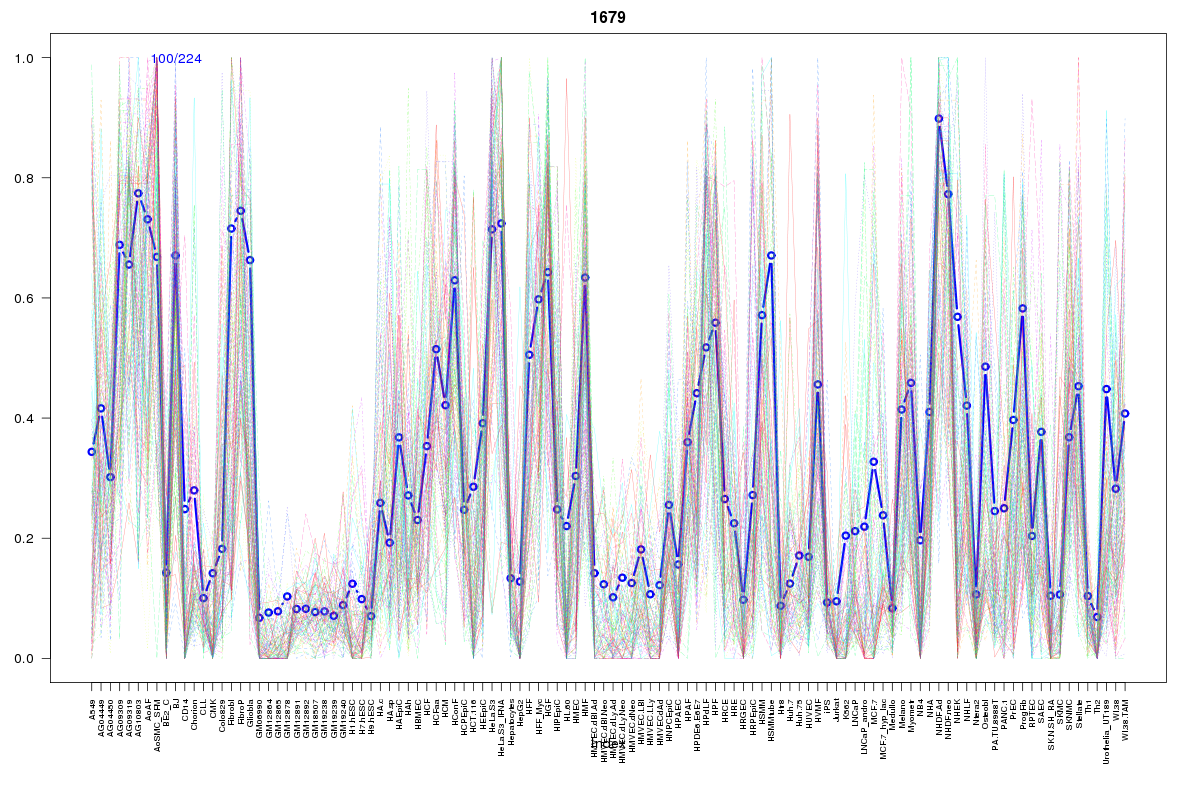 | 1679 | 1 |
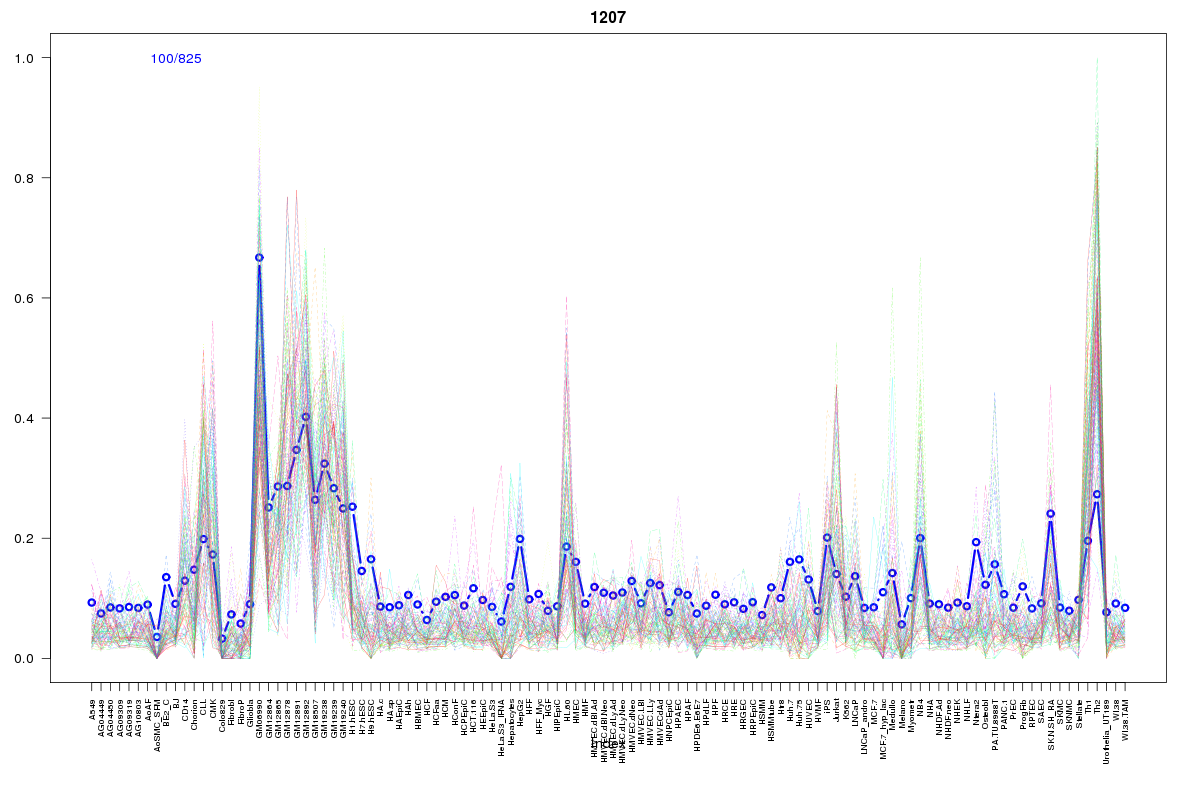 | 1207 | 1 |
Resources
BED file downloads
Connects to 5 DHS sitesTop 10 Correlated DHS Sites
p-values indiciate significant higher or lower correlation| Location | Cluster | P-value |
|---|---|---|
| chr19:54040760-54040910 | 1305 | 0.002 |
| chr19:53918045-53918195 | 510 | 0.004 |
| chr19:54057180-54057330 | 1207 | 0.004 |
| chr19:54000285-54000435 | 1605 | 0.01 |
| chr19:54048540-54048690 | 1679 | 0.008 |
External Databases
UCSCEnsembl (ENSG00000250731)