Gene: PPT1
chr1: 40538378-40563375Expression Profile
(log scale)
Graphical Connections
Distribution of linked clusters:
You may find it interesting if many of the connected DHS sites belong to the same cluster.| Cluster Profile | Cluster ID | Number of DHS sites in this cluster |
|---|---|---|
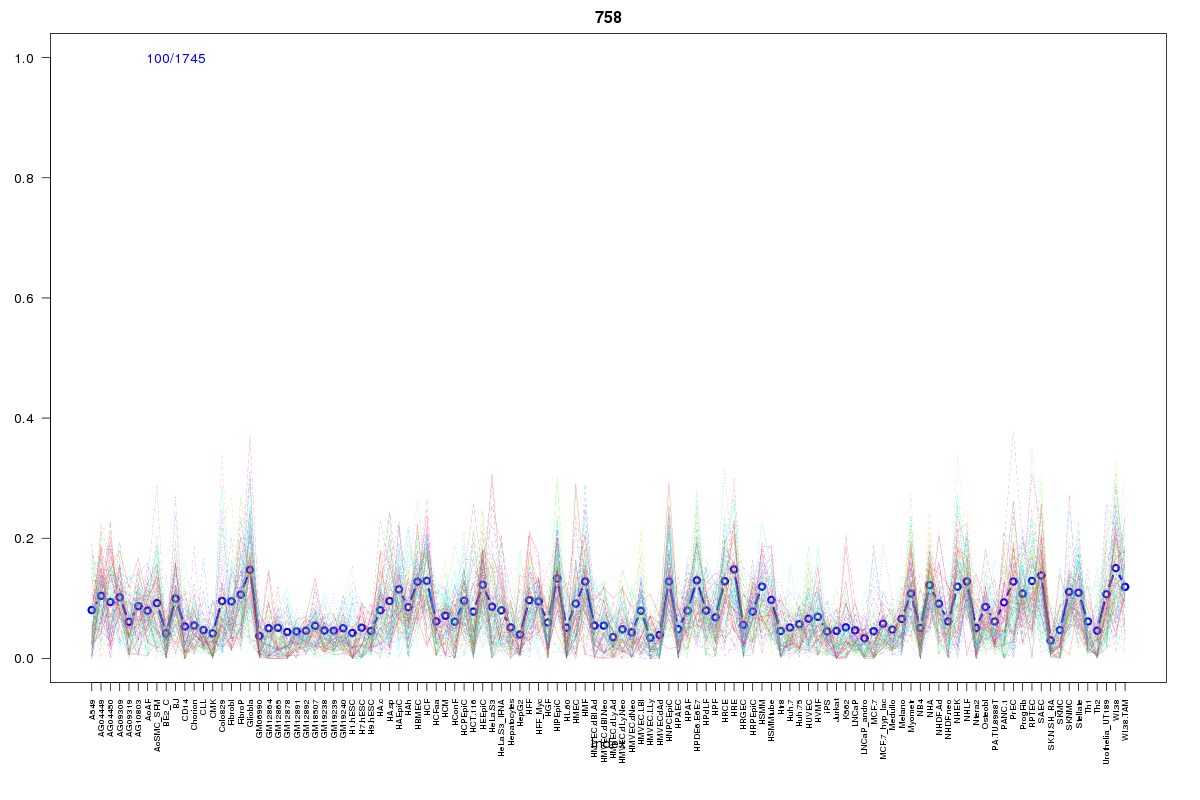 | 758 | 1 |
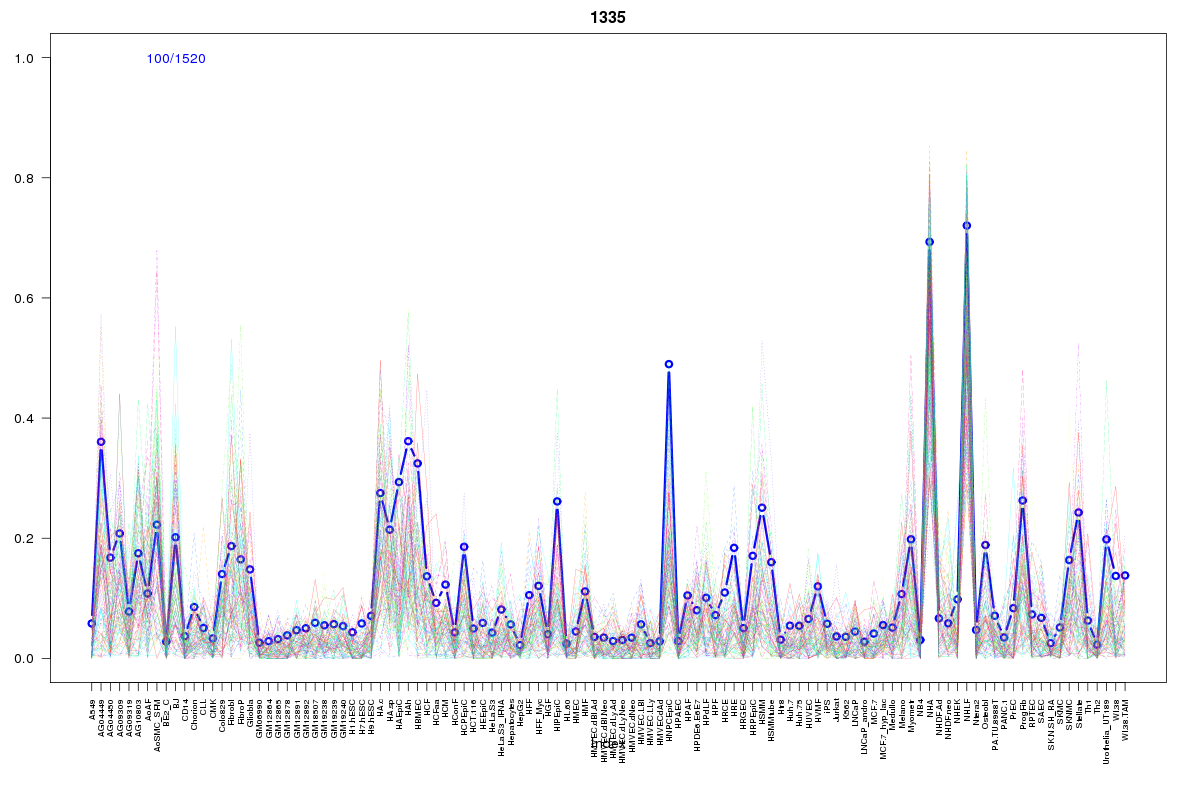 | 1335 | 1 |
 | 1605 | 1 |
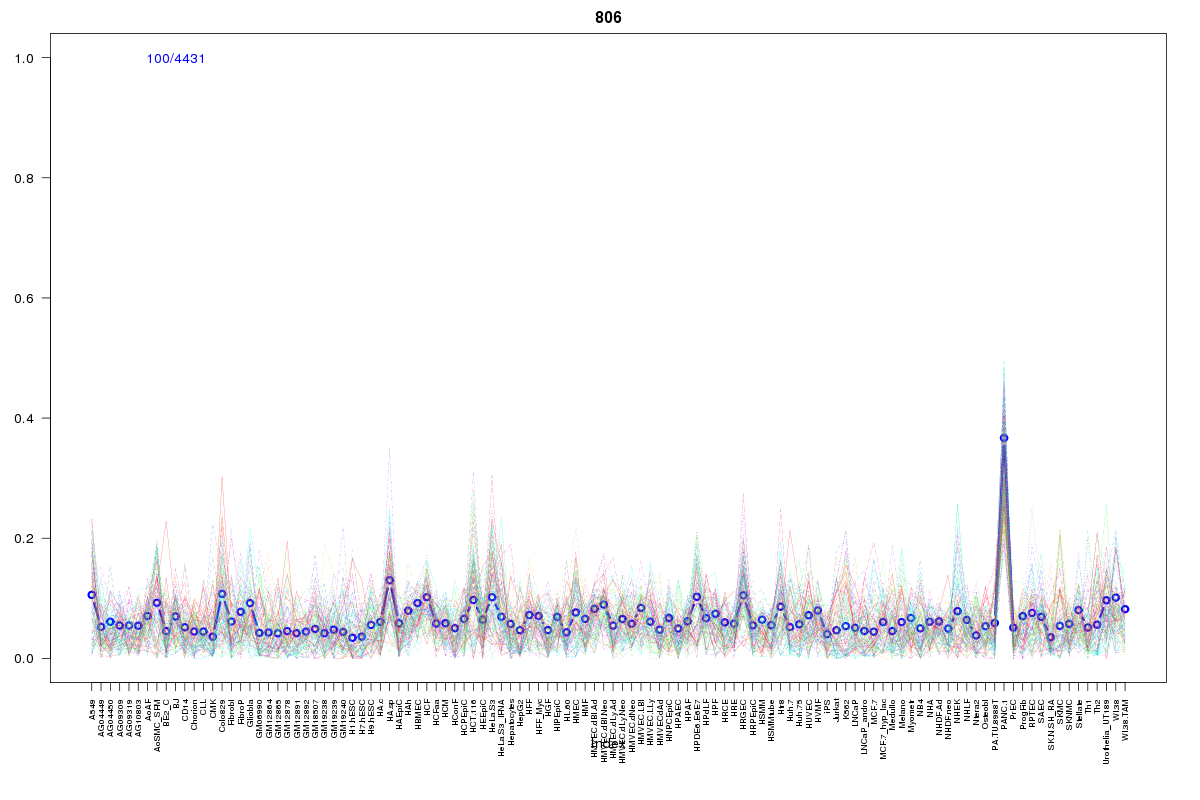 | 806 | 1 |
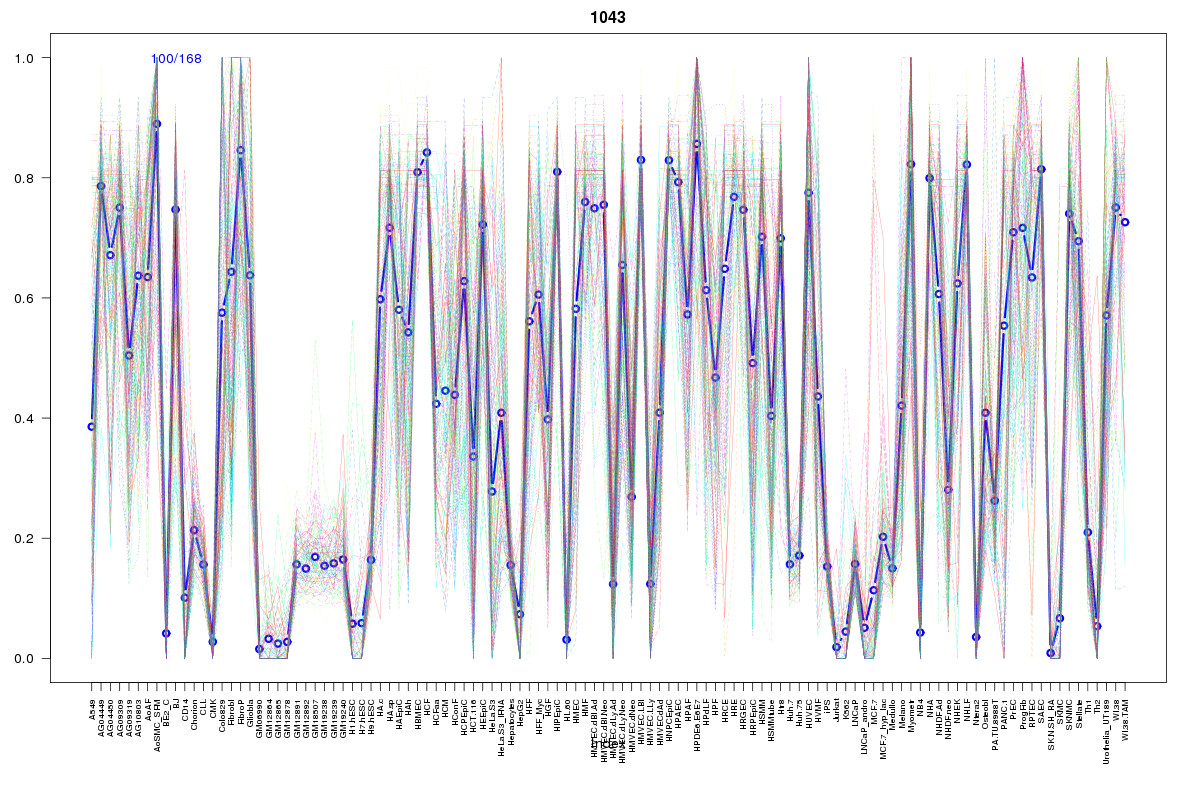 | 1043 | 1 |
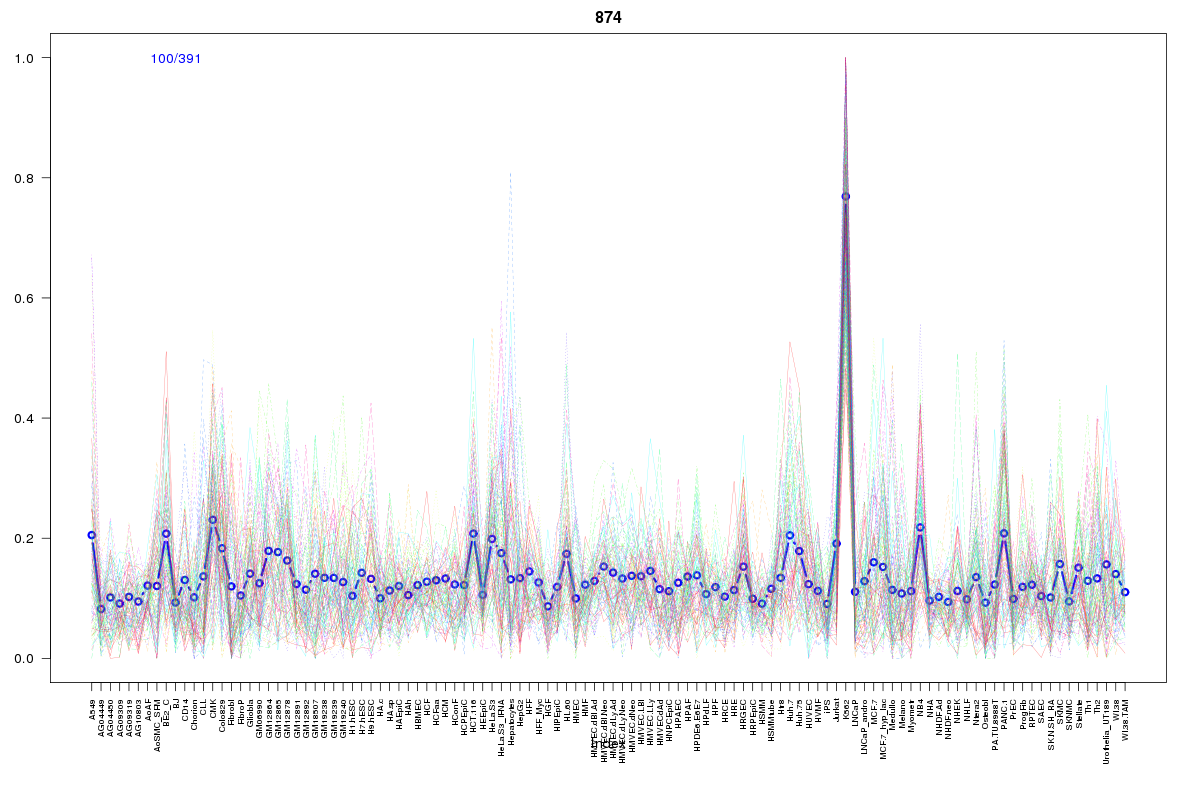 | 874 | 1 |
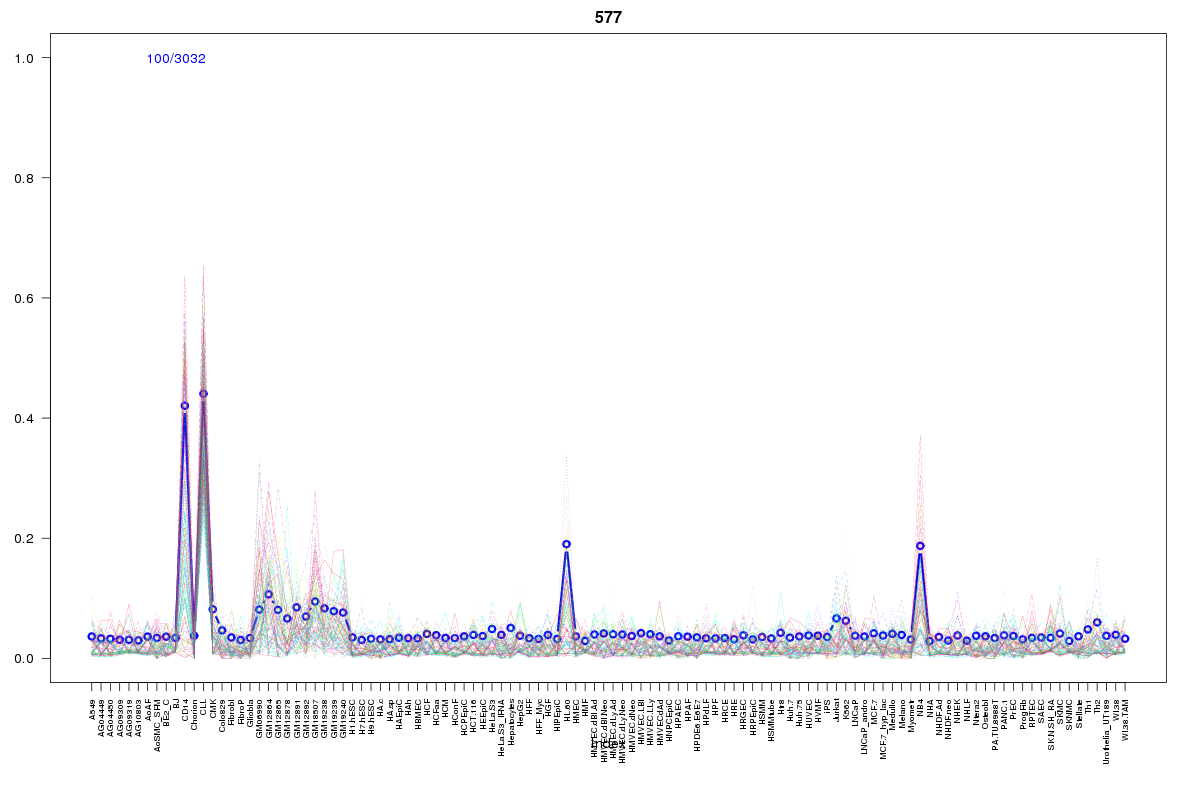 | 577 | 1 |
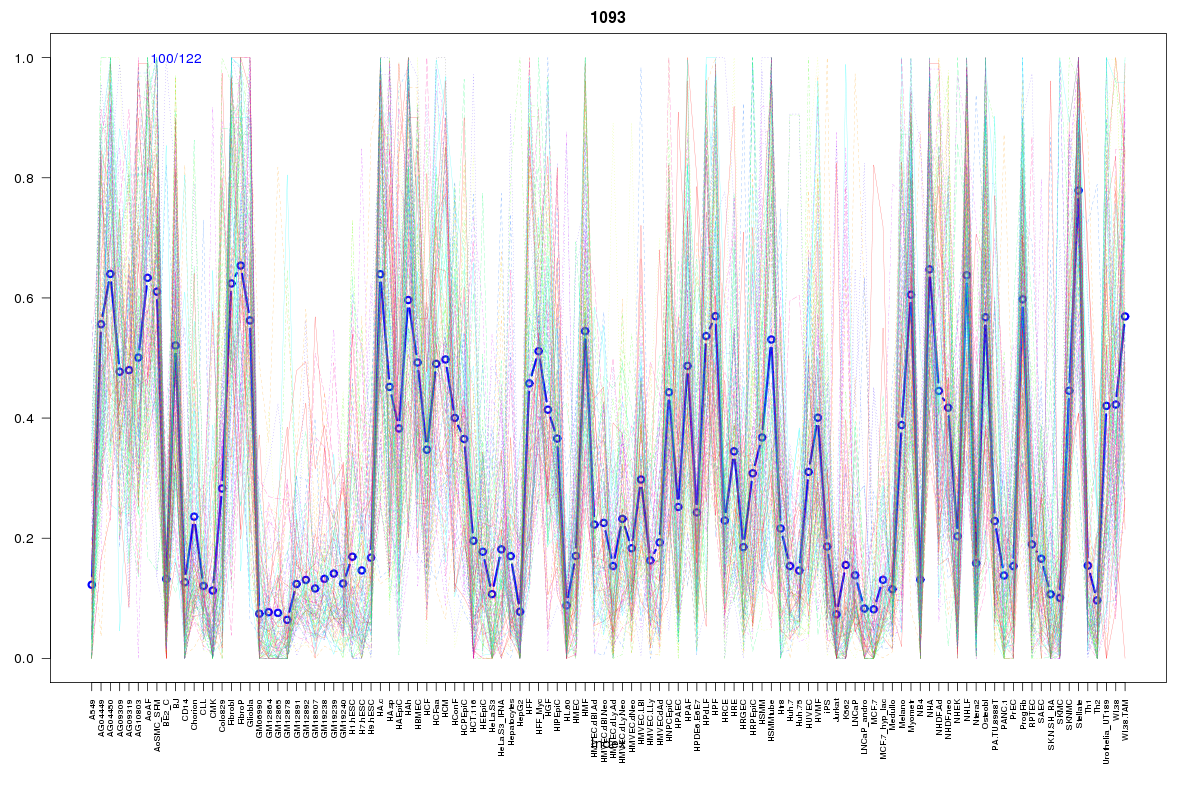 | 1093 | 1 |
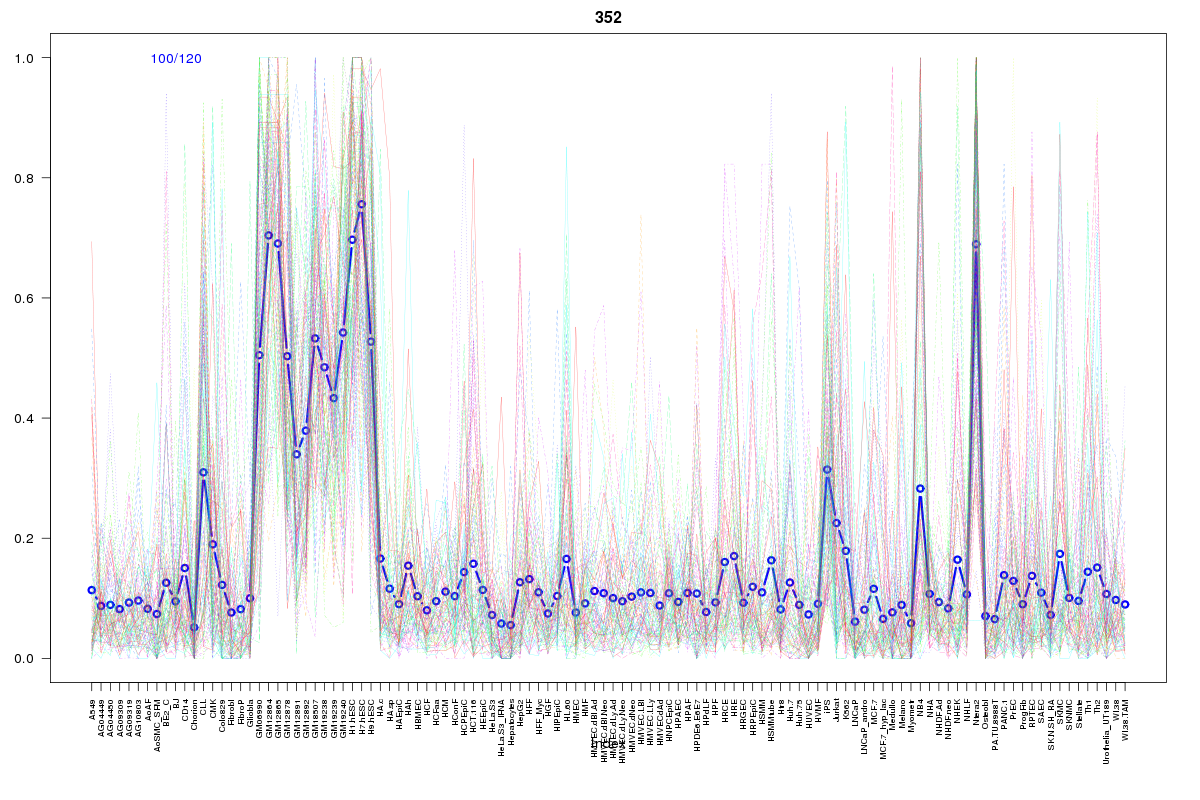 | 352 | 1 |
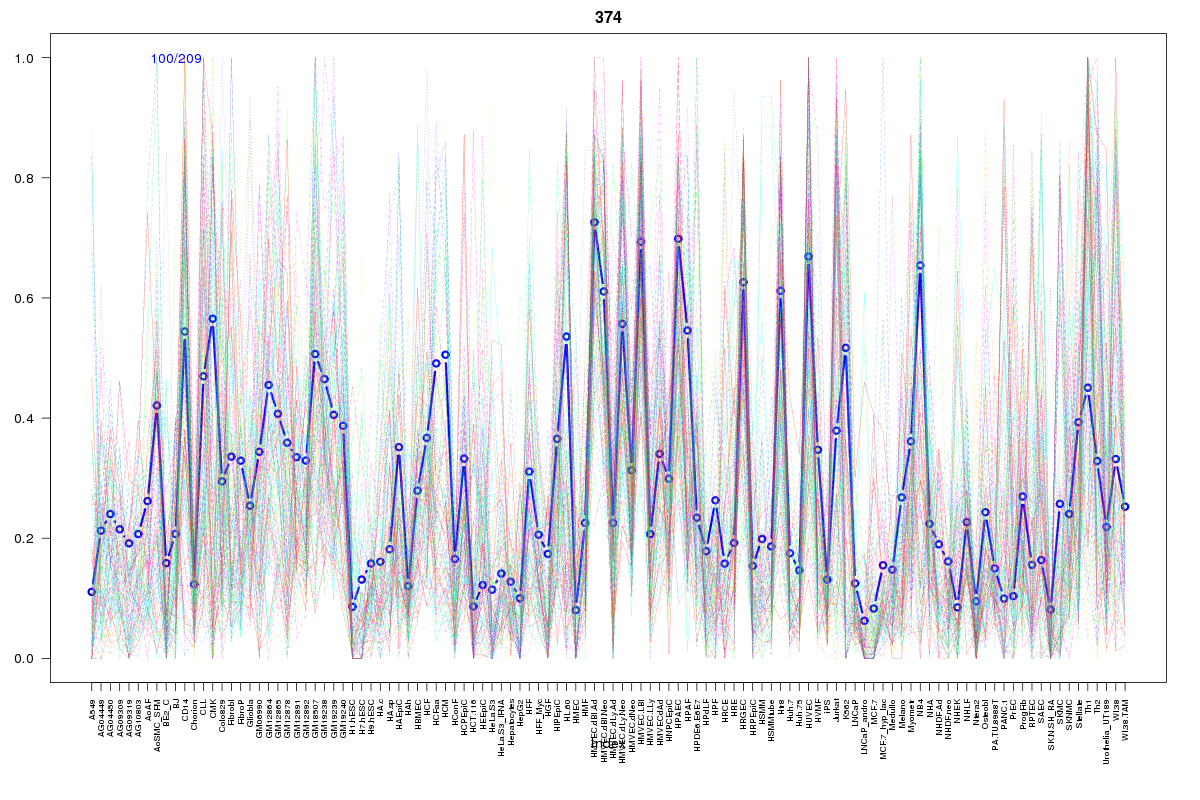 | 374 | 1 |
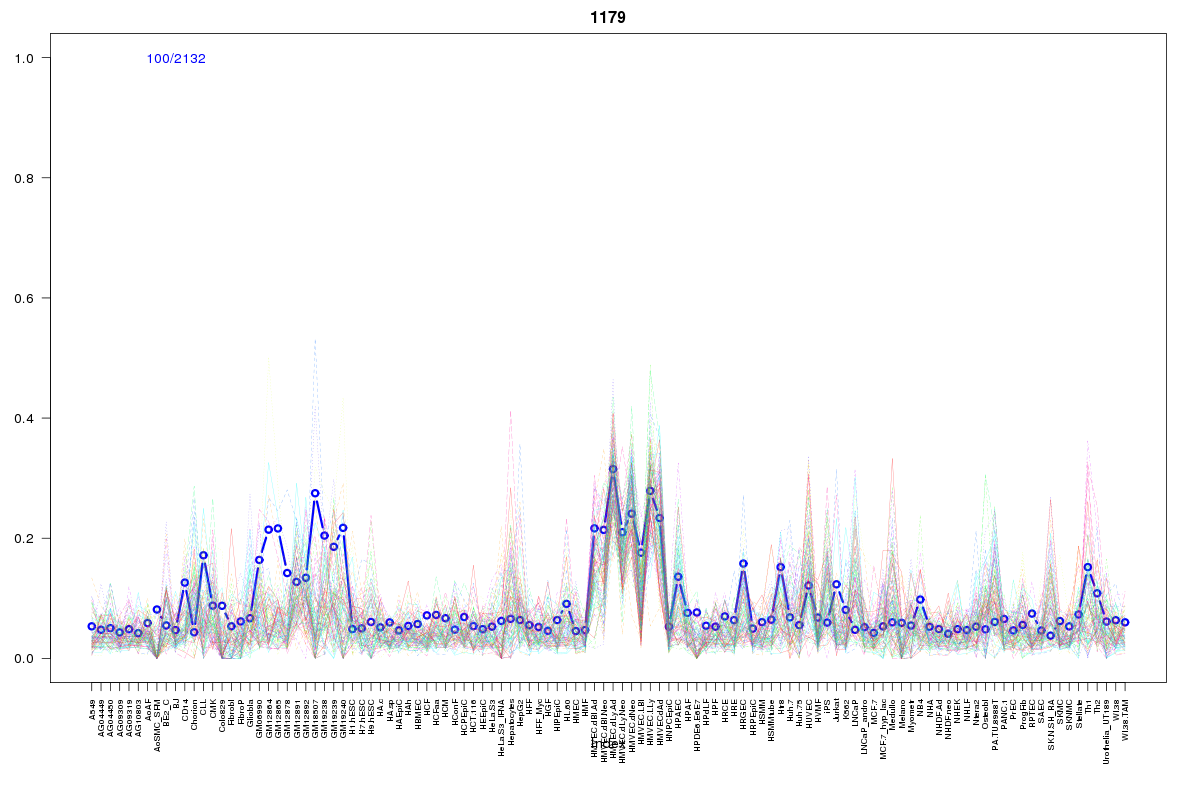 | 1179 | 1 |
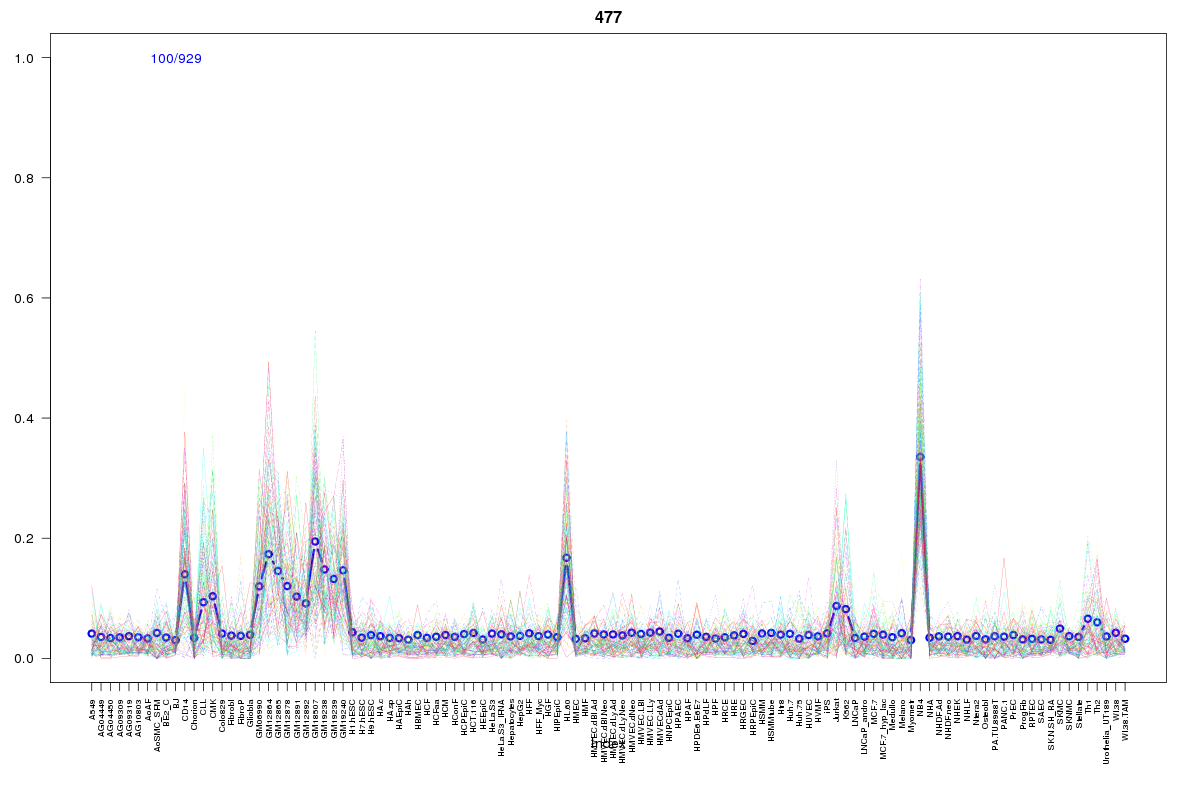 | 477 | 1 |
 | 10 | 1 |
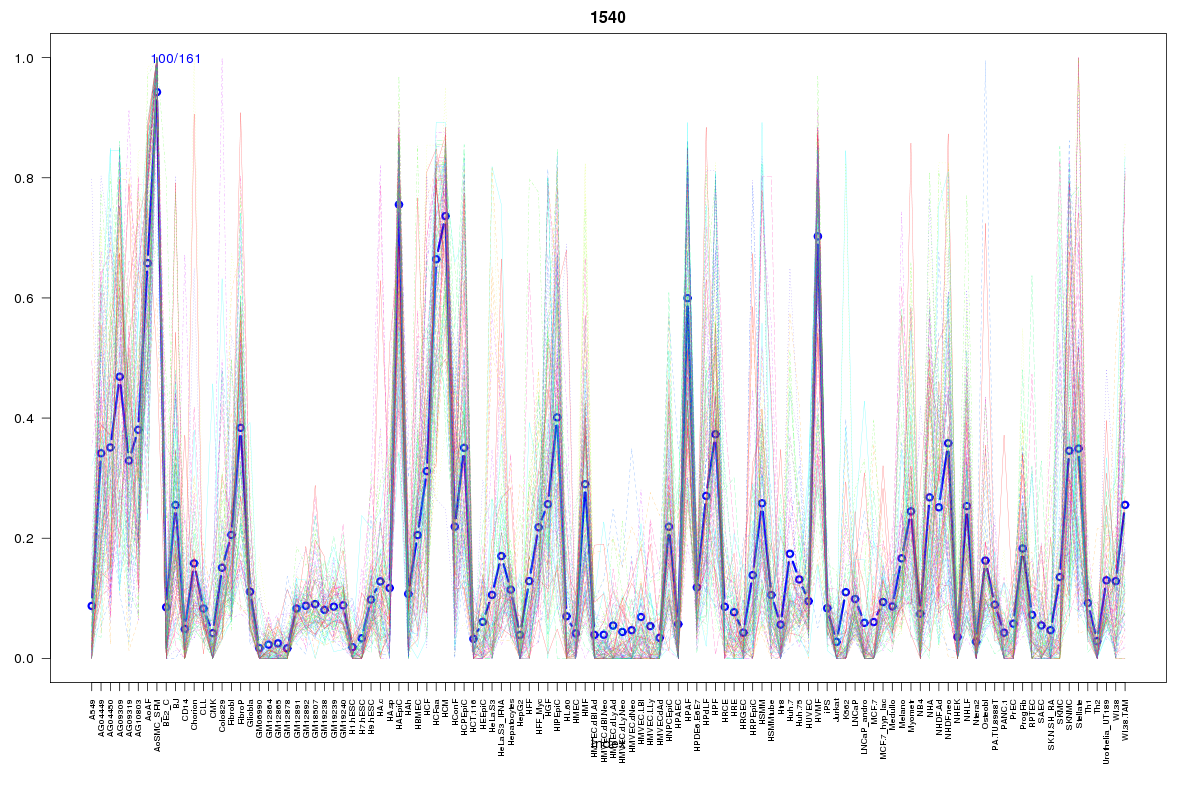 | 1540 | 1 |
 | 289 | 1 |
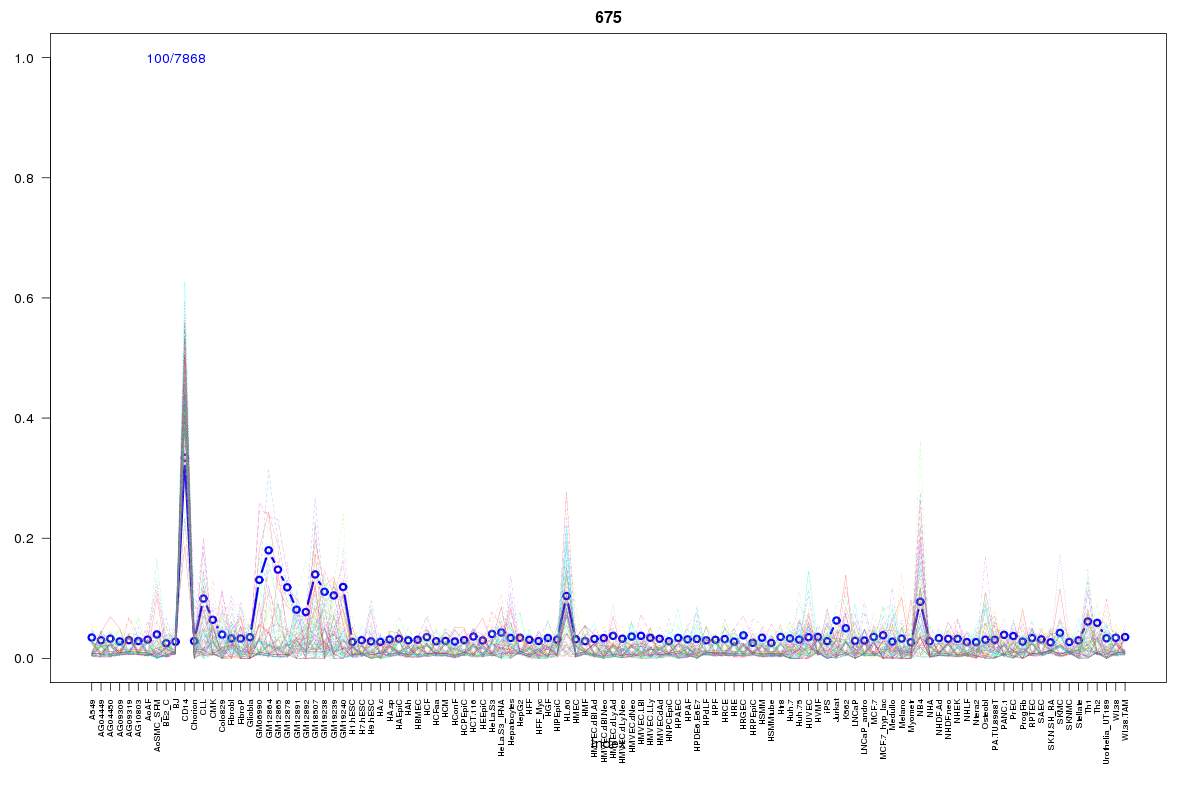 | 675 | 1 |
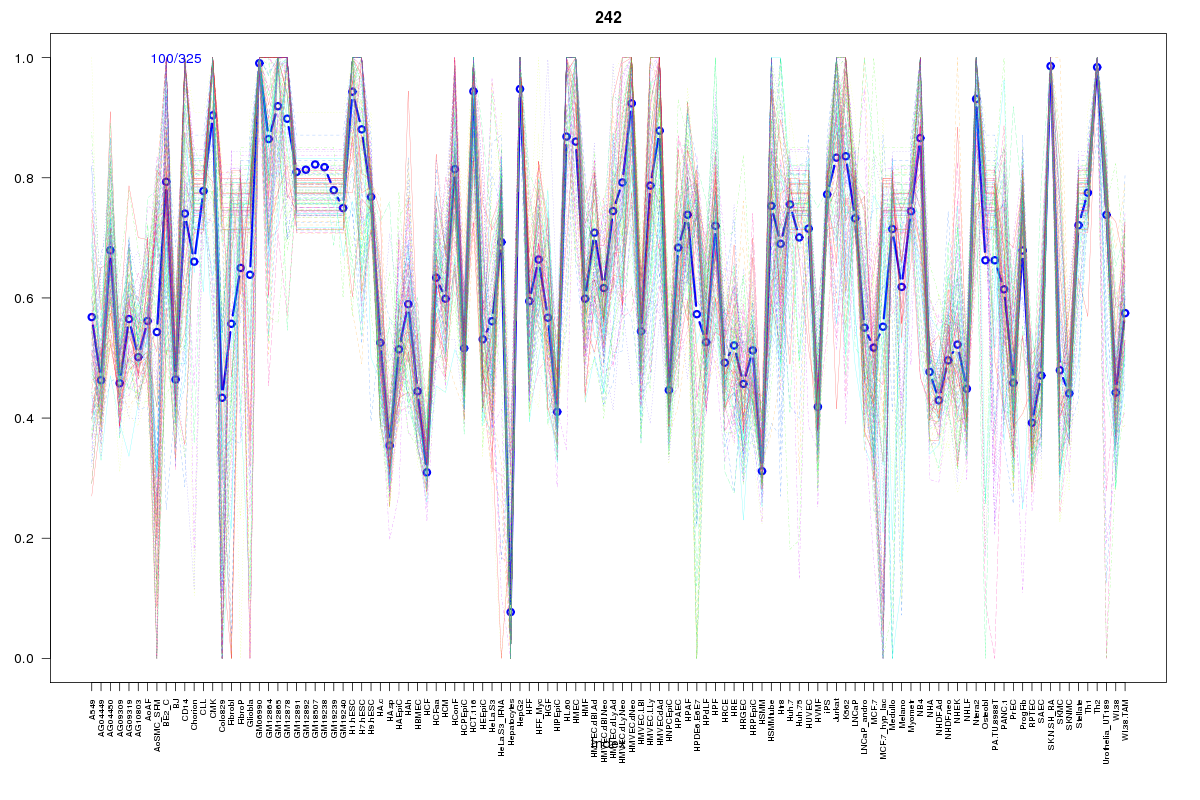 | 242 | 1 |
 | 430 | 1 |
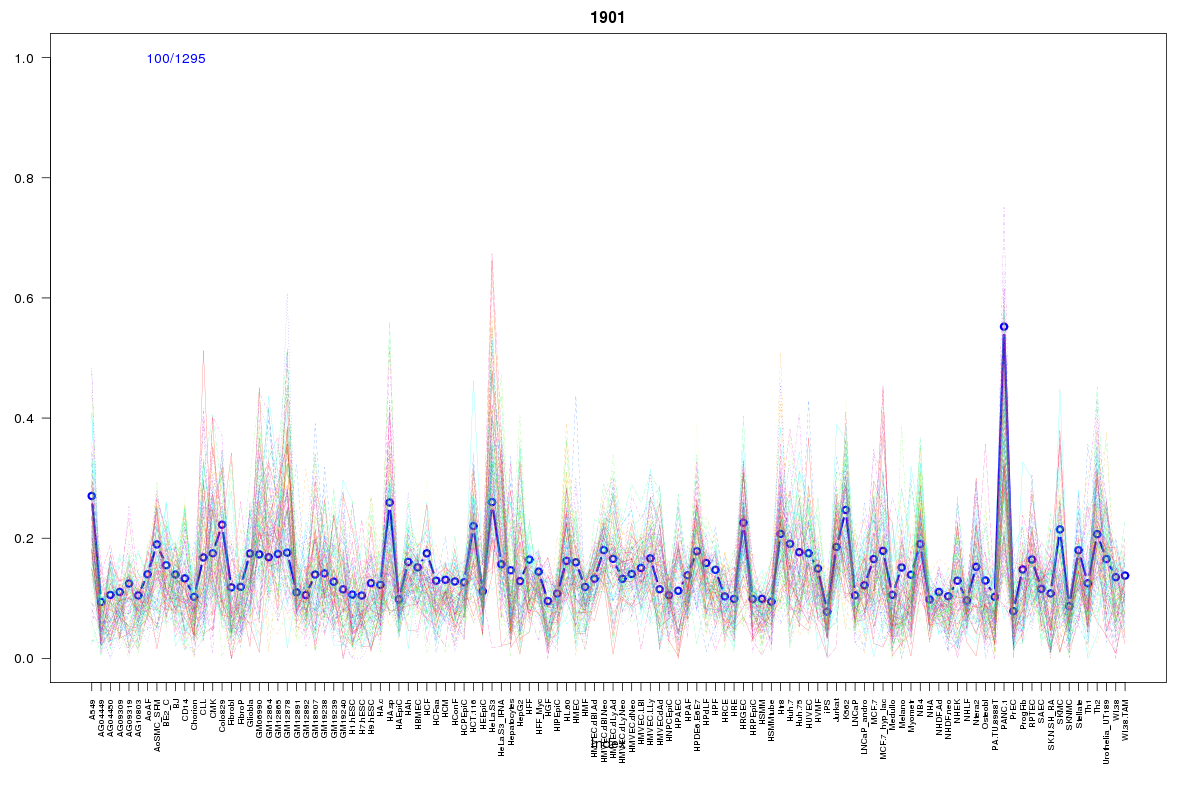 | 1901 | 1 |
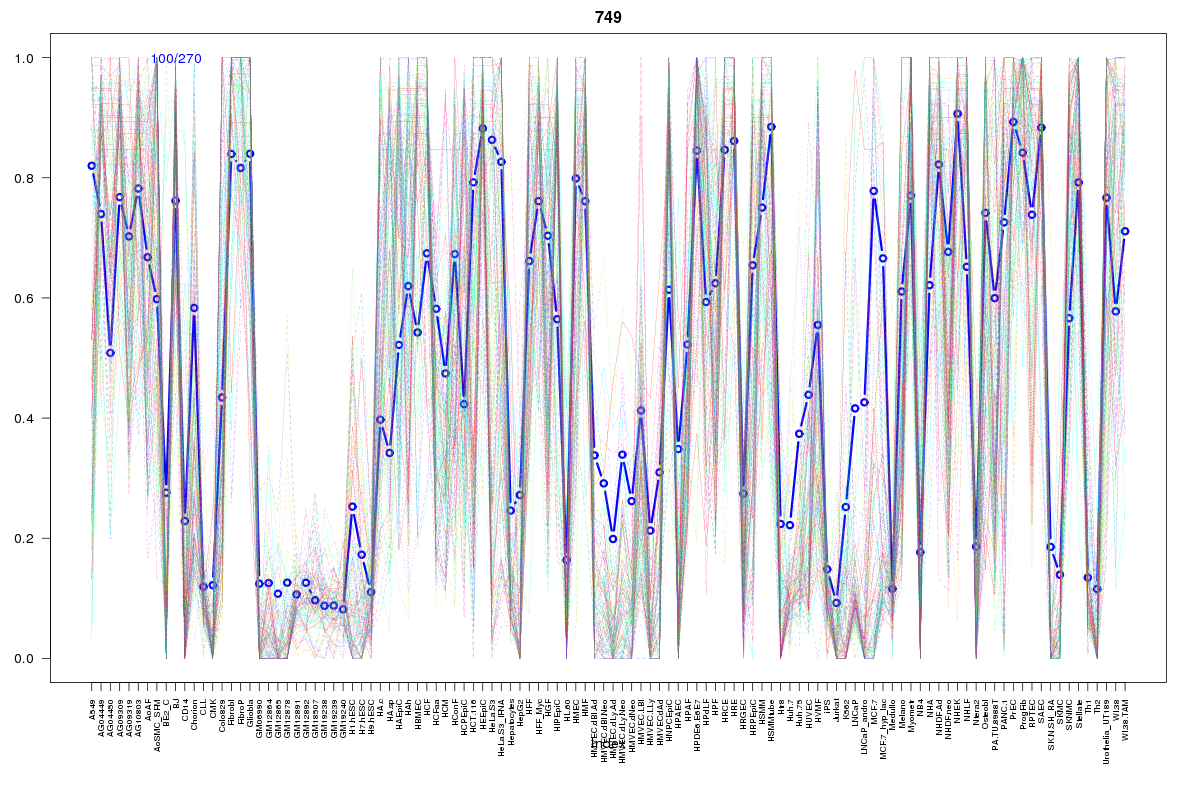 | 749 | 1 |
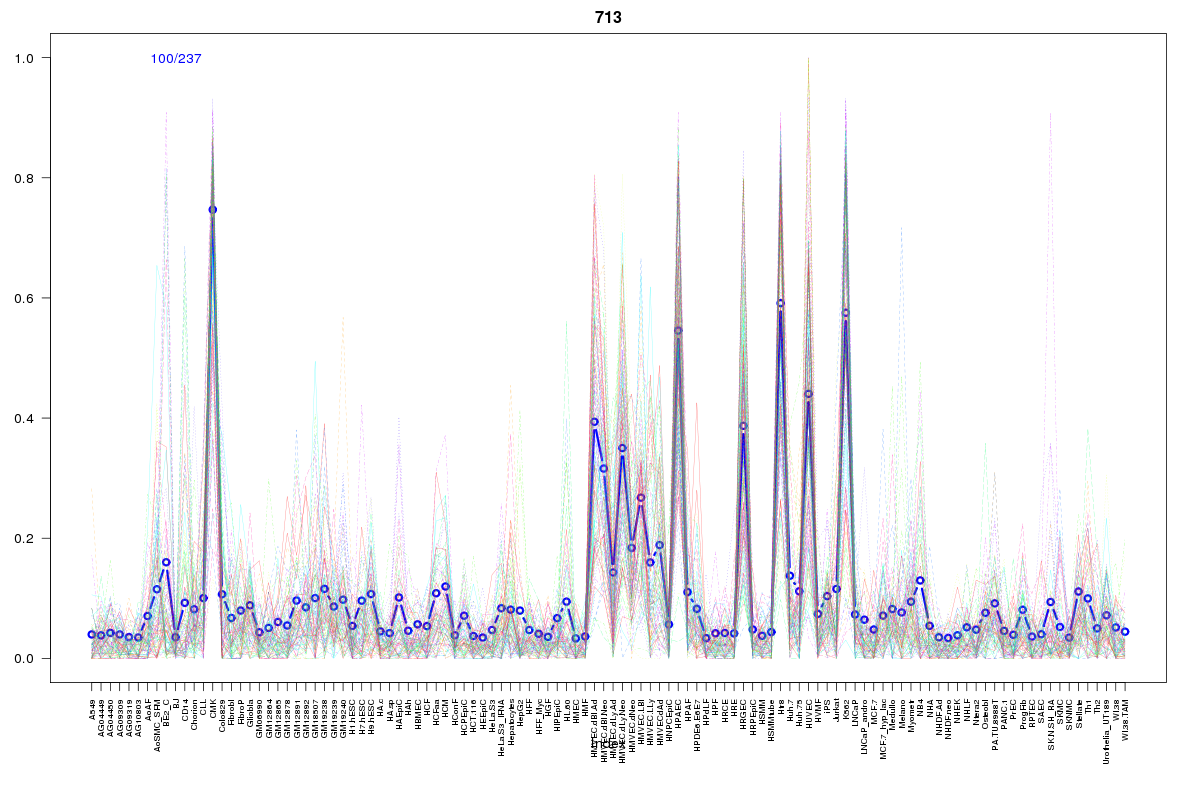 | 713 | 1 |
Resources
BED file downloads
Connects to 21 DHS sitesTop 10 Correlated DHS Sites
p-values indiciate significant higher or lower correlation| Location | Cluster | P-value |
|---|---|---|
| chr1:40446725-40446875 | 430 | 0.001 |
| chr1:40563265-40563415 | 1901 | 0.001 |
| chr1:40648760-40648910 | 874 | 0.001 |
| chr1:40525660-40525810 | 1179 | 0.005 |
| chr1:40596720-40596870 | 713 | 0.008 |
| chr1:40562860-40563010 | 242 | 0.01 |
| chr1:40544300-40544450 | 289 | 0.012 |
| chr1:40525220-40525370 | 374 | 0.012 |
| chr1:40609545-40609695 | 806 | 0.015 |
| chr1:40525000-40525150 | 352 | 0.016 |
| chr1:40561580-40561730 | 675 | 0.017 |
External Databases
UCSCEnsembl (ENSG00000131238)