Gene: LACTB2
chr8: 71547552-71581409Expression Profile
(log scale)
Graphical Connections
Distribution of linked clusters:
You may find it interesting if many of the connected DHS sites belong to the same cluster.| Cluster Profile | Cluster ID | Number of DHS sites in this cluster |
|---|---|---|
 | 862 | 5 |
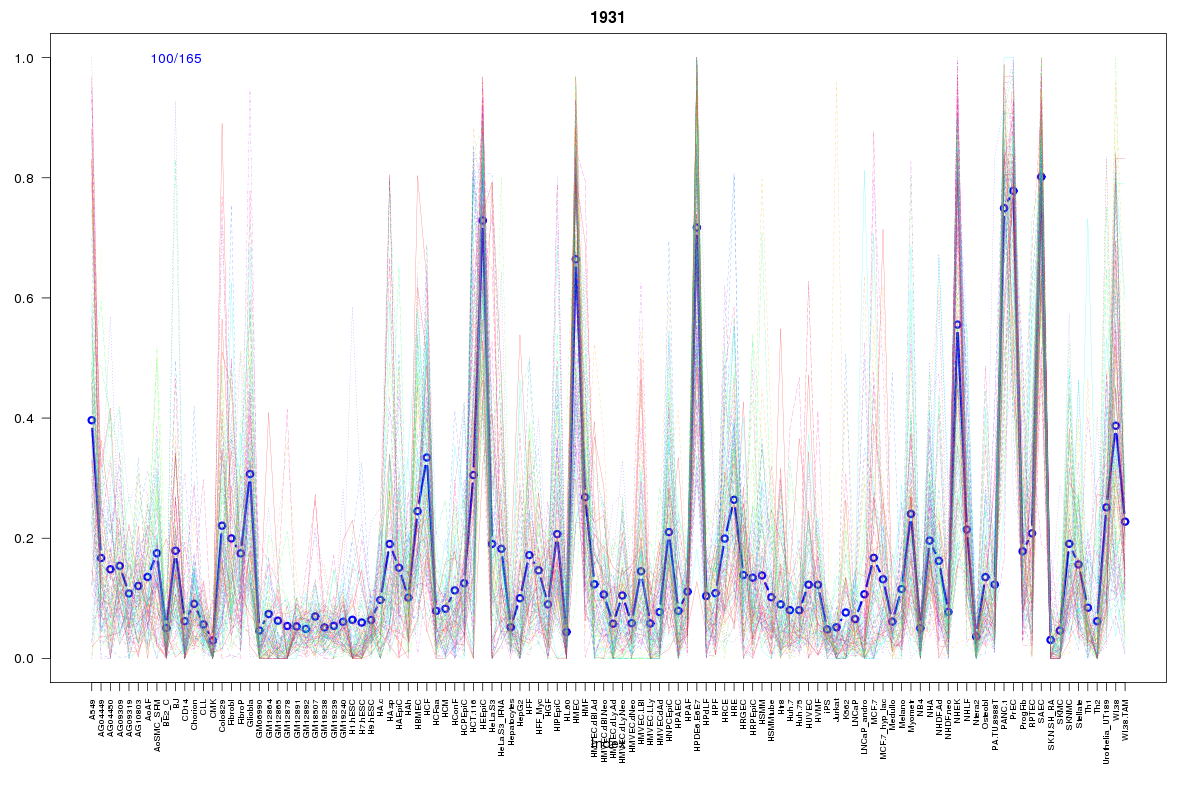 | 1931 | 1 |
 | 687 | 1 |
 | 979 | 1 |
 | 283 | 1 |
 | 2175 | 1 |
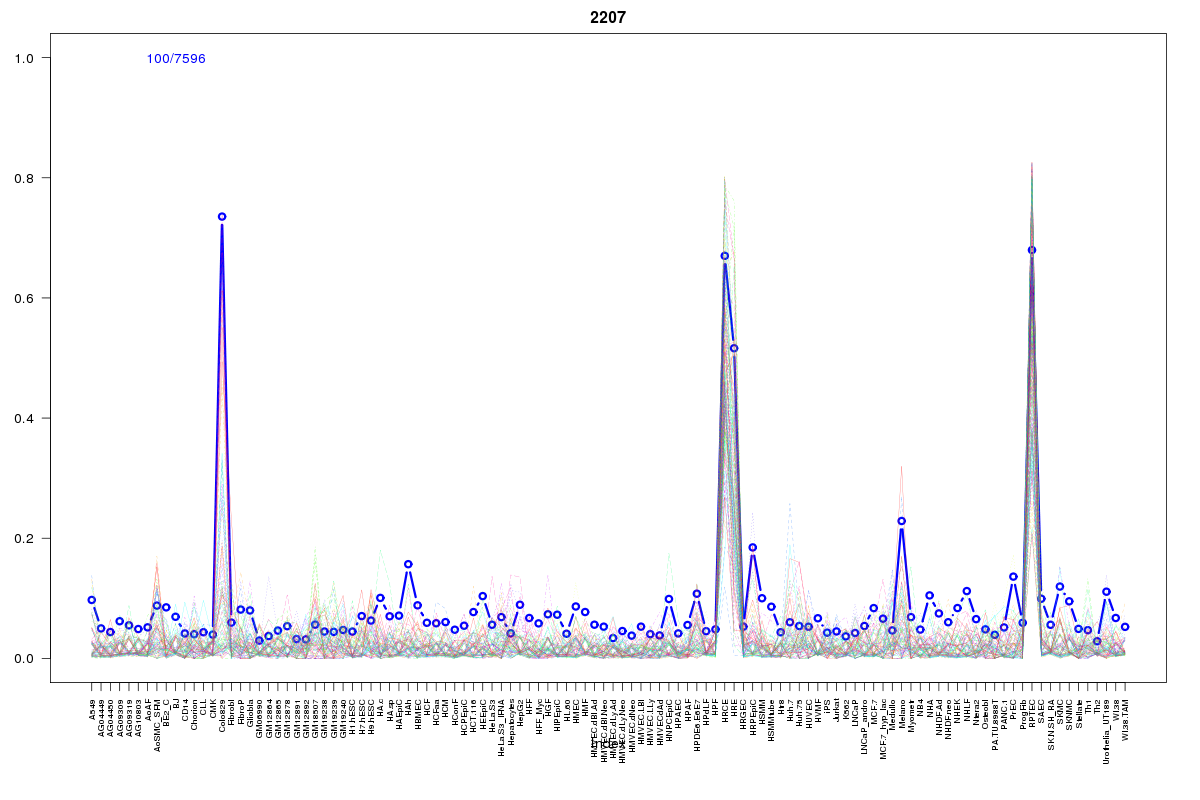 | 2207 | 1 |
 | 1016 | 1 |
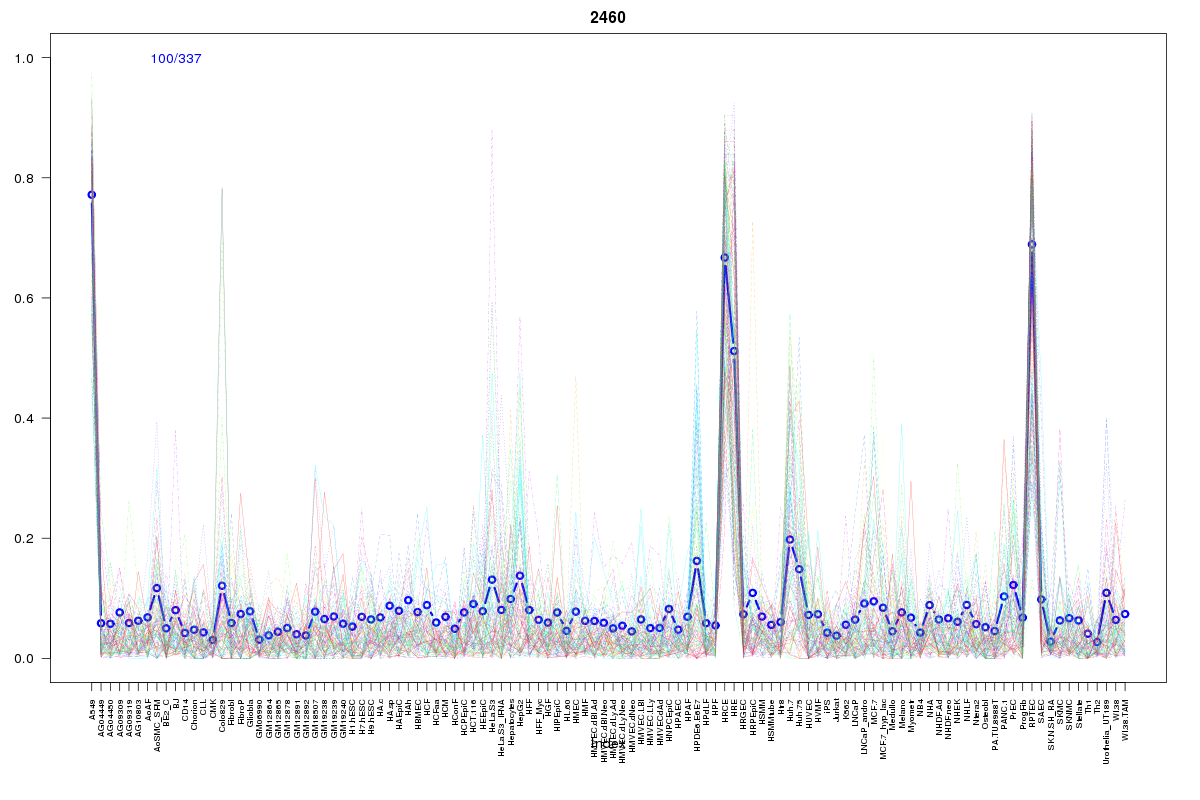 | 2460 | 1 |
Resources
BED file downloads
Connects to 13 DHS sitesTop 10 Correlated DHS Sites
p-values indiciate significant higher or lower correlation| Location | Cluster | P-value |
|---|---|---|
| chr8:71579420-71579570 | 2460 | 0 |
| chr8:71579080-71579230 | 1016 | 0.005 |
| chr8:71569640-71569790 | 862 | 0.006 |
| chr8:71587900-71588050 | 862 | 0.013 |
| chr8:71573320-71573470 | 862 | 0.014 |
| chr8:71573900-71574050 | 2207 | 0.016 |
| chr8:71524480-71524630 | 2175 | 0.016 |
| chr8:71461380-71461530 | 862 | 0.017 |
| chr8:71501880-71502030 | 862 | 0.02 |
| chr8:71469720-71469870 | 1931 | 0.022 |
| chr8:71515140-71515290 | 979 | 0.016 |
External Databases
UCSCEnsembl (ENSG00000147592)