Gene: TAC3
chr12: 57403783-57410325Expression Profile
(log scale)
Graphical Connections
Distribution of linked clusters:
You may find it interesting if many of the connected DHS sites belong to the same cluster.| Cluster Profile | Cluster ID | Number of DHS sites in this cluster |
|---|---|---|
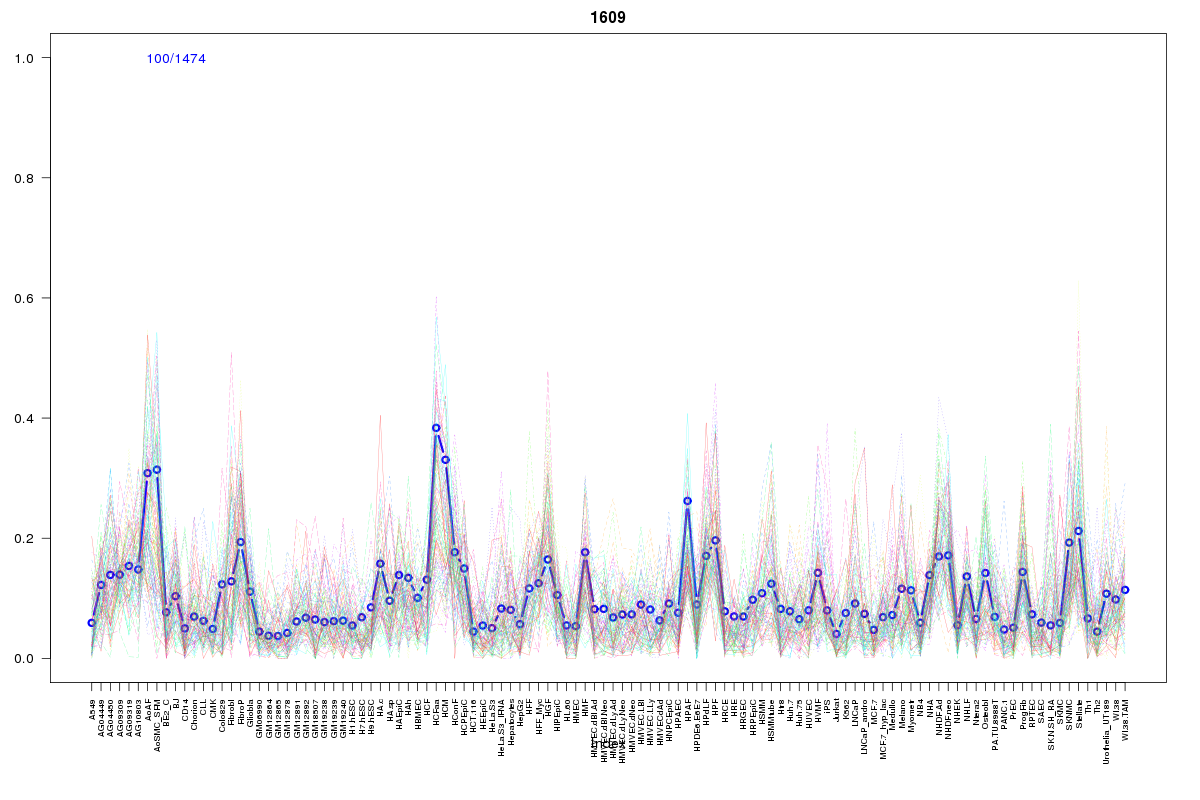 | 1609 | 2 |
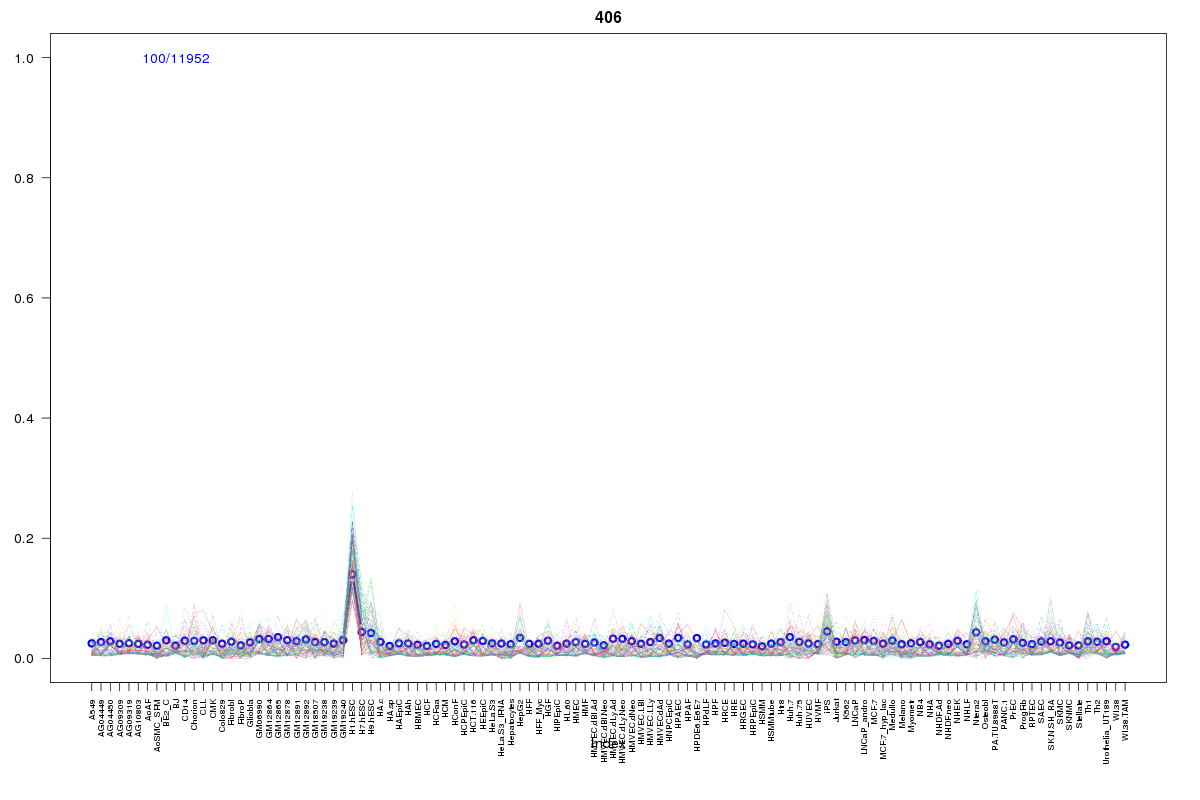 | 406 | 2 |
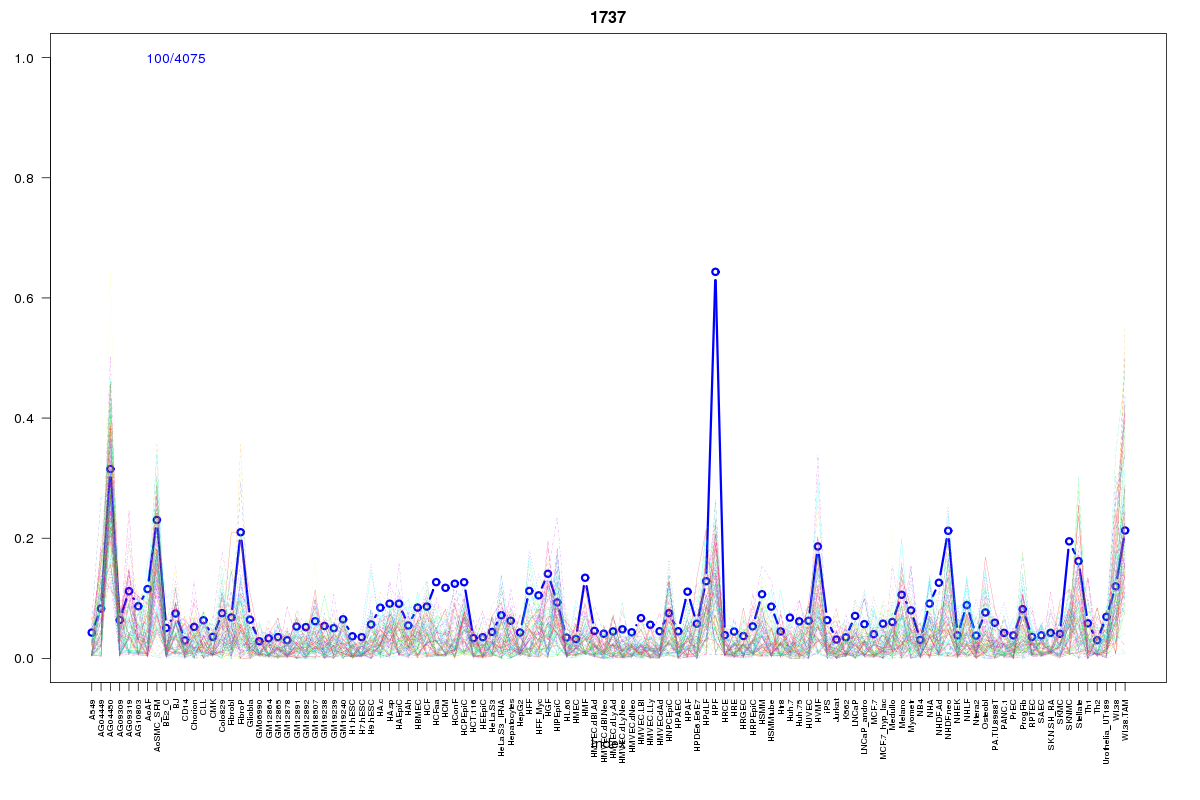 | 1737 | 1 |
 | 2055 | 1 |
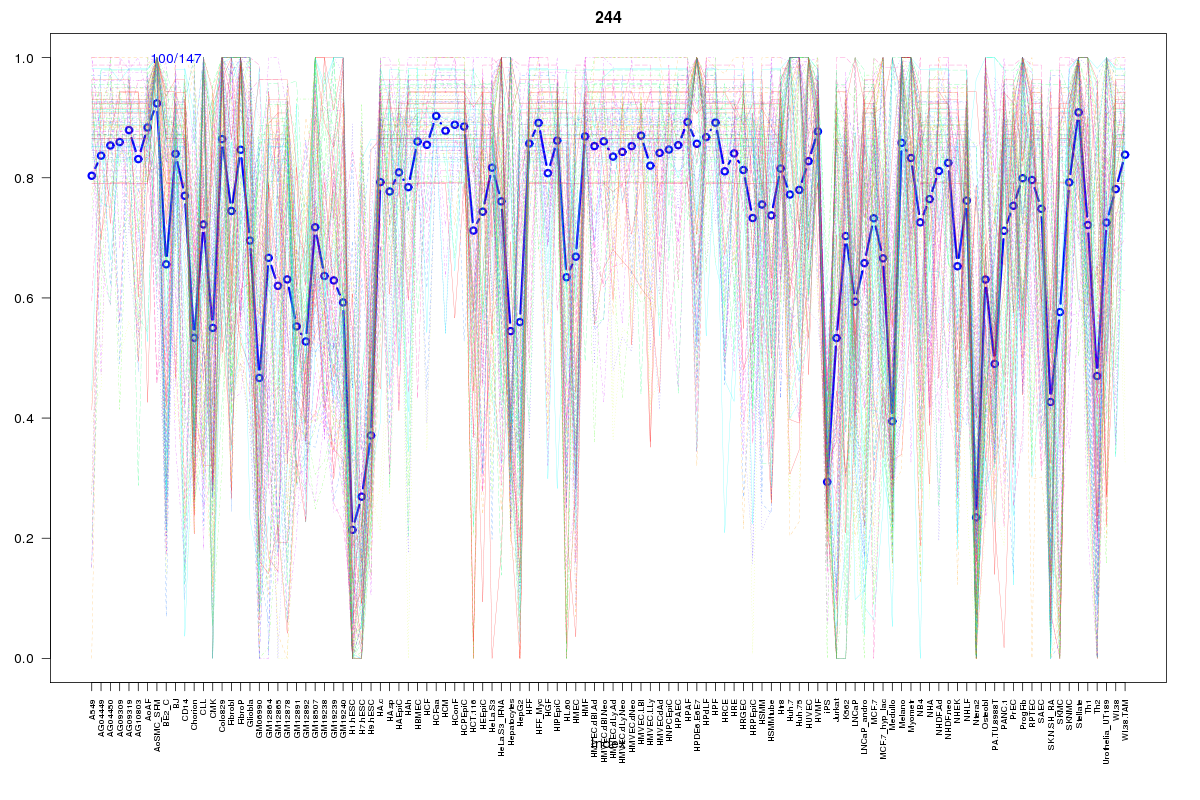 | 244 | 1 |
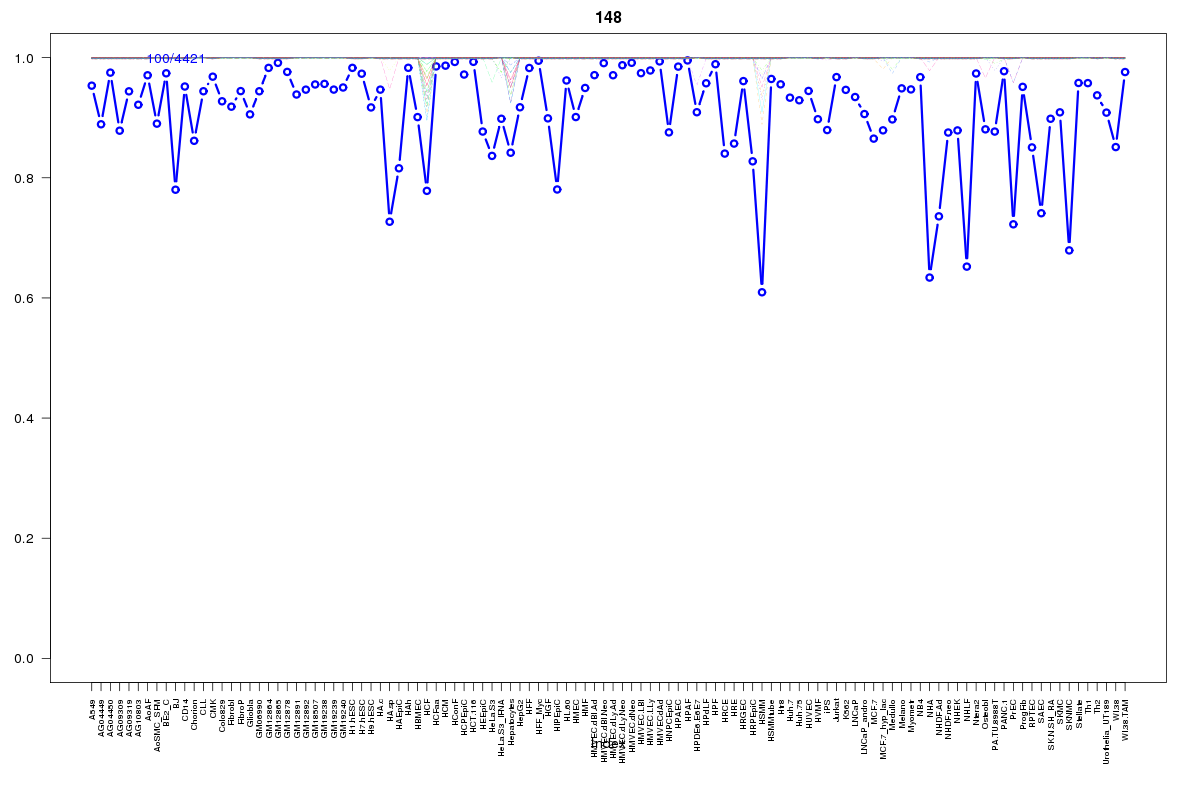 | 148 | 1 |
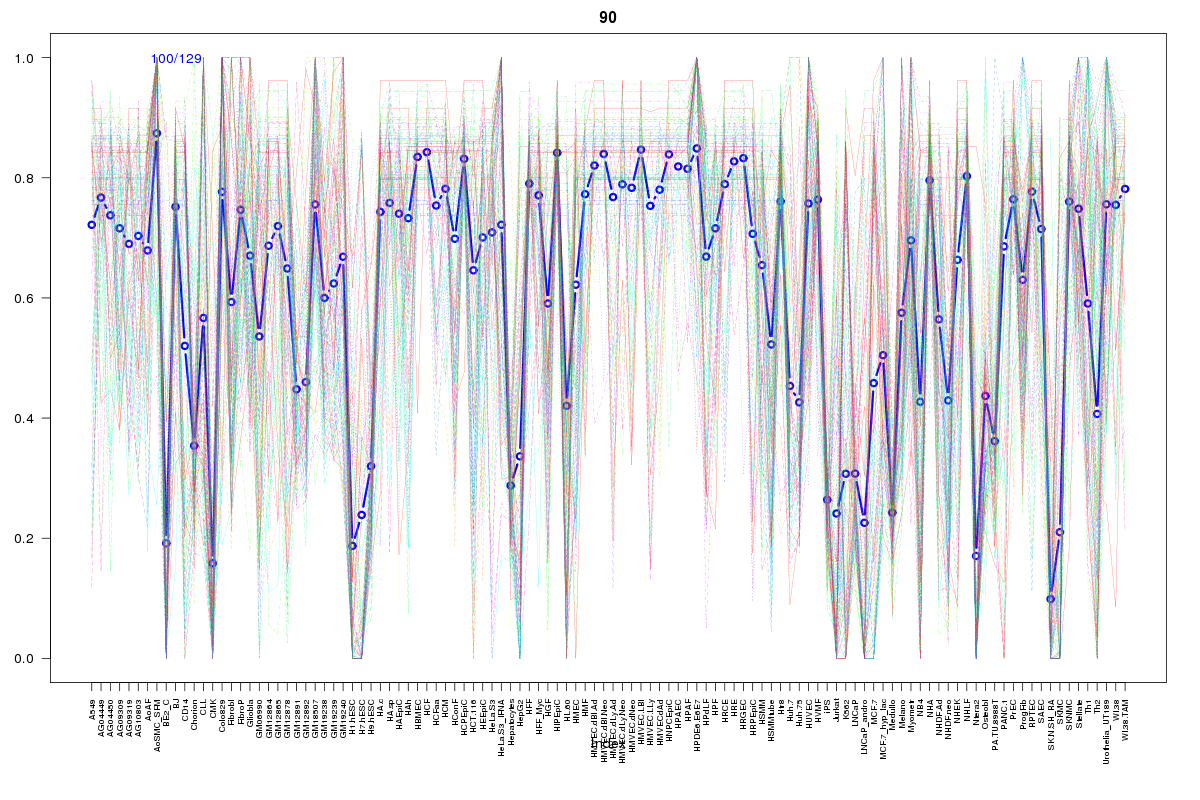 | 90 | 1 |
 | 510 | 1 |
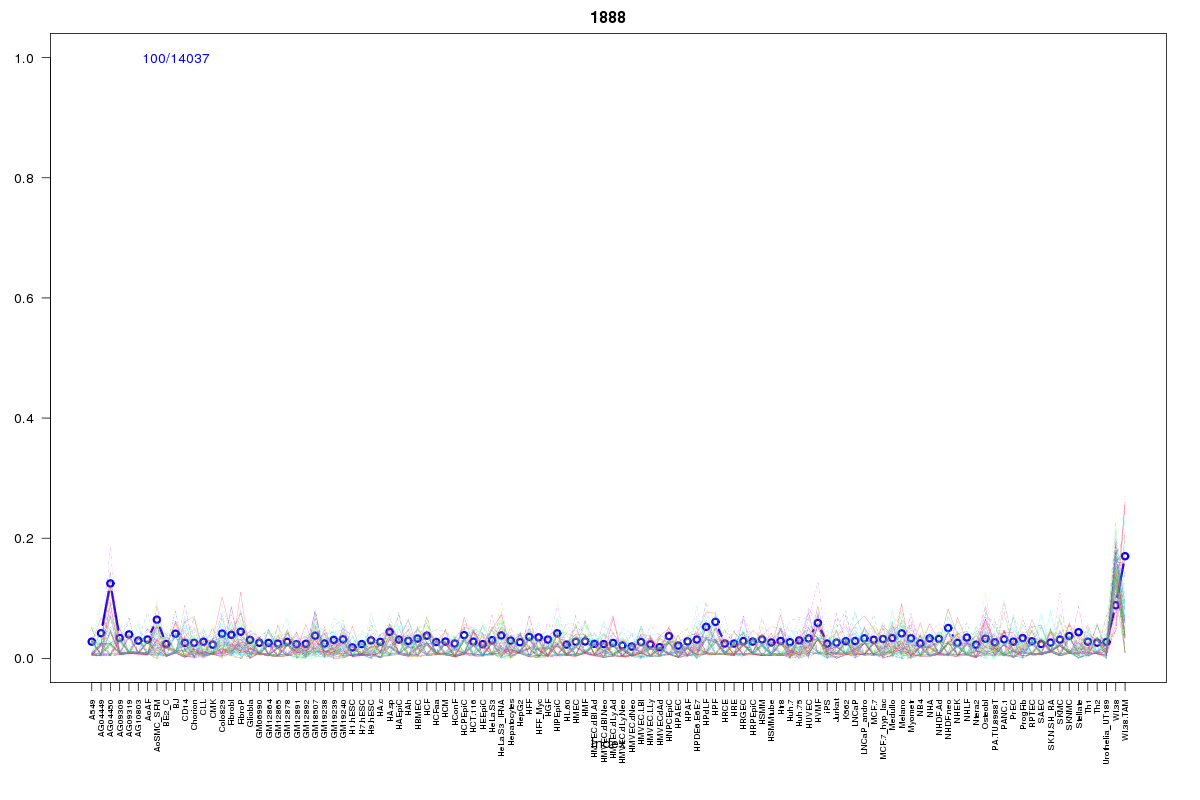 | 1888 | 1 |
 | 2212 | 1 |
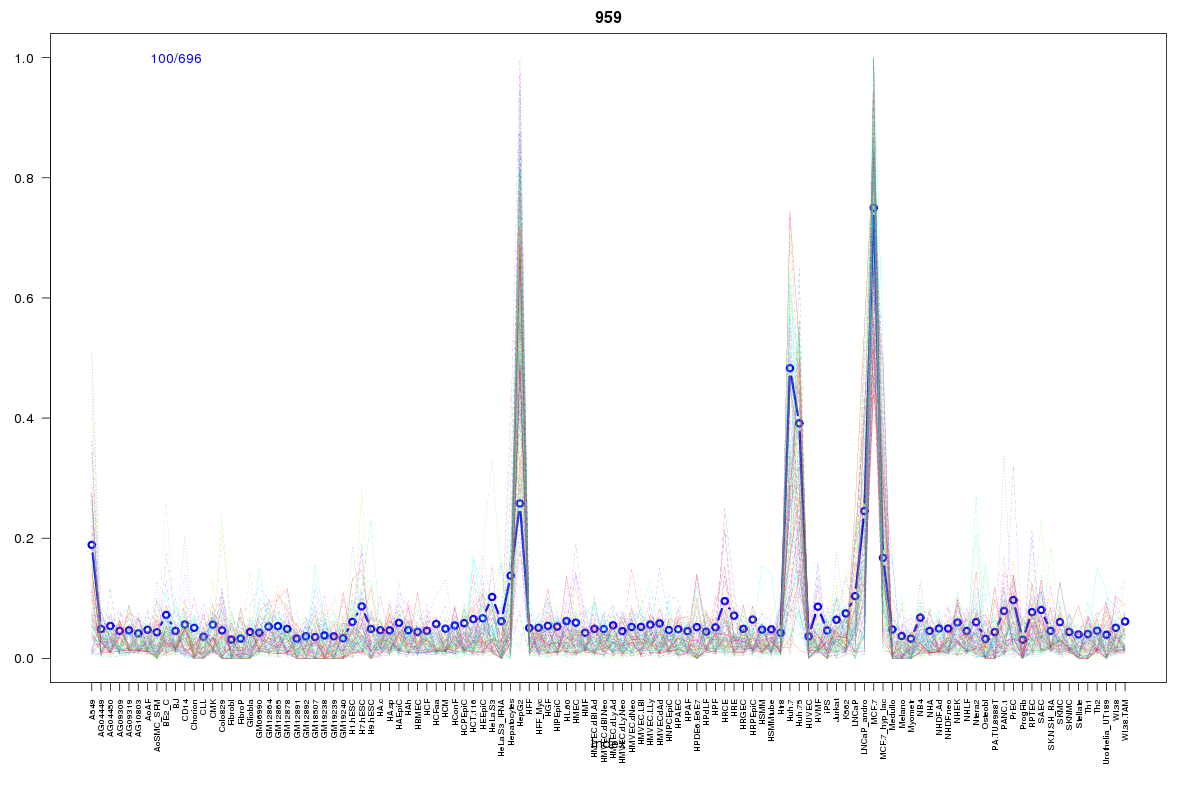 | 959 | 1 |
Resources
BED file downloads
Connects to 13 DHS sitesTop 10 Correlated DHS Sites
p-values indiciate significant higher or lower correlation| Location | Cluster | P-value |
|---|---|---|
| chr12:57416220-57416370 | 1737 | 0 |
| chr12:57383400-57383550 | 1888 | 0.003 |
| chr12:57436800-57436950 | 406 | 0.009 |
| chr12:57404145-57404295 | 406 | 0.011 |
| chr12:57412400-57412550 | 959 | 0.014 |
| chr12:57326040-57326190 | 510 | 0.019 |
| chr12:57419865-57420015 | 2055 | 0.019 |
| chr12:57406885-57407035 | 2212 | 0.019 |
| chr12:57484965-57485115 | 1609 | 0.014 |
| chr12:57484780-57484930 | 1609 | 0.01 |
| chr12:57482420-57482570 | 148 | 0.009 |
External Databases
UCSCEnsembl (ENSG00000166863)