Gene: TP53I13
chr17: 27893069-27895359Expression Profile
(log scale)
Graphical Connections
Distribution of linked clusters:
You may find it interesting if many of the connected DHS sites belong to the same cluster.| Cluster Profile | Cluster ID | Number of DHS sites in this cluster |
|---|---|---|
 | 1605 | 1 |
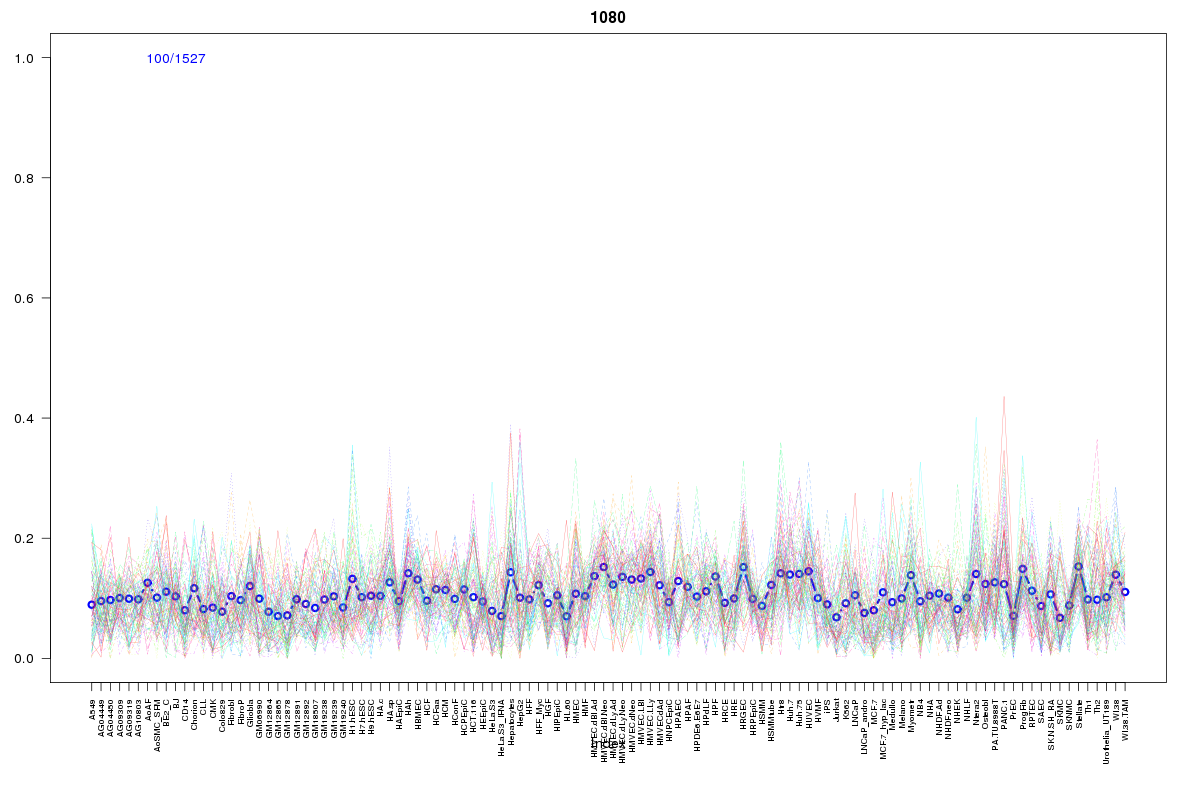 | 1080 | 1 |
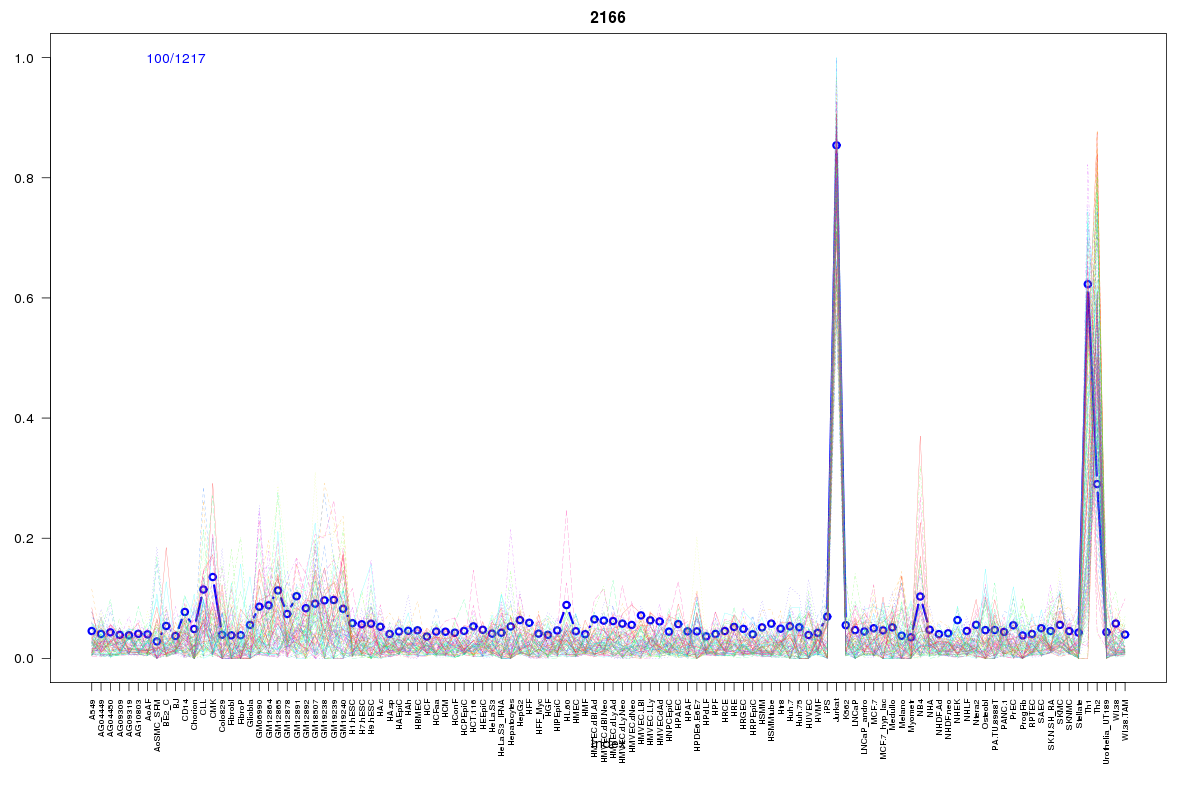 | 2166 | 1 |
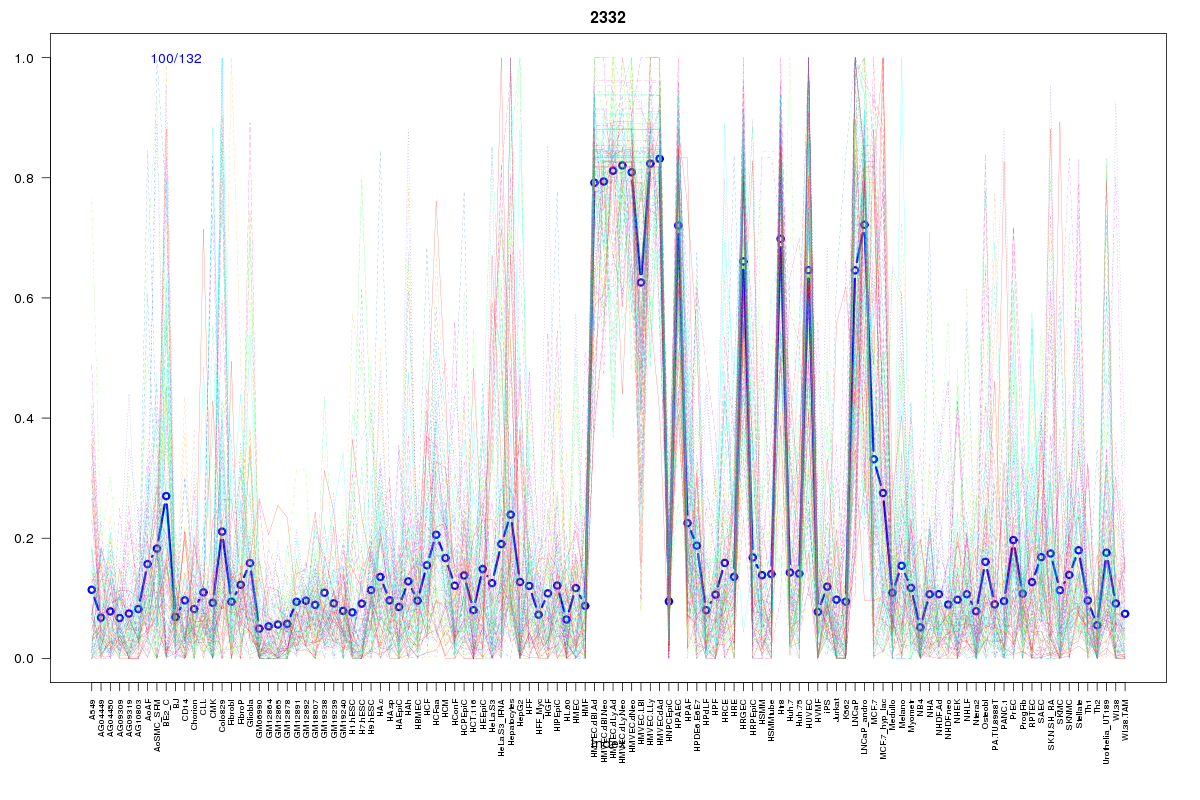 | 2332 | 1 |
 | 934 | 1 |
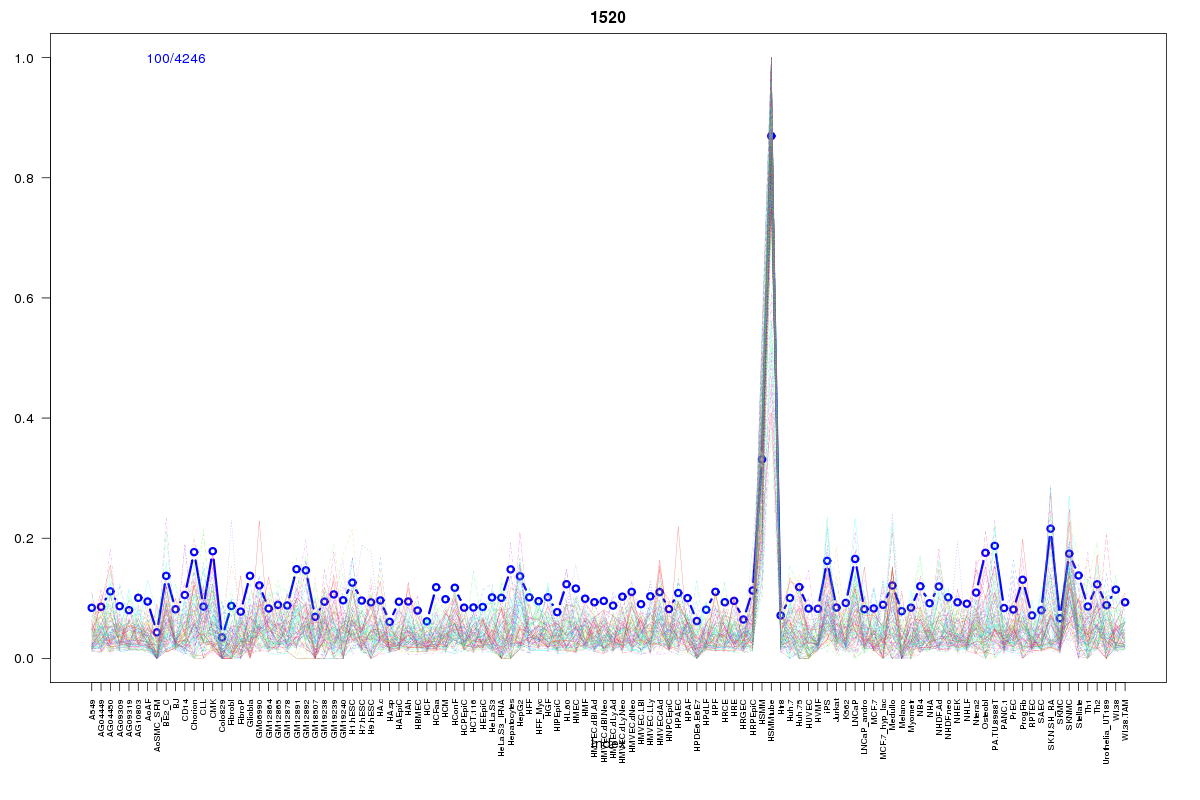 | 1520 | 1 |
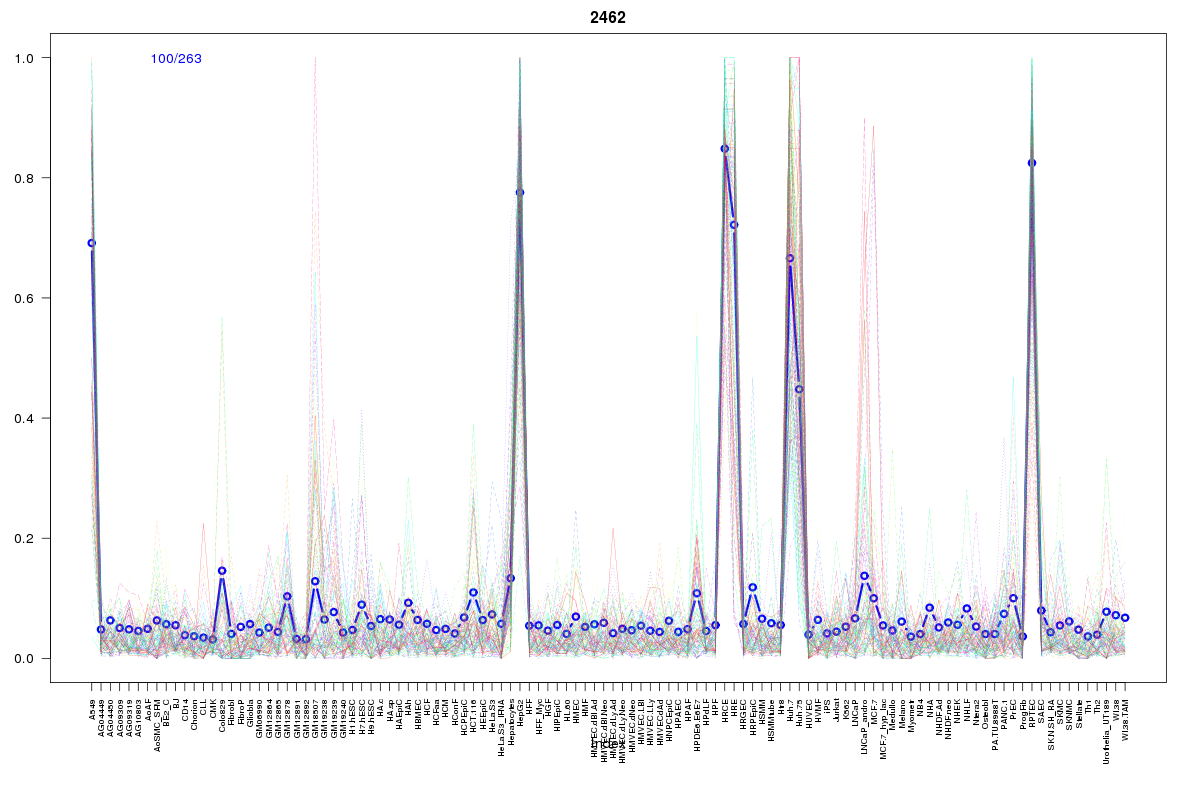 | 2462 | 1 |
Resources
BED file downloads
Connects to 7 DHS sitesTop 10 Correlated DHS Sites
p-values indiciate significant higher or lower correlation| Location | Cluster | P-value |
|---|---|---|
| chr17:27948005-27948155 | 1605 | 0.006 |
| chr17:27883000-27883150 | 2462 | 0.012 |
| chr17:27951660-27951810 | 2166 | 0.013 |
| chr17:27949025-27949175 | 1080 | 0.019 |
| chr17:27876680-27876830 | 1520 | 0.018 |
| chr17:27968400-27968550 | 2332 | 0.007 |
| chr17:27968740-27968890 | 934 | 0.007 |
External Databases
UCSCEnsembl (ENSG00000167543)