Gene: MYRIP
chr3: 39850404-40299657Expression Profile
(log scale)
Graphical Connections
Distribution of linked clusters:
You may find it interesting if many of the connected DHS sites belong to the same cluster.| Cluster Profile | Cluster ID | Number of DHS sites in this cluster |
|---|---|---|
 | 687 | 3 |
 | 935 | 2 |
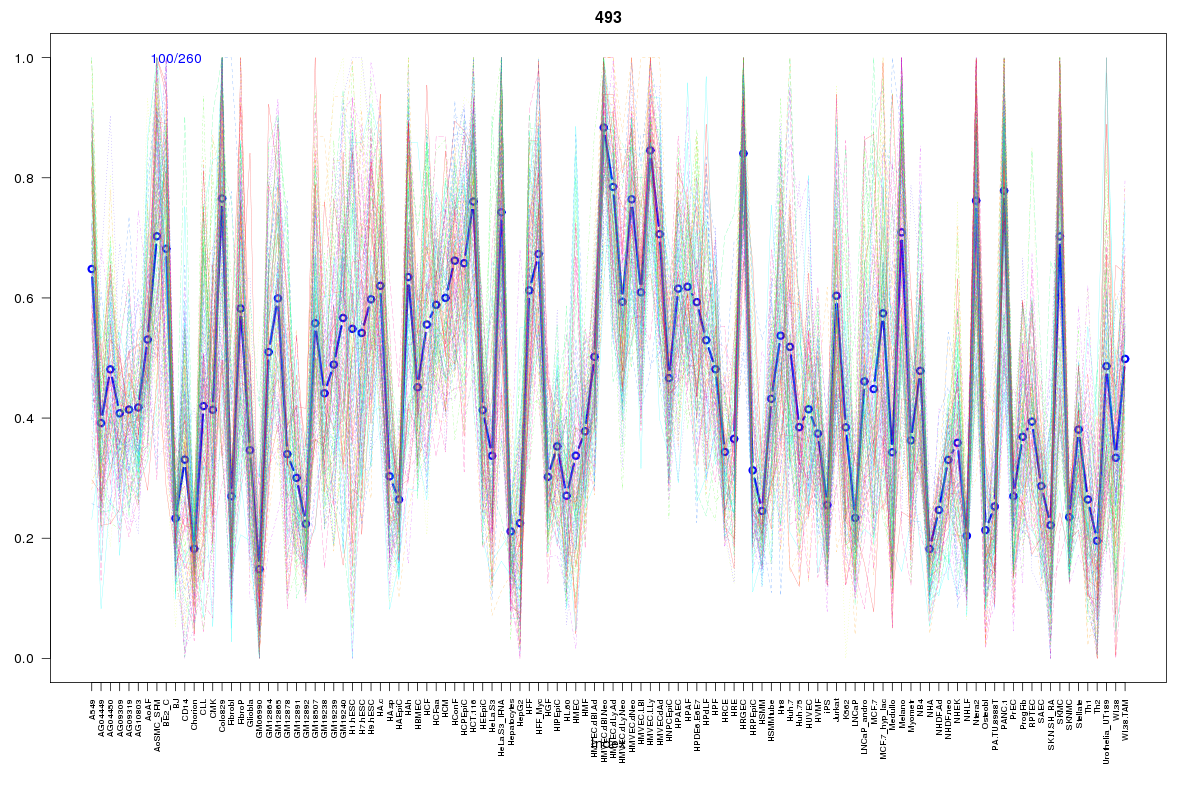 | 493 | 1 |
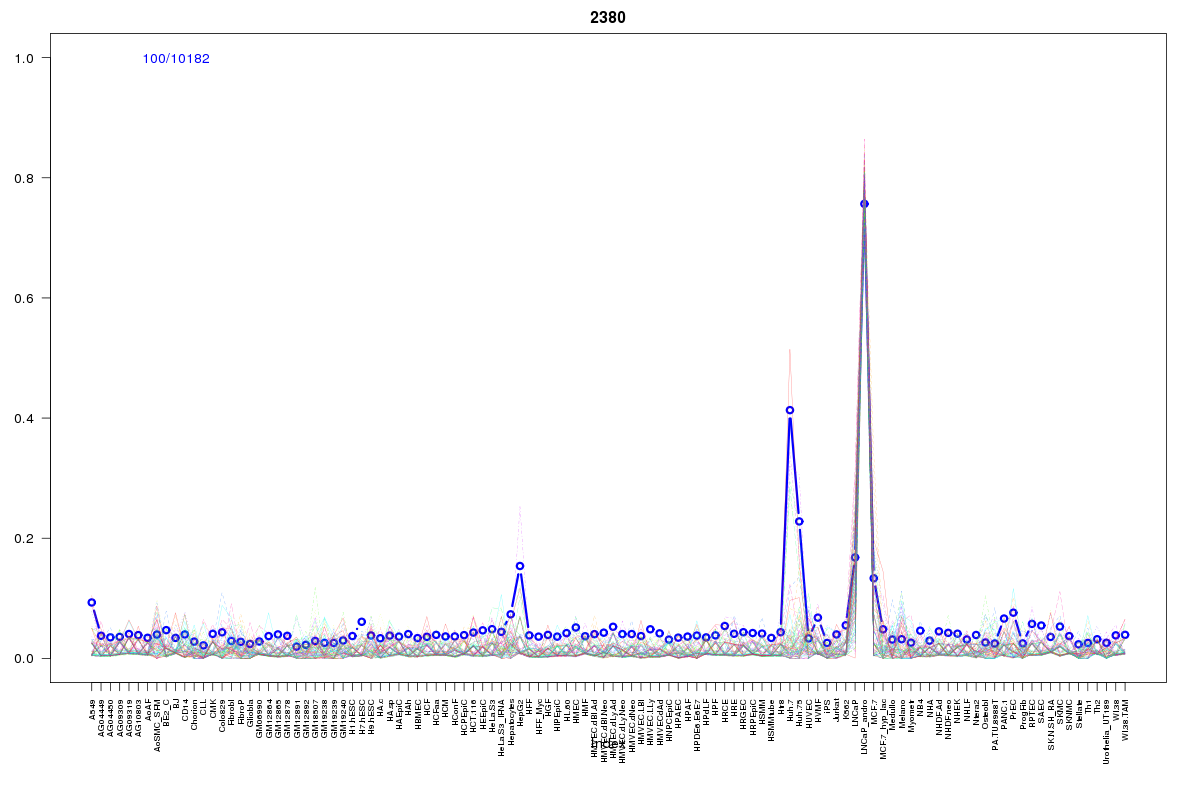 | 2380 | 1 |
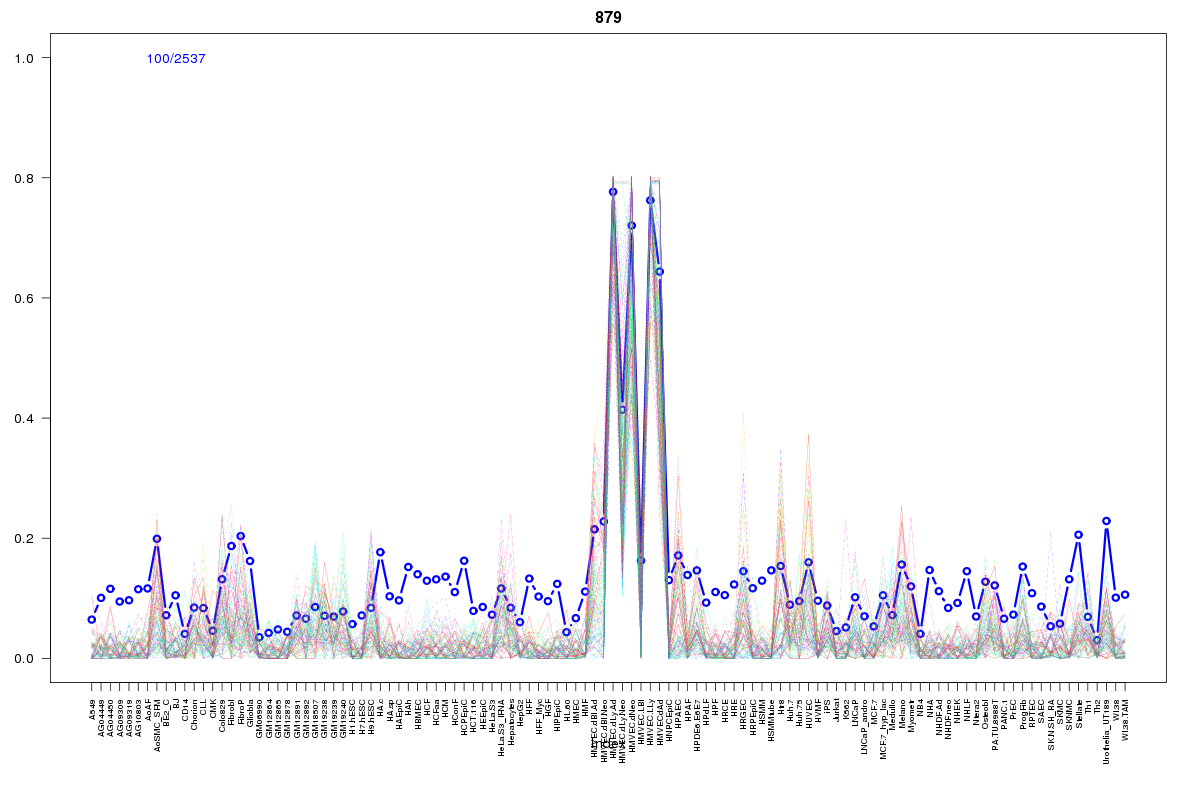 | 879 | 1 |
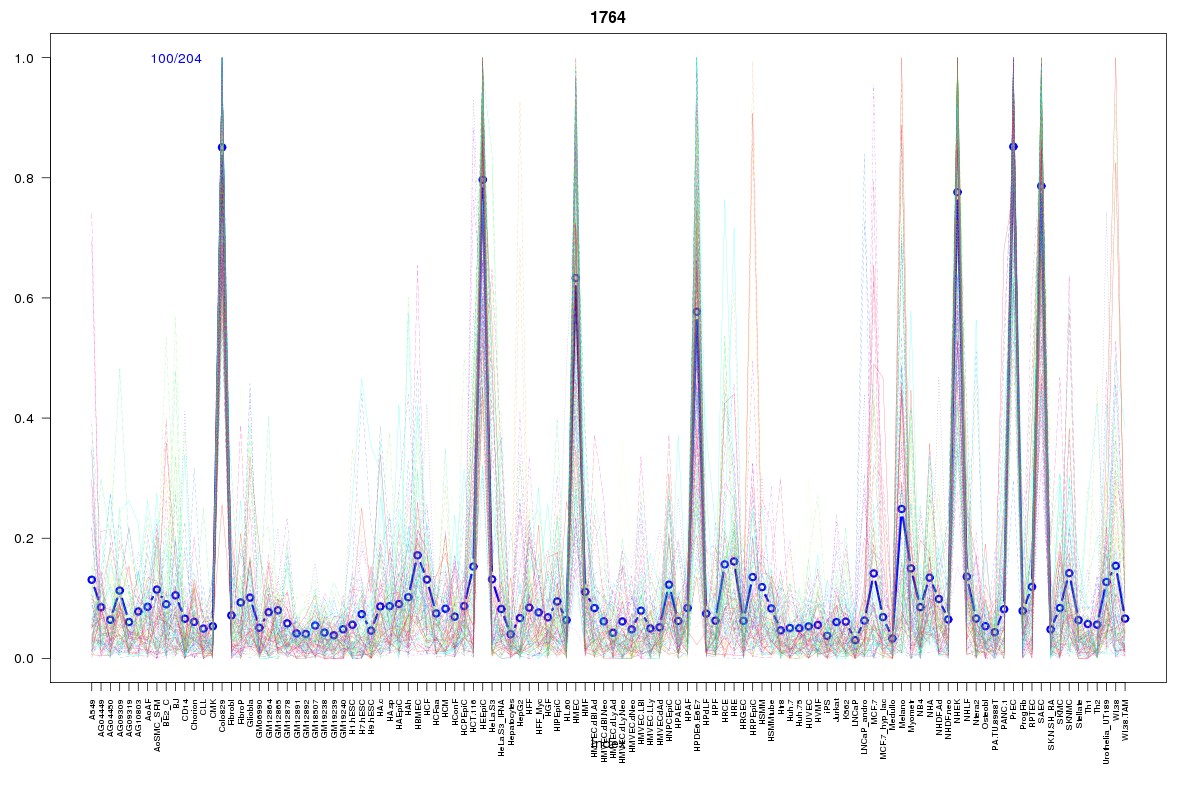 | 1764 | 1 |
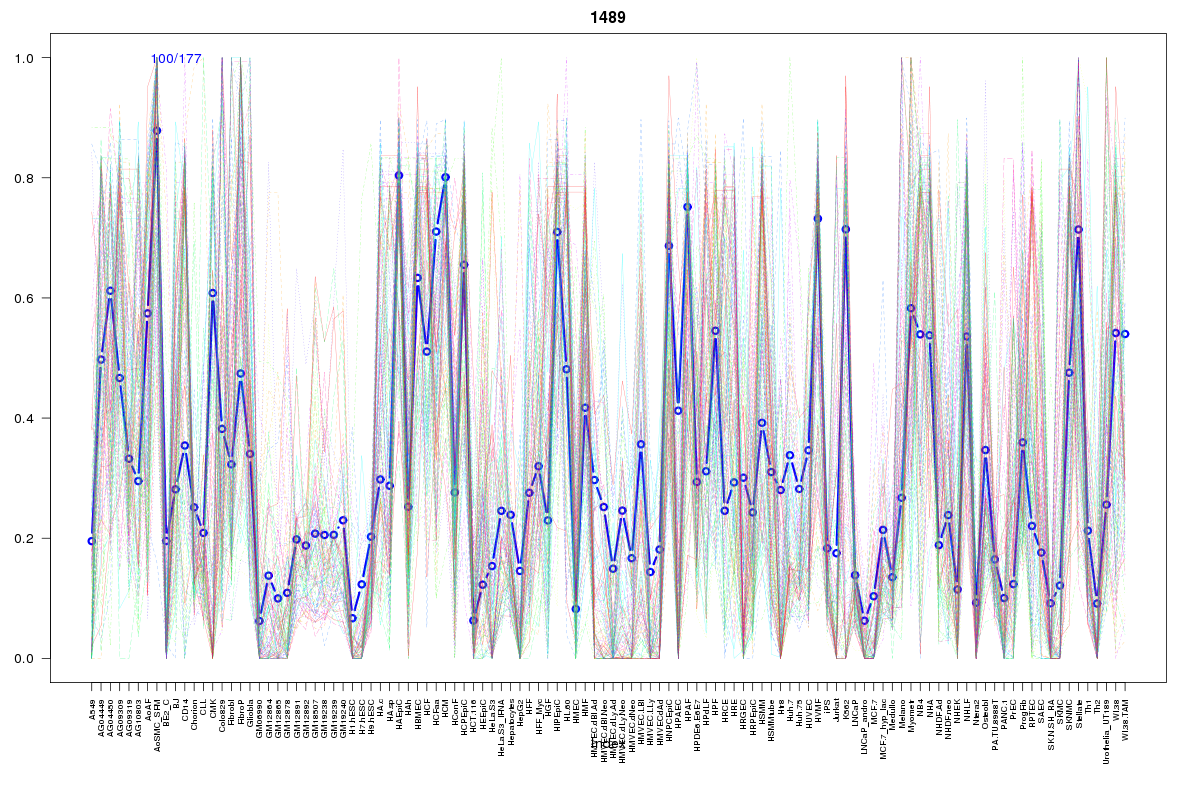 | 1489 | 1 |
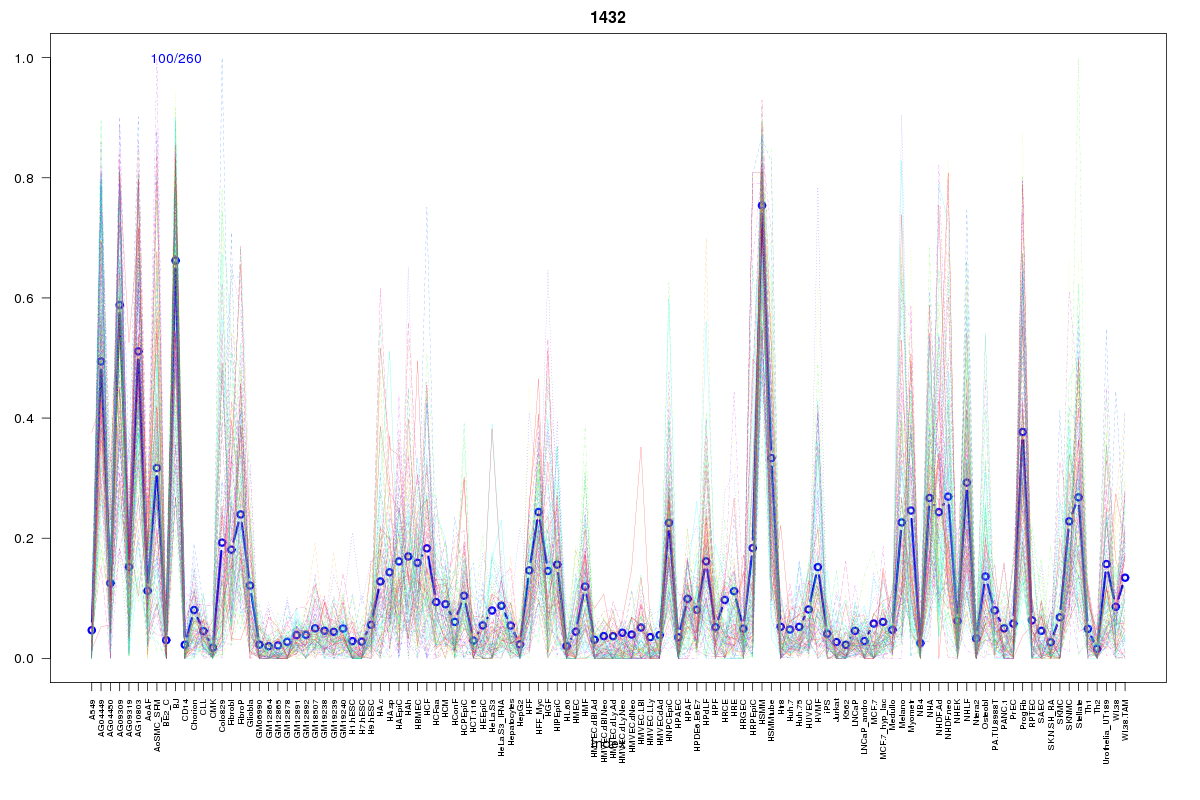 | 1432 | 1 |
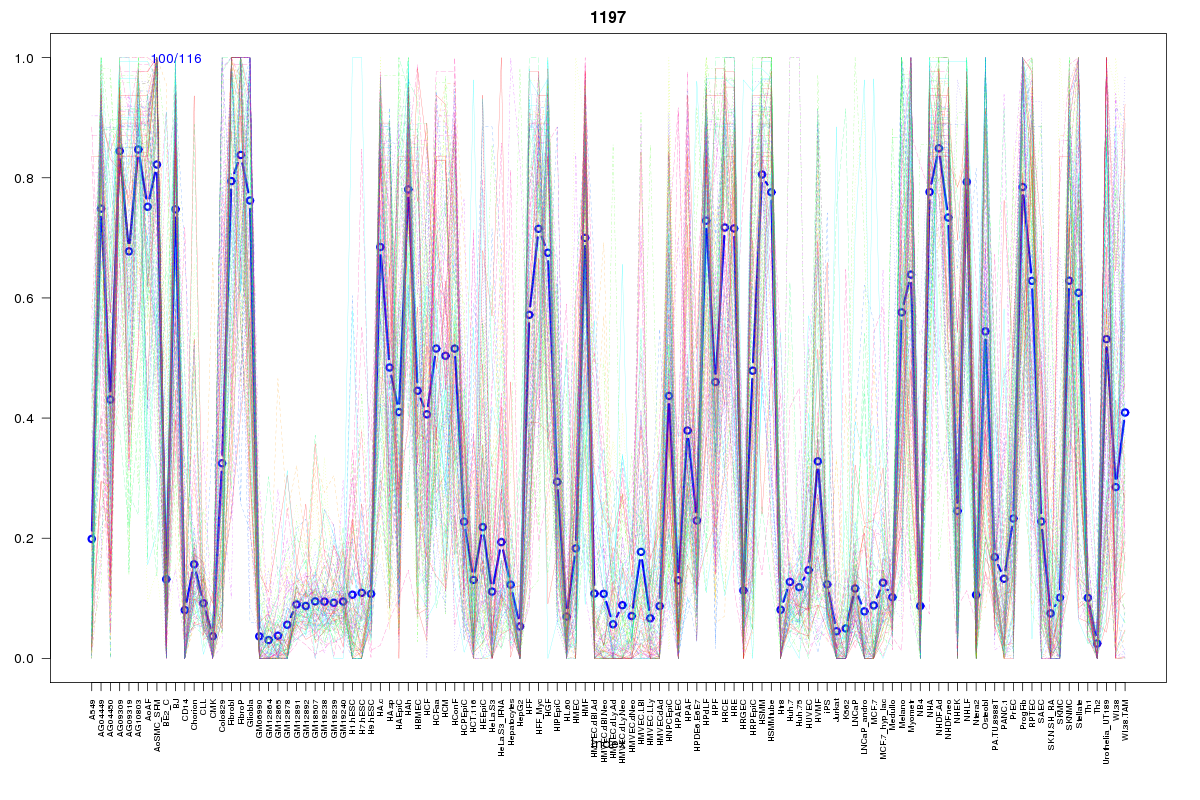 | 1197 | 1 |
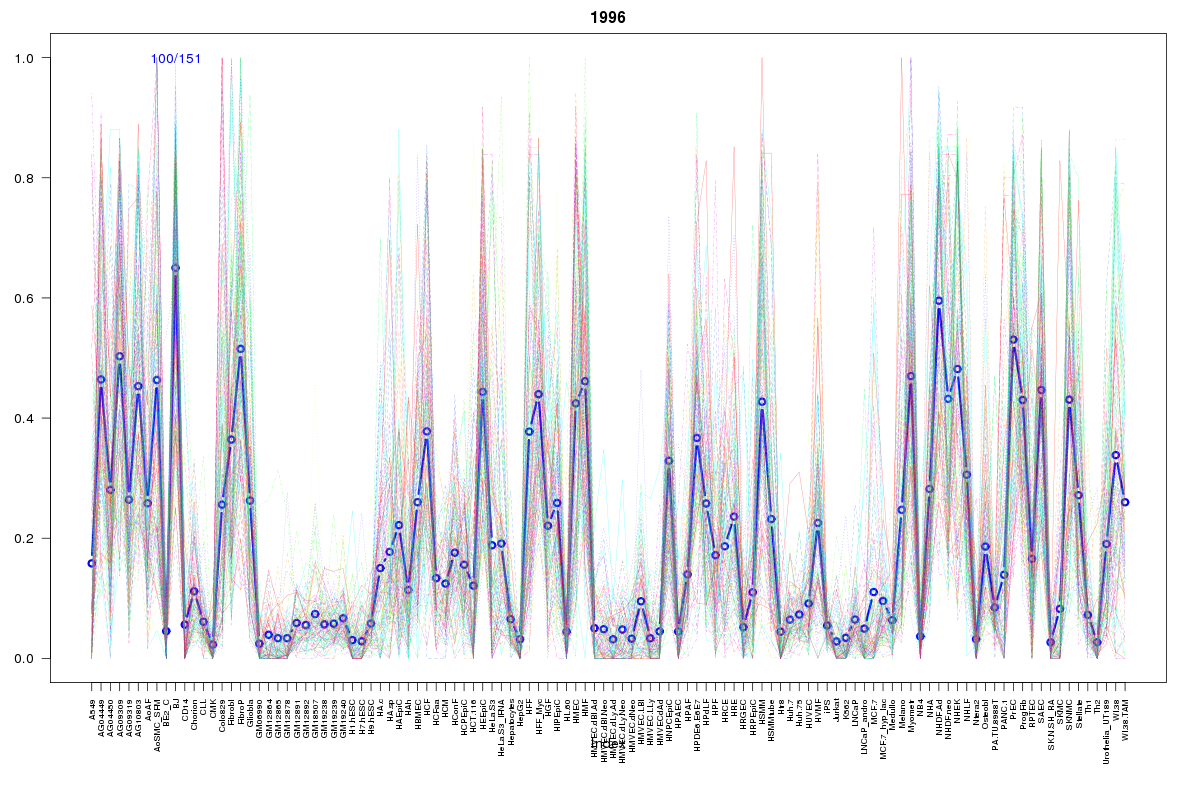 | 1996 | 1 |
 | 2186 | 1 |
 | 860 | 1 |
Resources
BED file downloads
Connects to 15 DHS sitesTop 10 Correlated DHS Sites
p-values indiciate significant higher or lower correlation| Location | Cluster | P-value |
|---|---|---|
| chr3:40146060-40146210 | 935 | 0.003 |
| chr3:40274260-40274410 | 879 | 0.005 |
| chr3:40221540-40221690 | 687 | 0.006 |
| chr3:40214760-40214910 | 935 | 0.008 |
| chr3:40258060-40258210 | 687 | 0.008 |
| chr3:40243325-40243475 | 687 | 0.013 |
| chr3:40209560-40209710 | 2186 | 0.013 |
| chr3:40272880-40273030 | 2380 | 0.017 |
| chr3:40220540-40220690 | 493 | 0.017 |
| chr3:40219885-40220035 | 860 | 0.023 |
| chr3:40341400-40341550 | 1489 | 0.017 |
External Databases
UCSCEnsembl (ENSG00000170011)