Gene: FCER1A
chr1: 159259503-159278014Expression Profile
(log scale)
Graphical Connections
Distribution of linked clusters:
You may find it interesting if many of the connected DHS sites belong to the same cluster.| Cluster Profile | Cluster ID | Number of DHS sites in this cluster |
|---|---|---|
 | 568 | 18 |
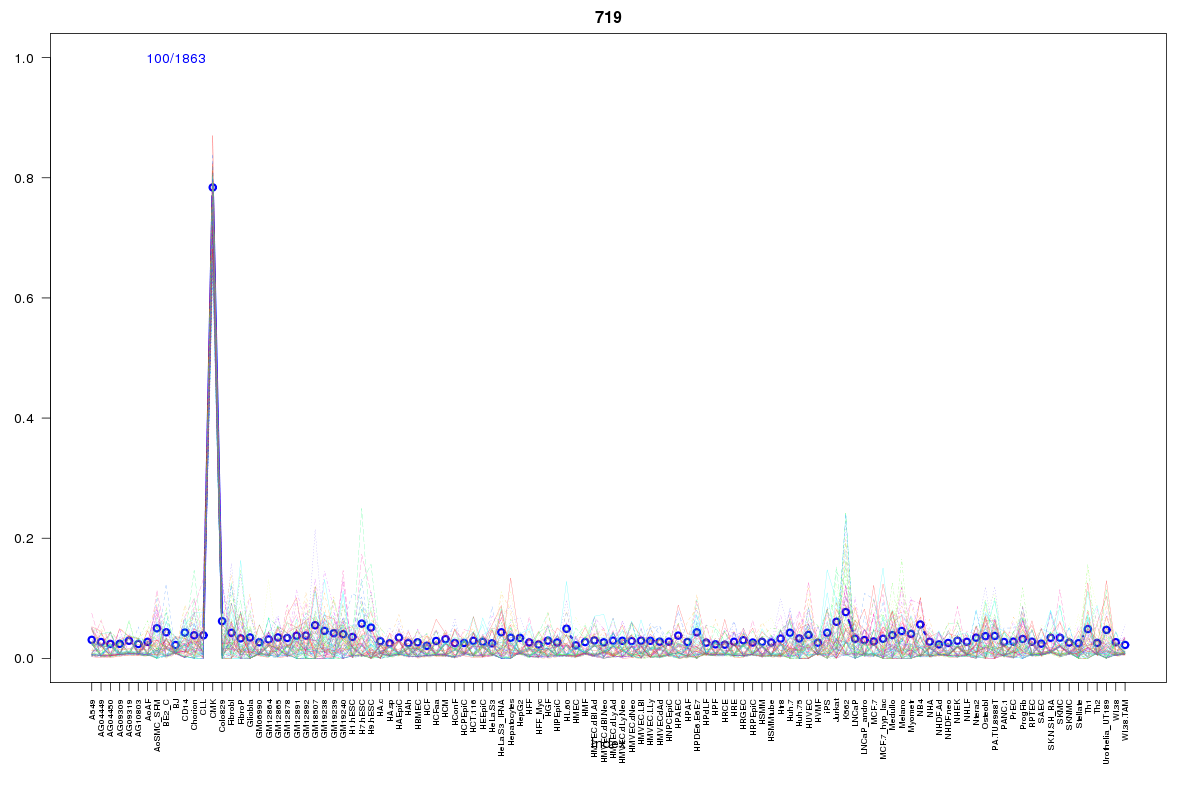 | 719 | 5 |
 | 770 | 2 |
 | 570 | 2 |
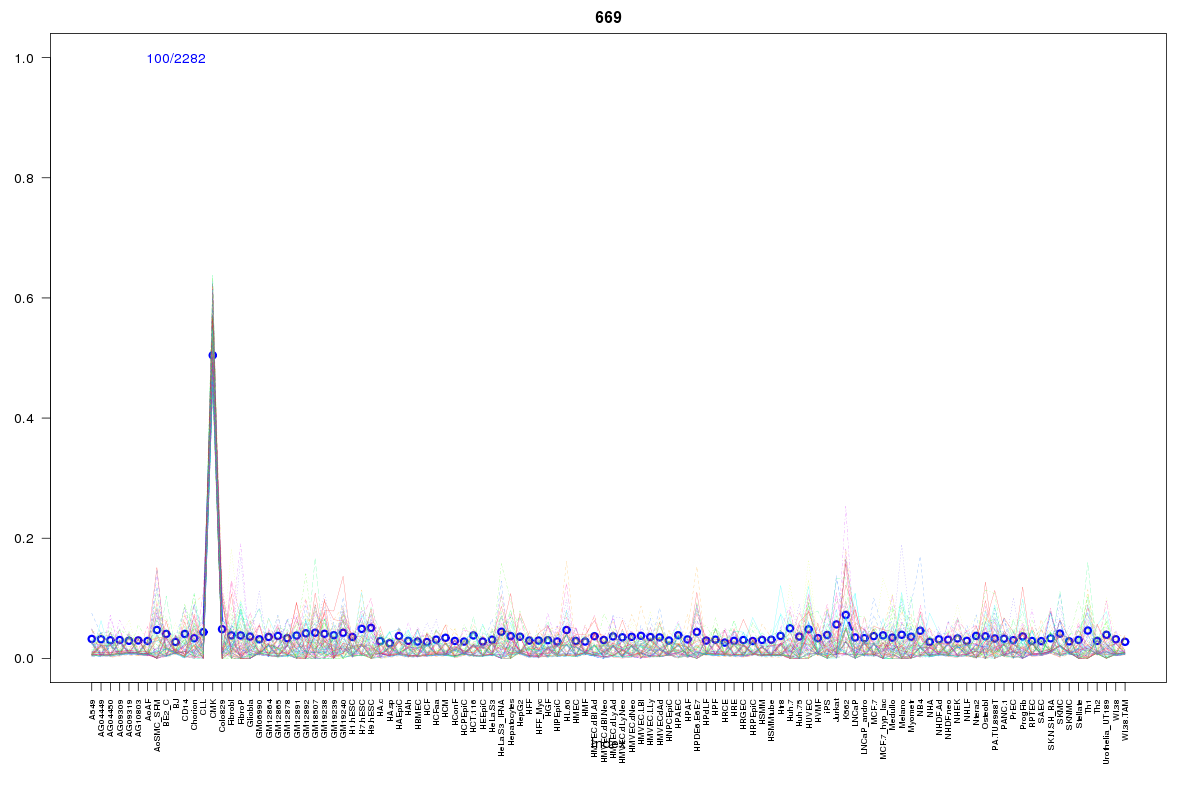 | 669 | 1 |
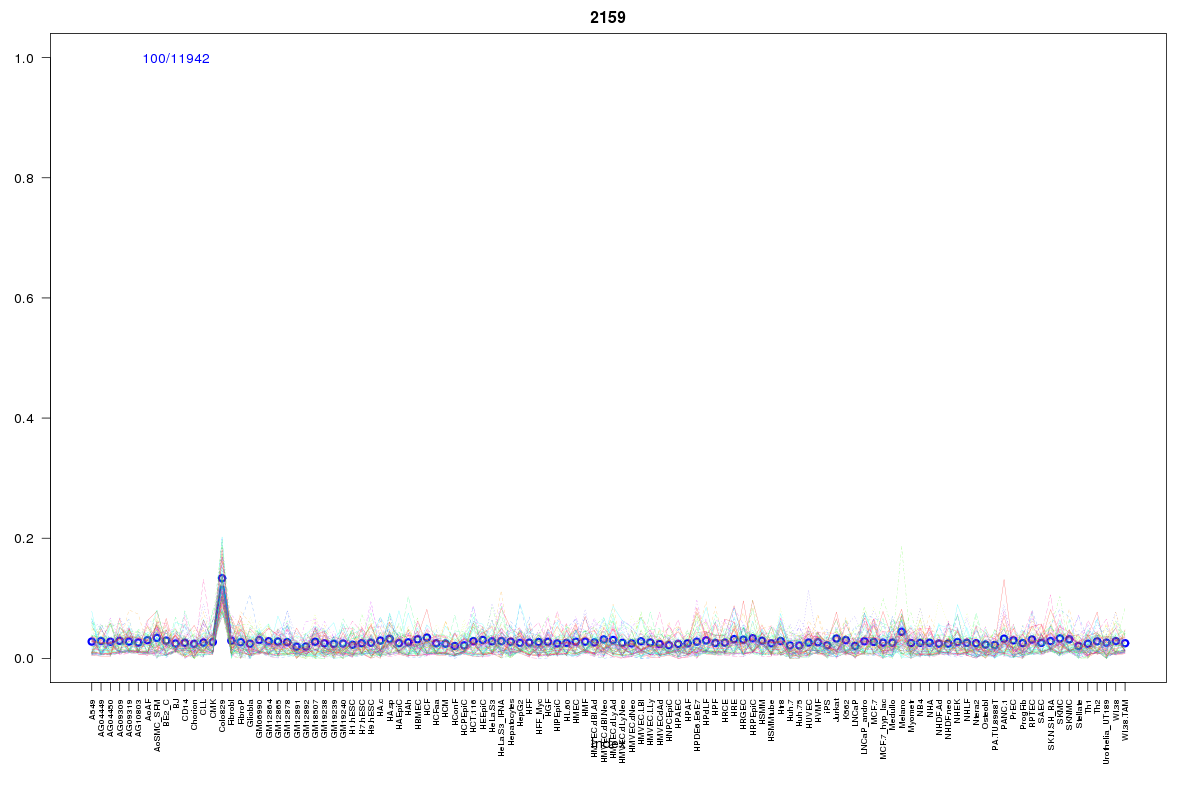 | 2159 | 1 |
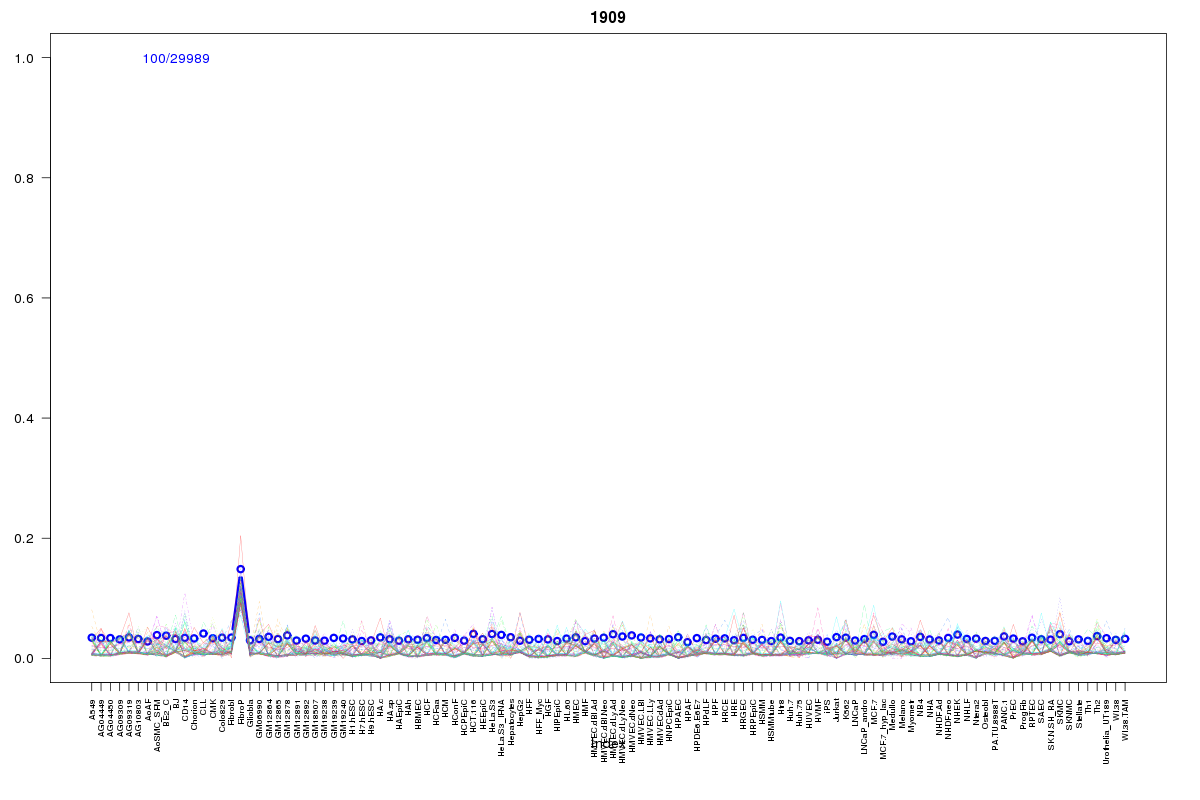 | 1909 | 1 |
 | 2114 | 1 |
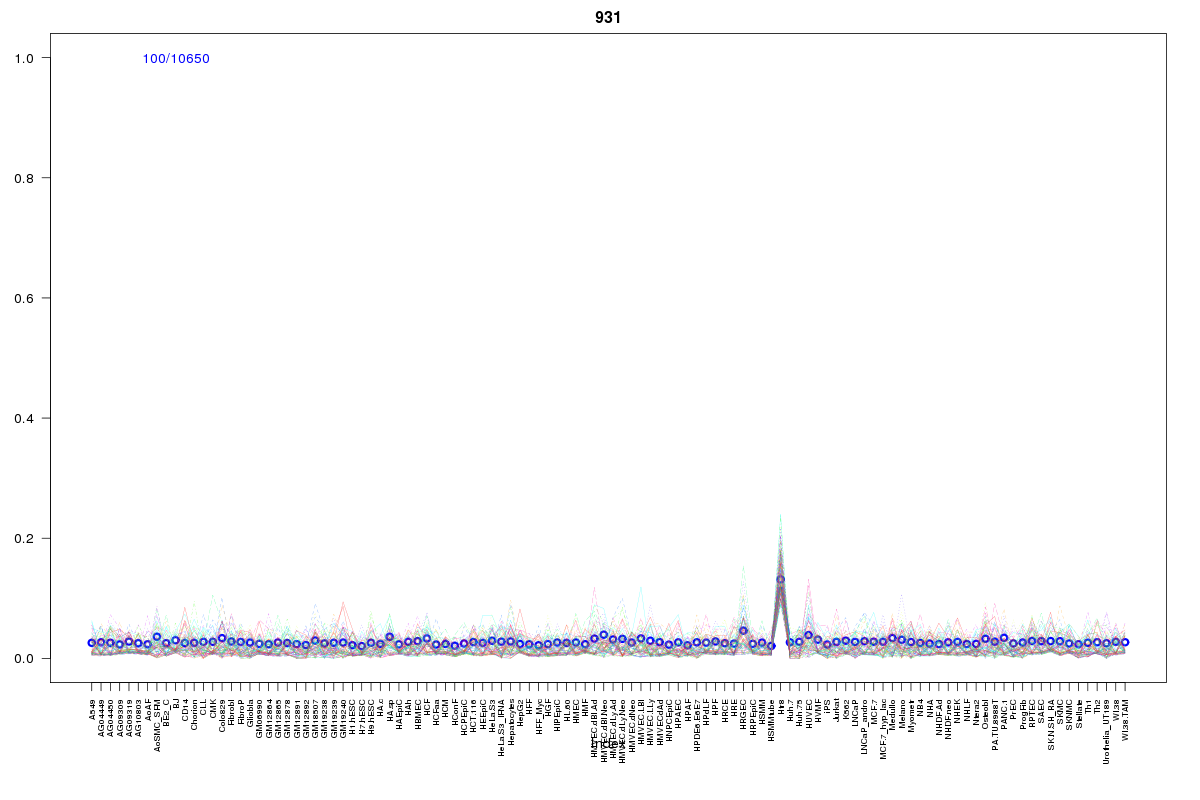 | 931 | 1 |
 | 430 | 1 |
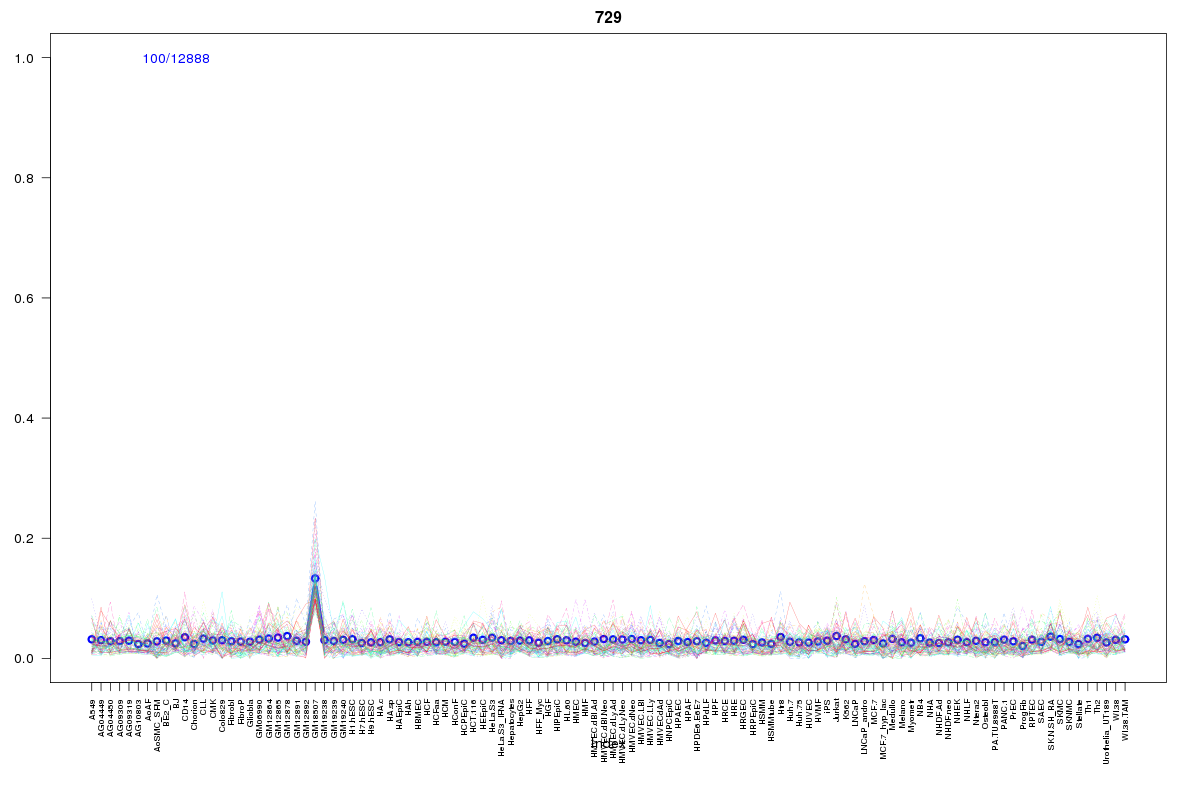 | 729 | 1 |
 | 1942 | 1 |
Resources
BED file downloads
Connects to 35 DHS sitesTop 10 Correlated DHS Sites
p-values indiciate significant higher or lower correlation| Location | Cluster | P-value |
|---|---|---|
| chr1:159272000-159272150 | 568 | 0 |
| chr1:159235520-159235670 | 568 | 0 |
| chr1:159273680-159273830 | 568 | 0.001 |
| chr1:159276440-159276590 | 568 | 0.001 |
| chr1:159179920-159180070 | 568 | 0.001 |
| chr1:159312660-159312810 | 568 | 0.001 |
| chr1:159284060-159284210 | 568 | 0.003 |
| chr1:159354200-159354350 | 568 | 0.003 |
| chr1:159322460-159322610 | 719 | 0.003 |
| chr1:159272500-159272650 | 568 | 0.003 |
| chr1:159322160-159322310 | 719 | 0.003 |
External Databases
UCSCEnsembl (ENSG00000179639)