Gene: TTC30B
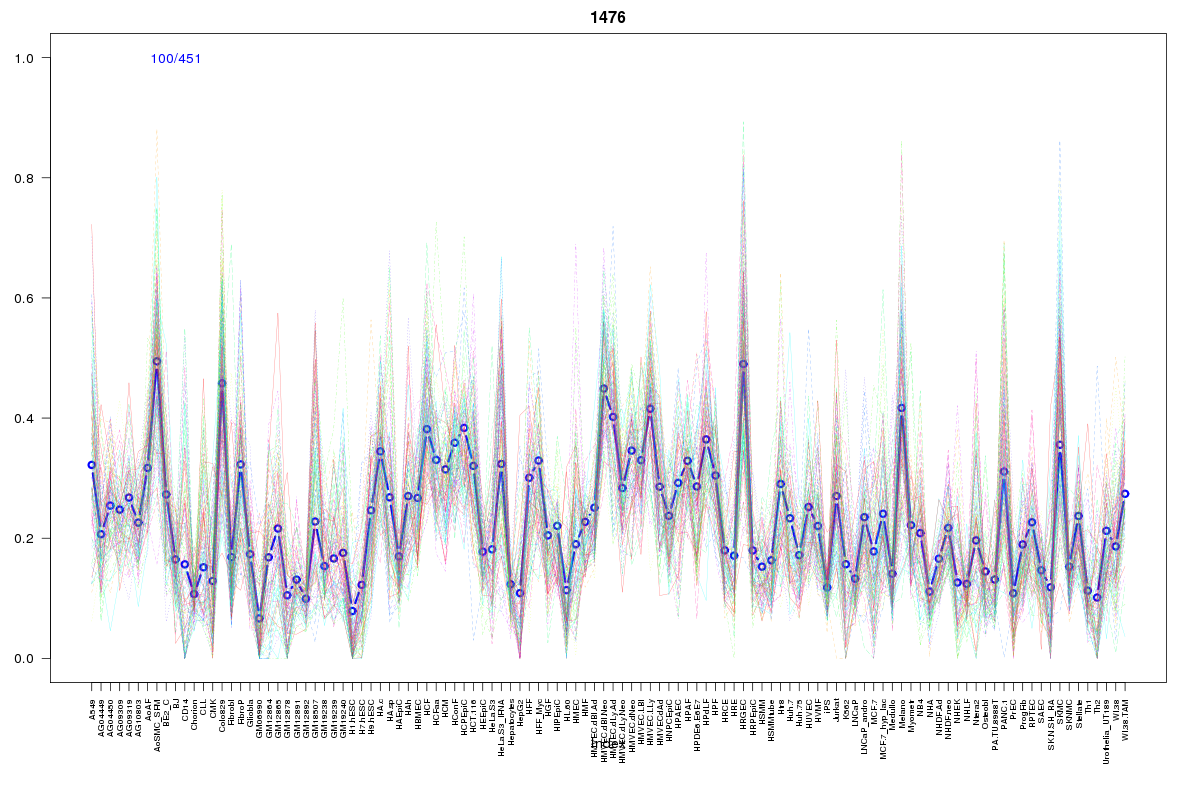
chr2: 178413725-178417742Expression Profile
(log scale)
Graphical Connections
Distribution of linked clusters:
You may find it interesting if many of the connected DHS sites belong to the same cluster.| Cluster Profile | Cluster ID | Number of DHS sites in this cluster |
|---|---|---|
 | 2110 | 4 |
 | 1605 | 2 |
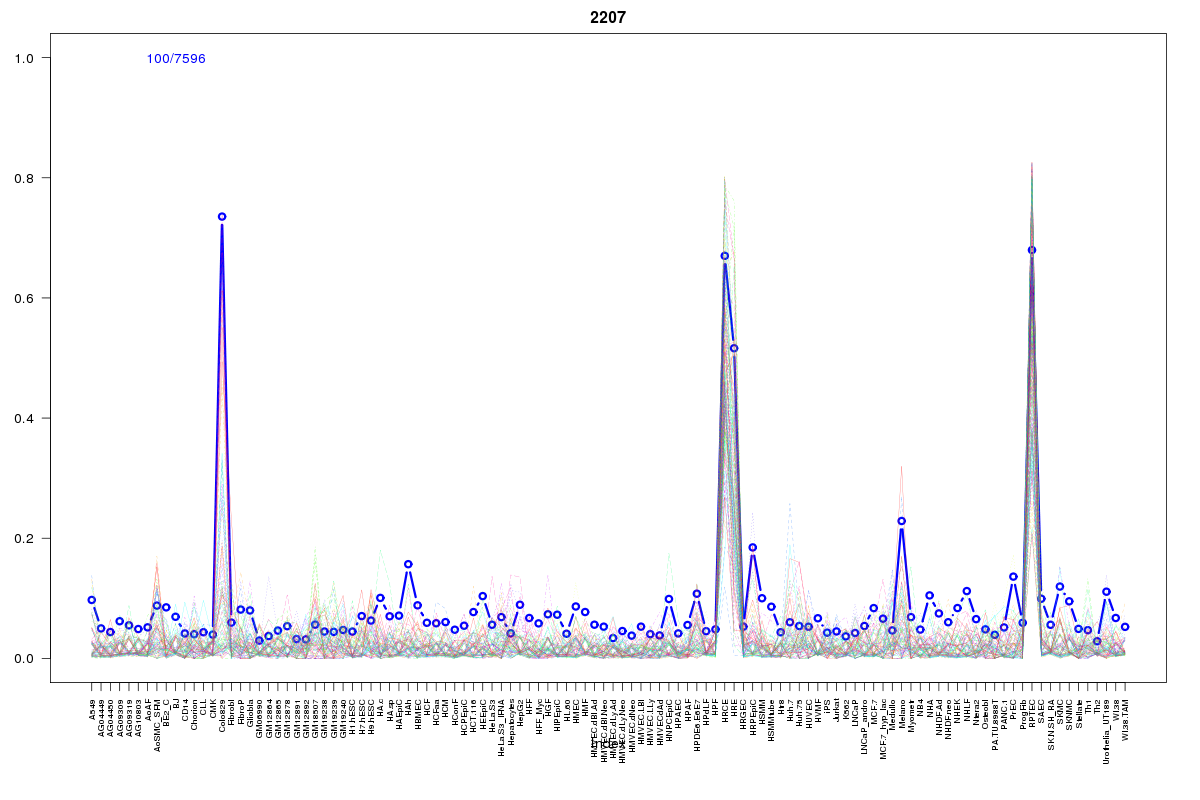 | 2207 | 2 |
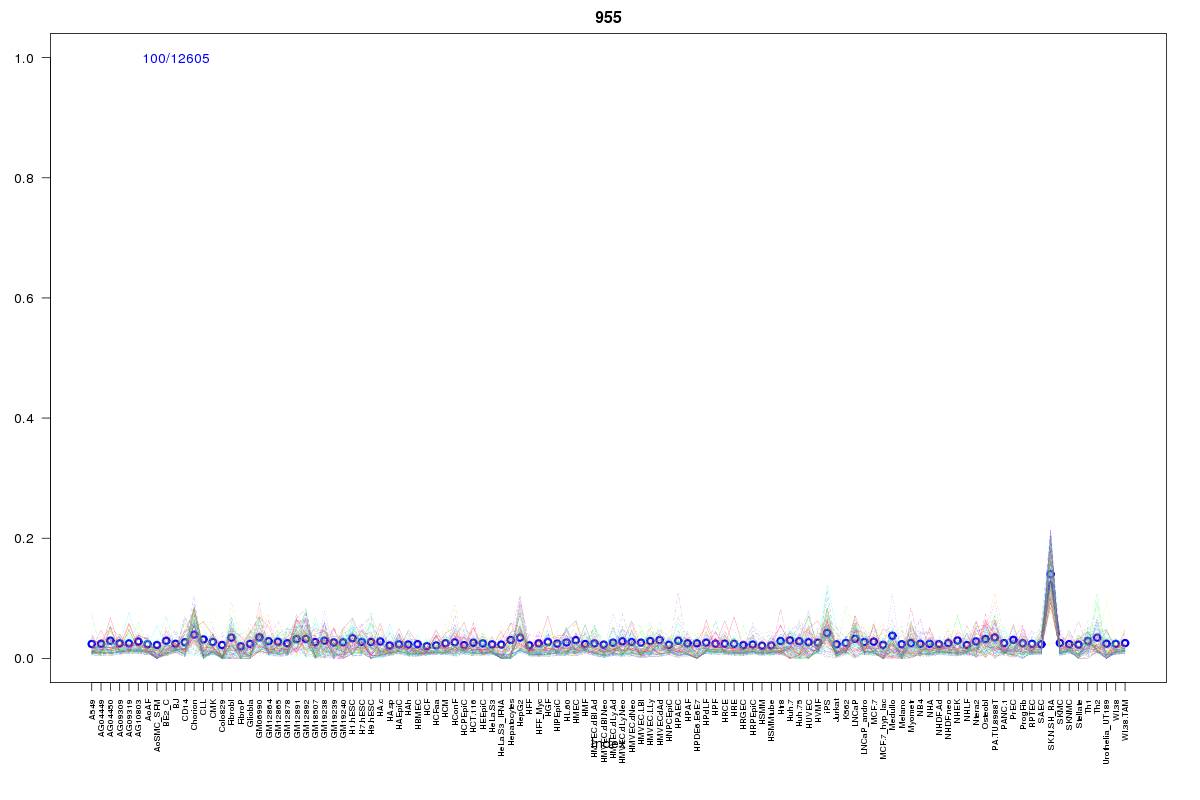 | 955 | 2 |
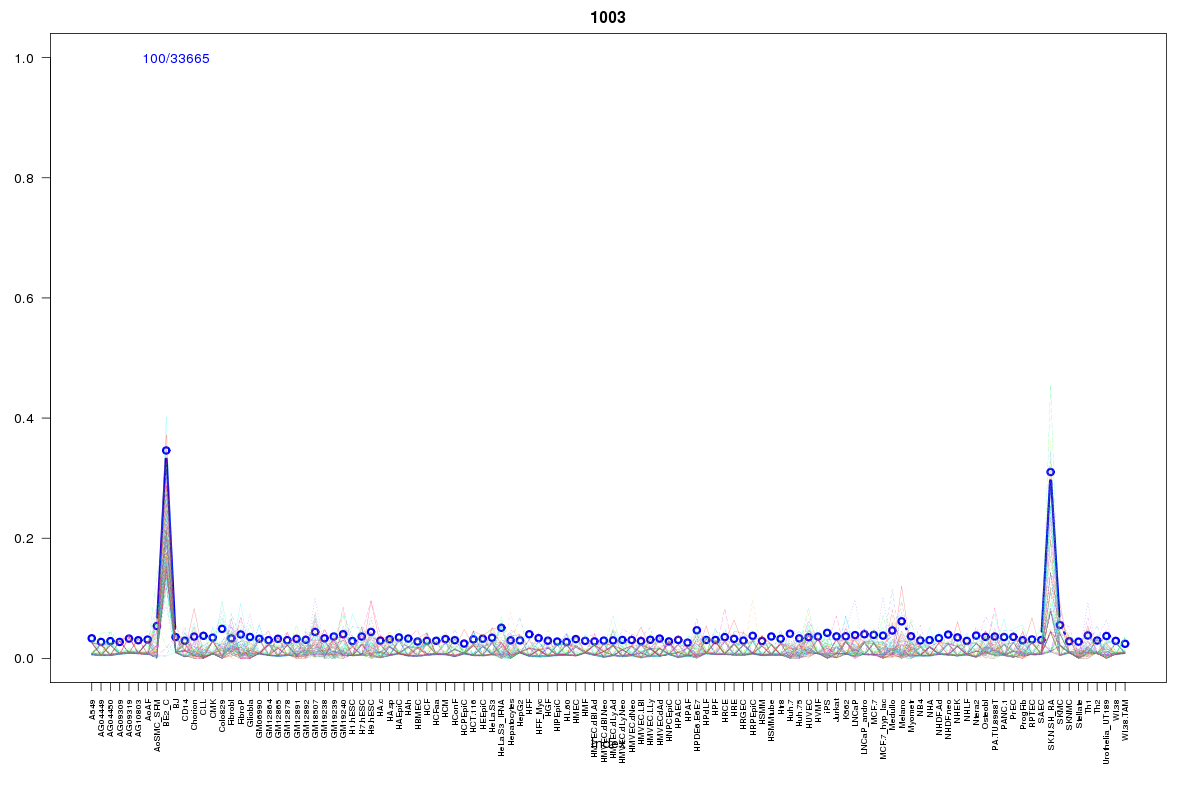 | 1003 | 1 |
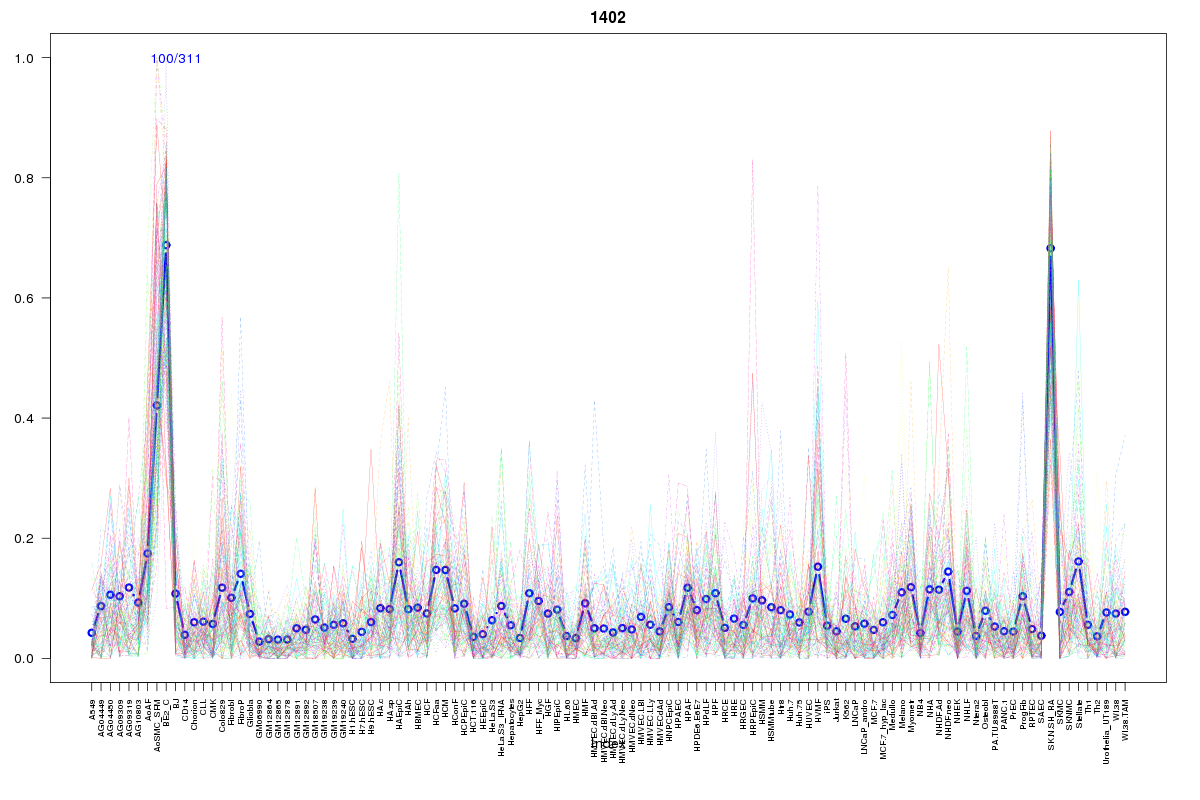 | 1402 | 1 |
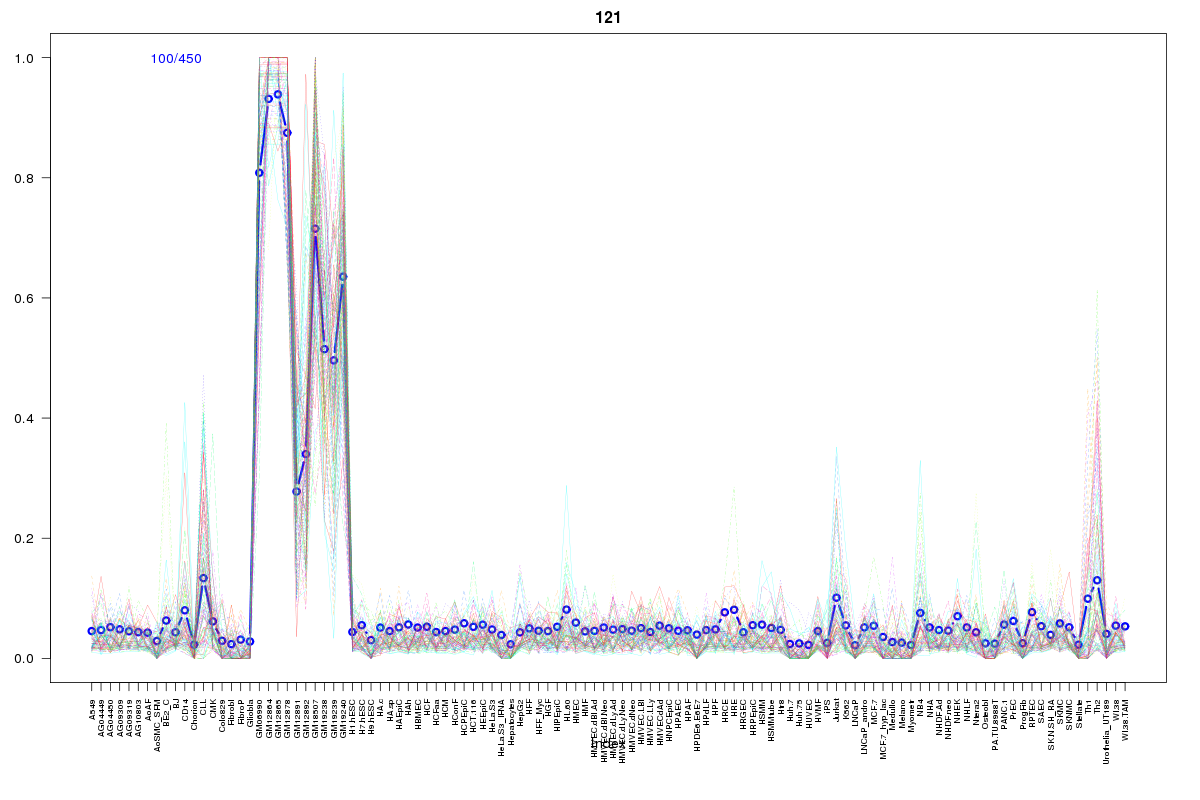 | 121 | 1 |
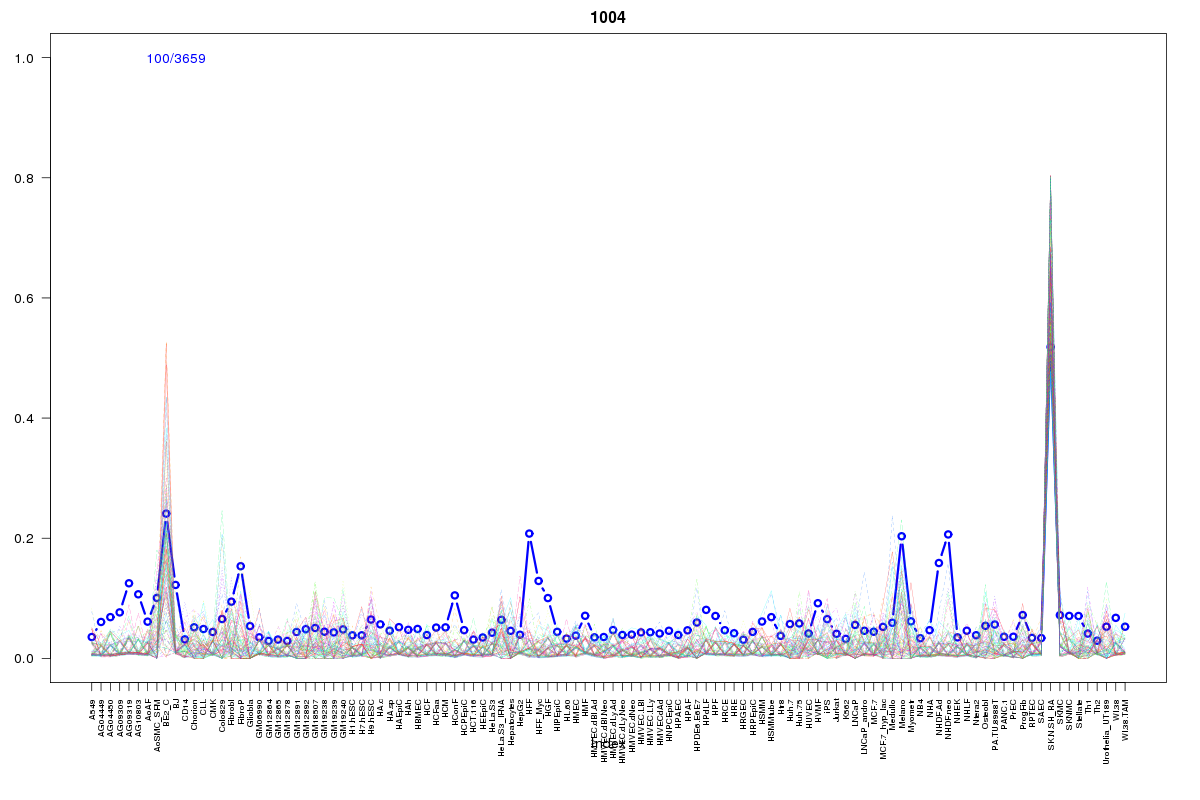 | 1004 | 1 |
 | 1942 | 1 |
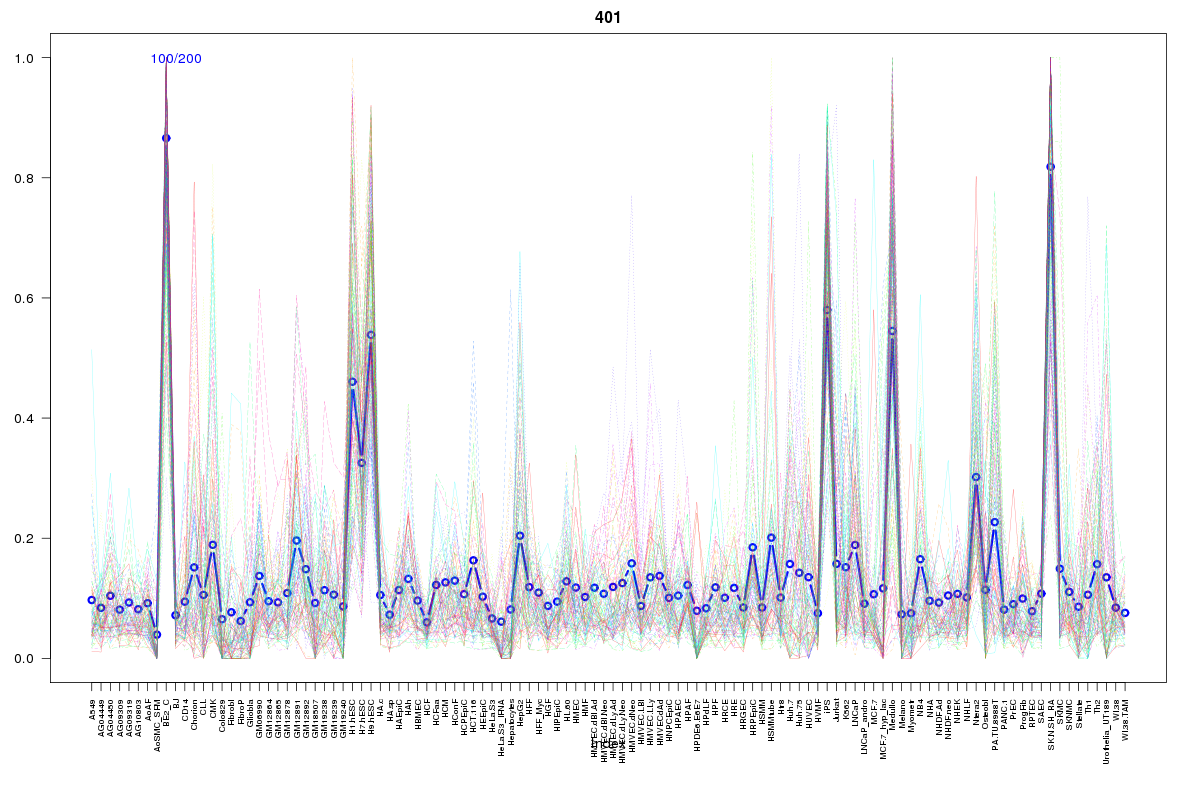 | 401 | 1 |
 | 2114 | 1 |
 | 862 | 1 |
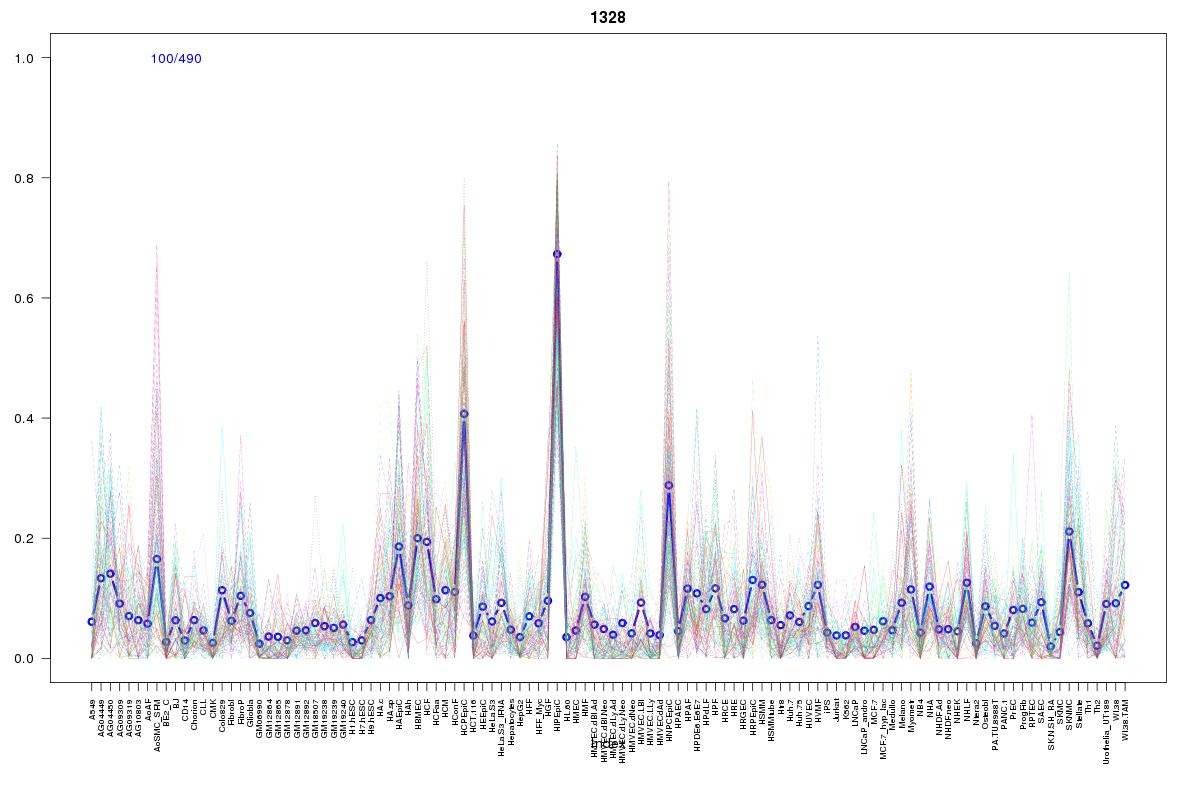 | 1328 | 1 |
 | 1476 | 1 |
Resources
BED file downloads
Connects to 20 DHS sitesTop 10 Correlated DHS Sites
p-values indiciate significant higher or lower correlation| Location | Cluster | P-value |
|---|---|---|
| chr2:178395360-178395510 | 1402 | 0 |
| chr2:178437960-178438110 | 2207 | 0.002 |
| chr2:178491140-178491290 | 2114 | 0.005 |
| chr2:178498040-178498190 | 2110 | 0.005 |
| chr2:178413940-178414090 | 1004 | 0.005 |
| chr2:178497880-178498030 | 1605 | 0.006 |
| chr2:178354580-178354730 | 1476 | 0.006 |
| chr2:178452385-178452535 | 955 | 0.007 |
| chr2:178414580-178414730 | 1942 | 0.007 |
| chr2:178500380-178500530 | 2110 | 0.008 |
| chr2:178454040-178454190 | 2207 | 0.008 |
External Databases
UCSCEnsembl (ENSG00000196659)