Gene: Y_RNA
chr20: 32971970-32972071Expression Profile
(log scale)
Graphical Connections
Distribution of linked clusters:
You may find it interesting if many of the connected DHS sites belong to the same cluster.| Cluster Profile | Cluster ID | Number of DHS sites in this cluster |
|---|---|---|
 | 416 | 4 |
 | 2055 | 2 |
 | 10 | 2 |
 | 15 | 2 |
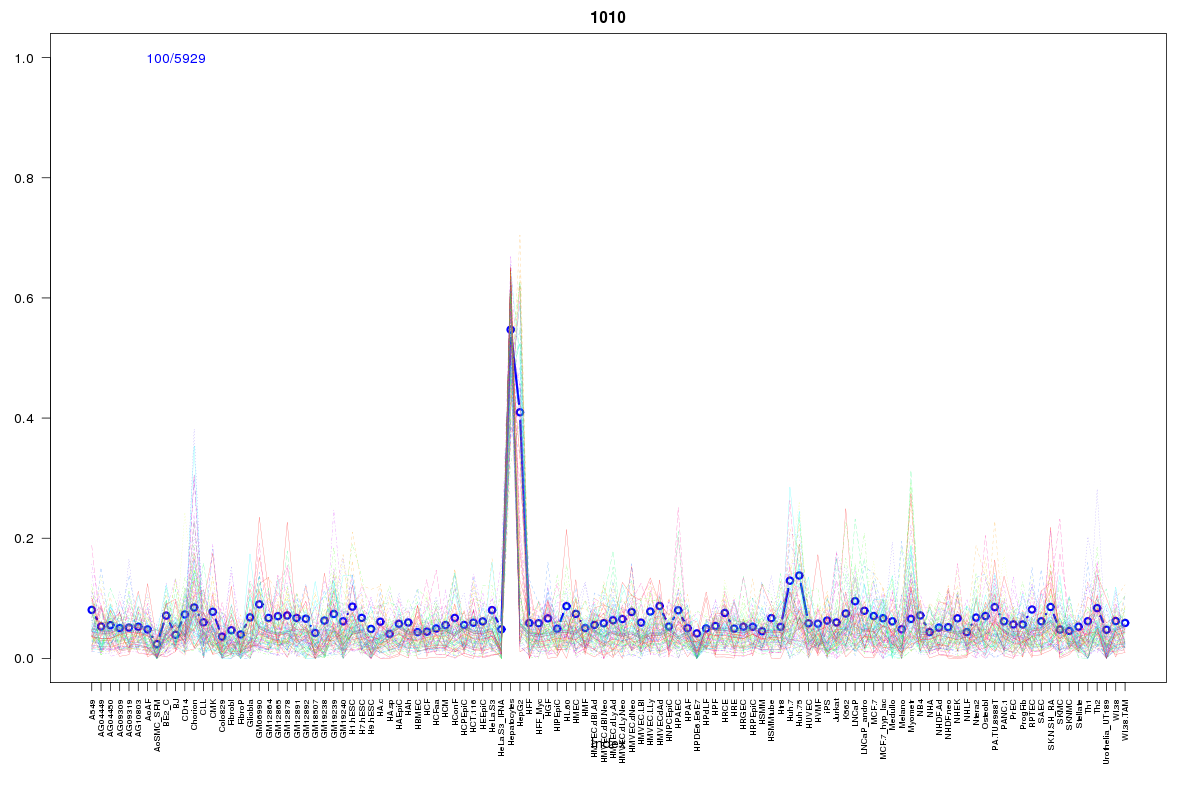 | 1010 | 1 |
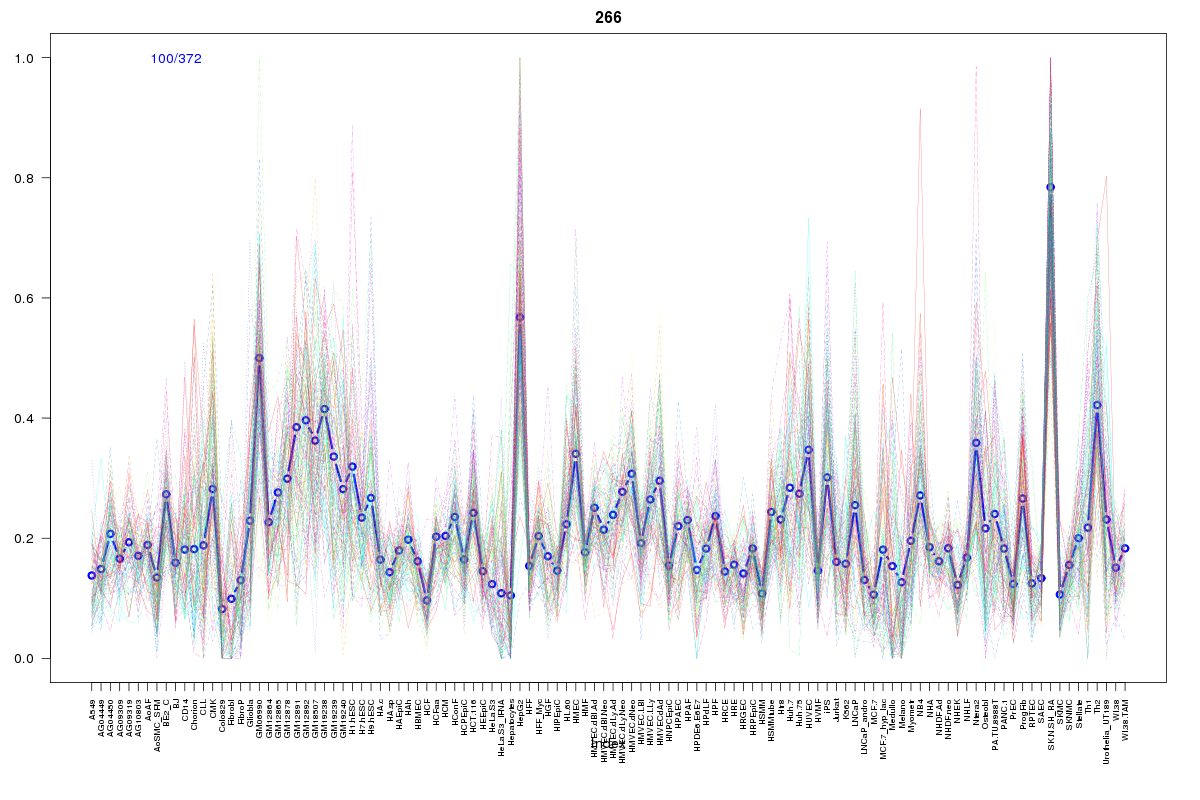 | 266 | 1 |
 | 860 | 1 |
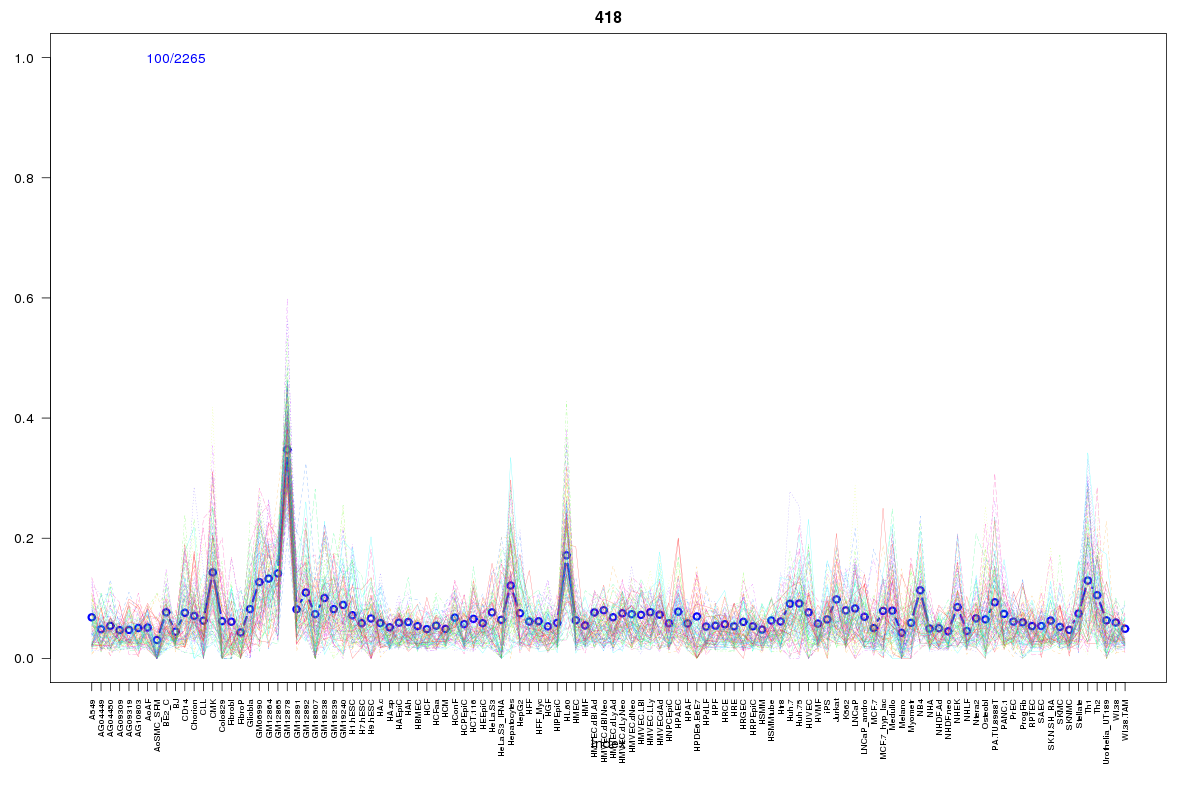 | 418 | 1 |
 | 1605 | 1 |
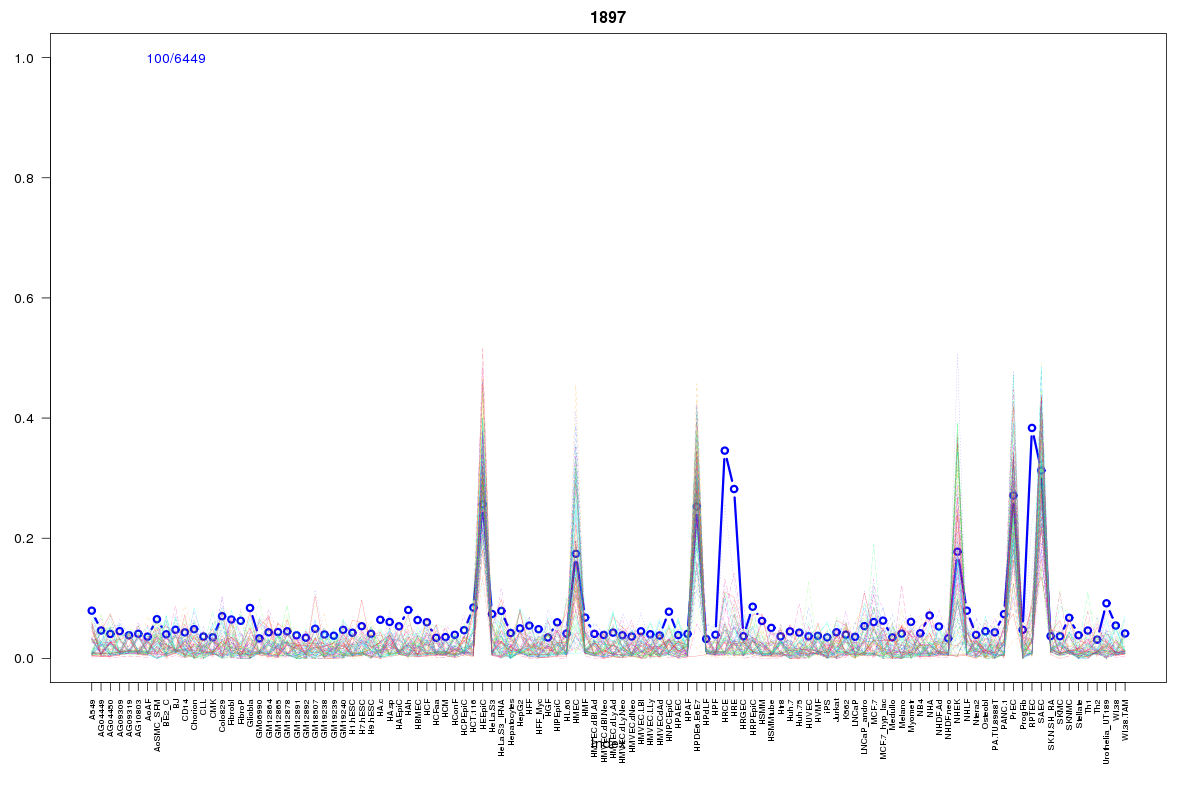 | 1897 | 1 |
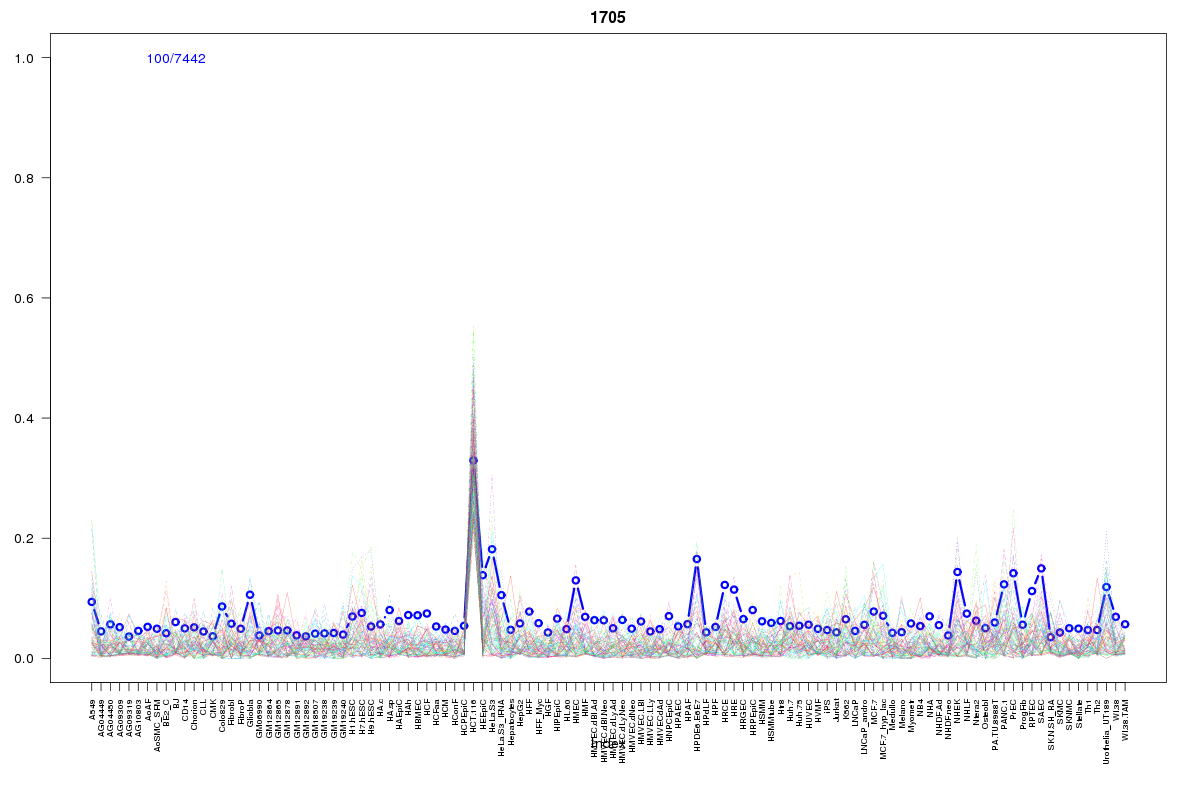 | 1705 | 1 |
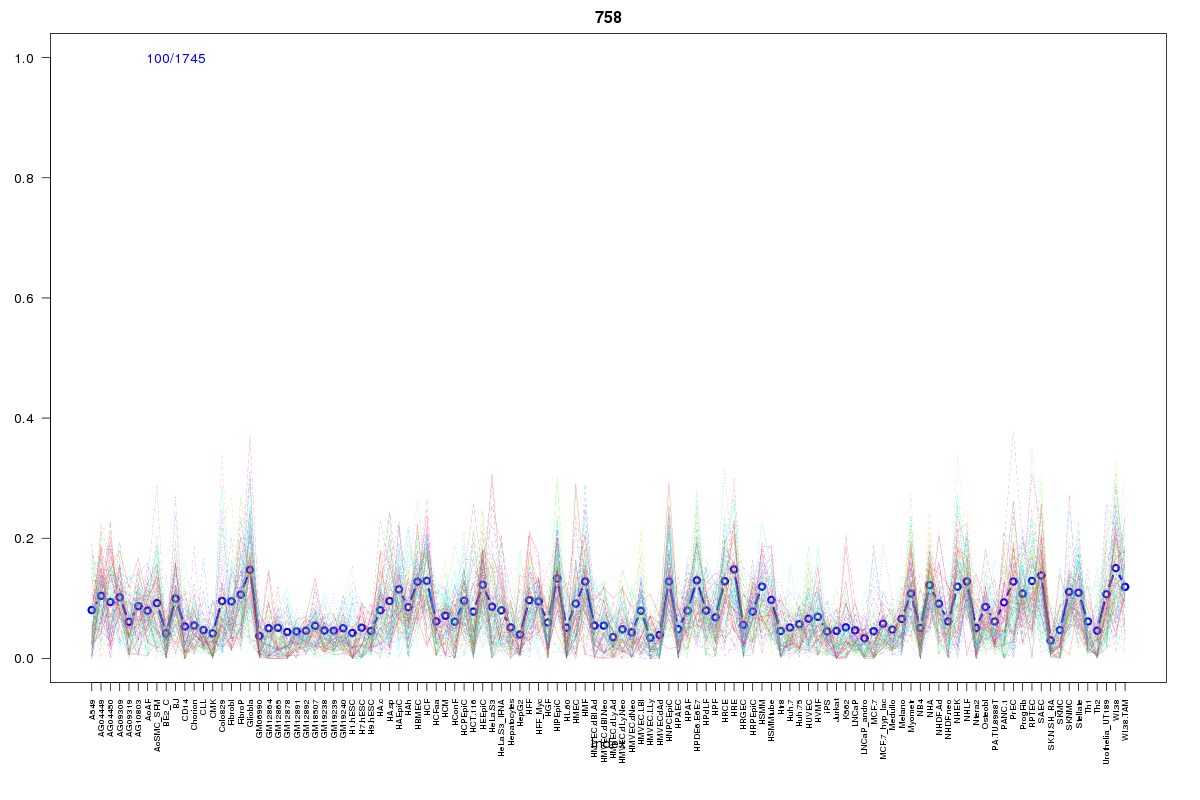 | 758 | 1 |
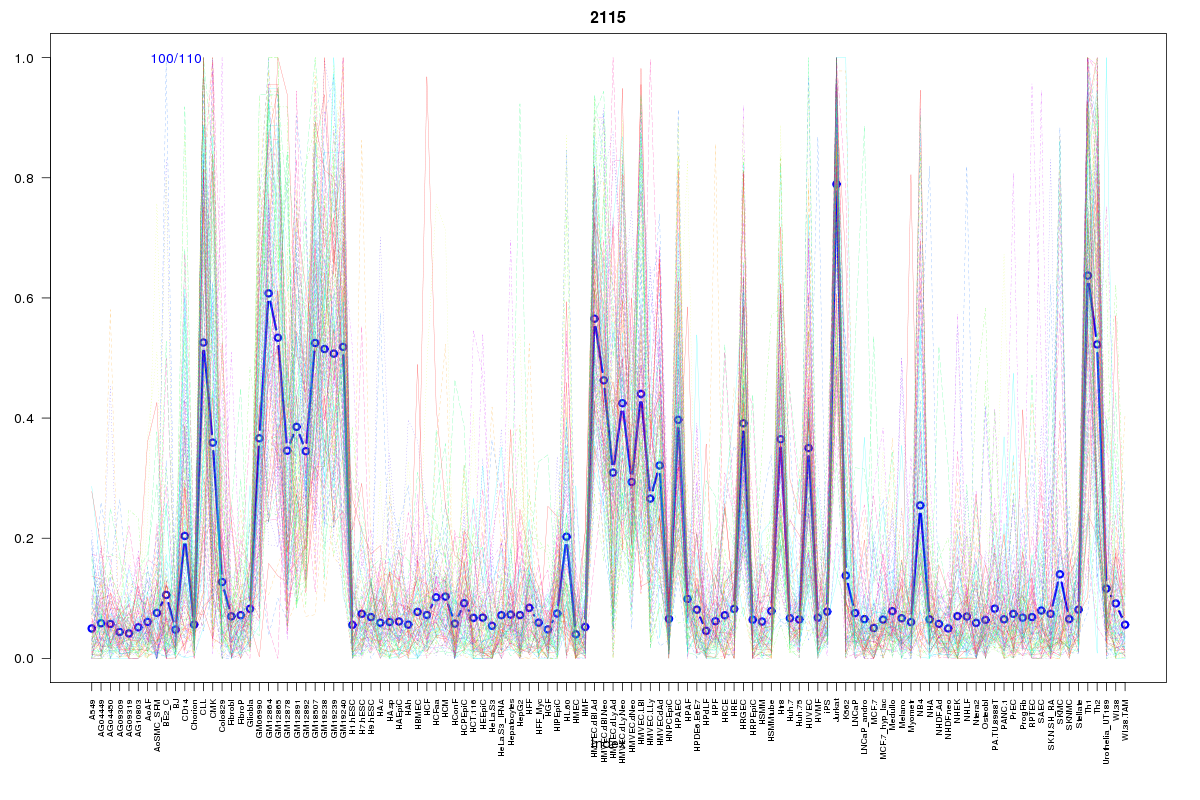 | 2115 | 1 |
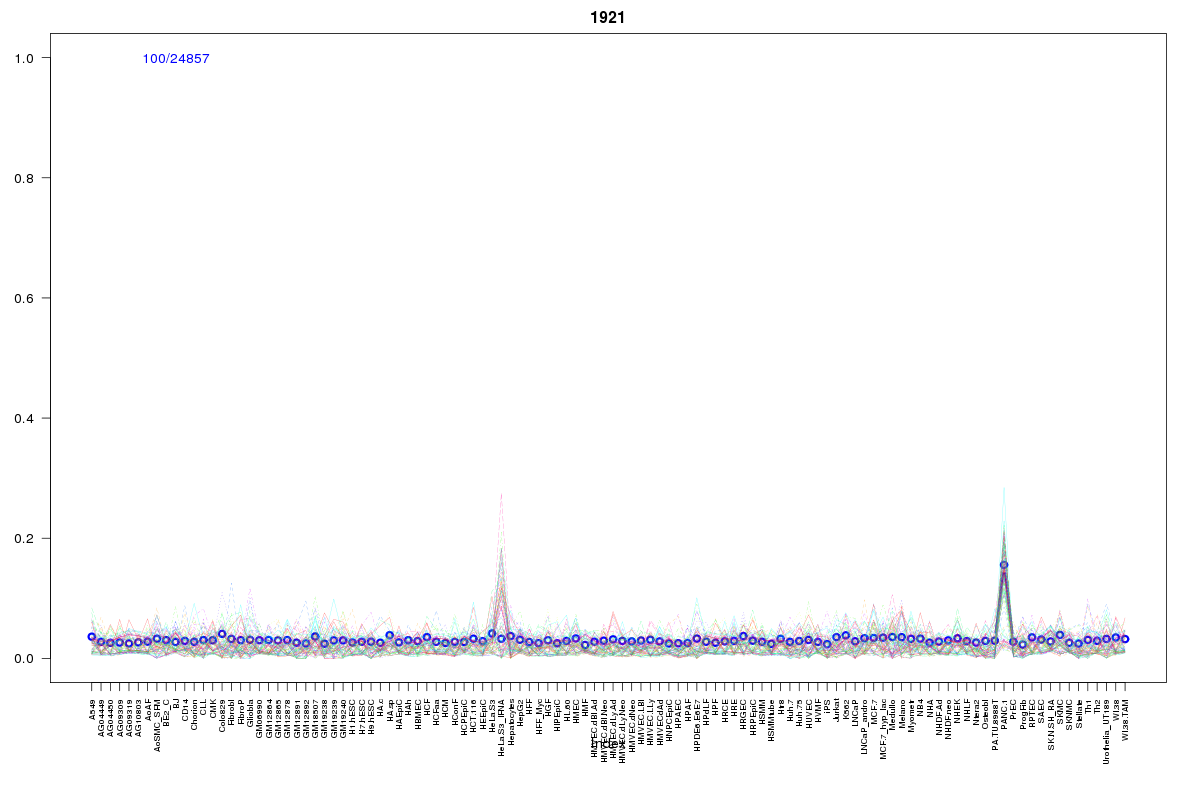 | 1921 | 1 |
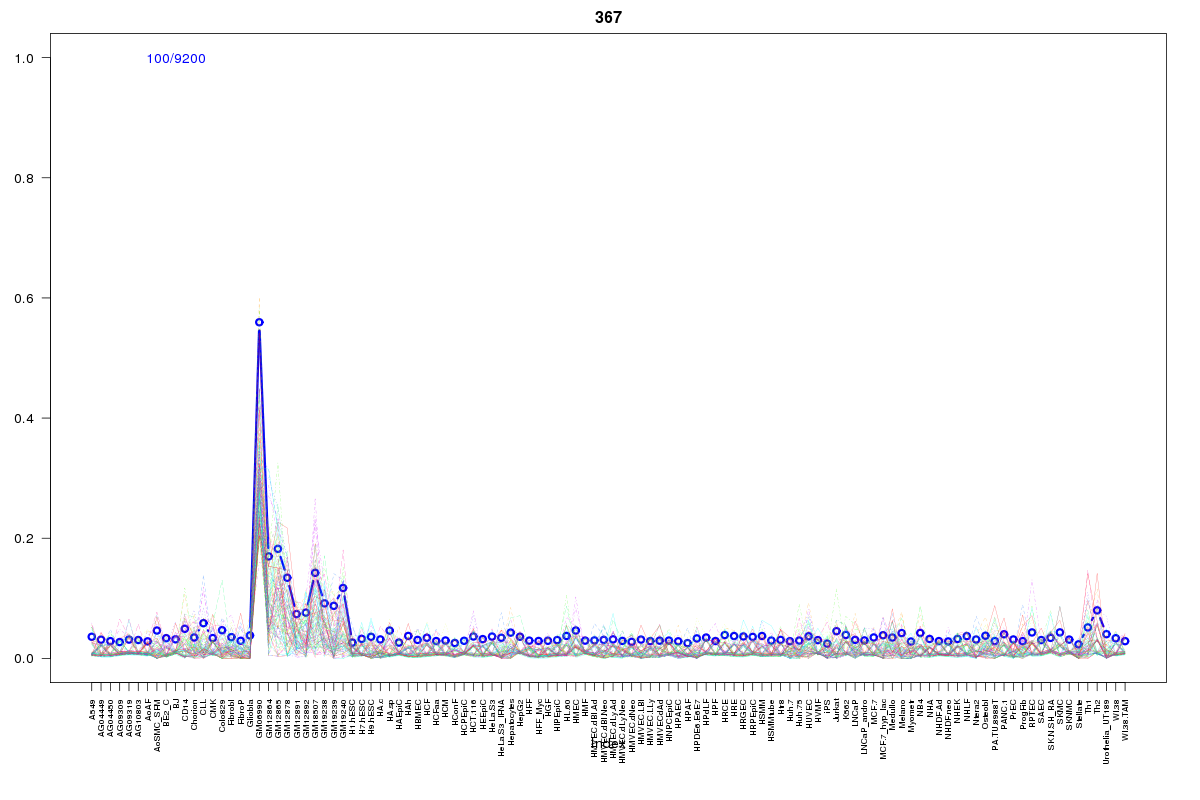 | 367 | 1 |
 | 994 | 1 |
Resources
BED file downloads
Connects to 22 DHS sitesTop 10 Correlated DHS Sites
p-values indiciate significant higher or lower correlation| Location | Cluster | P-value |
|---|---|---|
| chr20:32873185-32873335 | 2055 | 0 |
| chr20:33059305-33059455 | 416 | 0 |
| chr20:32925325-32925475 | 15 | 0 |
| chr20:32943925-32944075 | 15 | 0.001 |
| chr20:32988165-32988315 | 416 | 0.002 |
| chr20:32875865-32876015 | 2055 | 0.005 |
| chr20:32904905-32905055 | 416 | 0.007 |
| chr20:32943545-32943695 | 416 | 0.014 |
| chr20:32909580-32909730 | 10 | 0.015 |
| chr20:32978040-32978190 | 758 | 0.015 |
| chr20:32896740-32896890 | 10 | 0.015 |
External Databases
UCSCEnsembl (ENSG00000201498)