Gene: ACTBP12
chr1: 92694137-92694992Expression Profile
(log scale)
Graphical Connections
Distribution of linked clusters:
You may find it interesting if many of the connected DHS sites belong to the same cluster.| Cluster Profile | Cluster ID | Number of DHS sites in this cluster |
|---|---|---|
 | 2072 | 5 |
 | 934 | 1 |
 | 1942 | 1 |
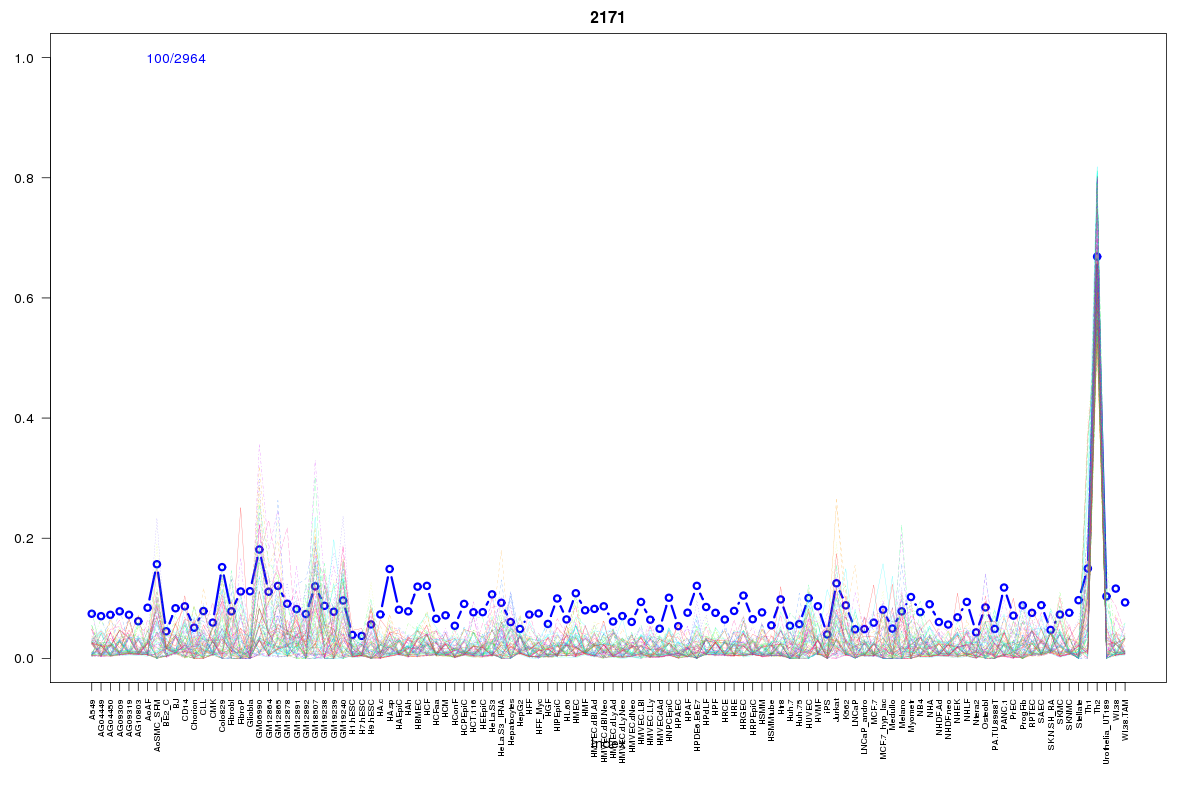 | 2171 | 1 |
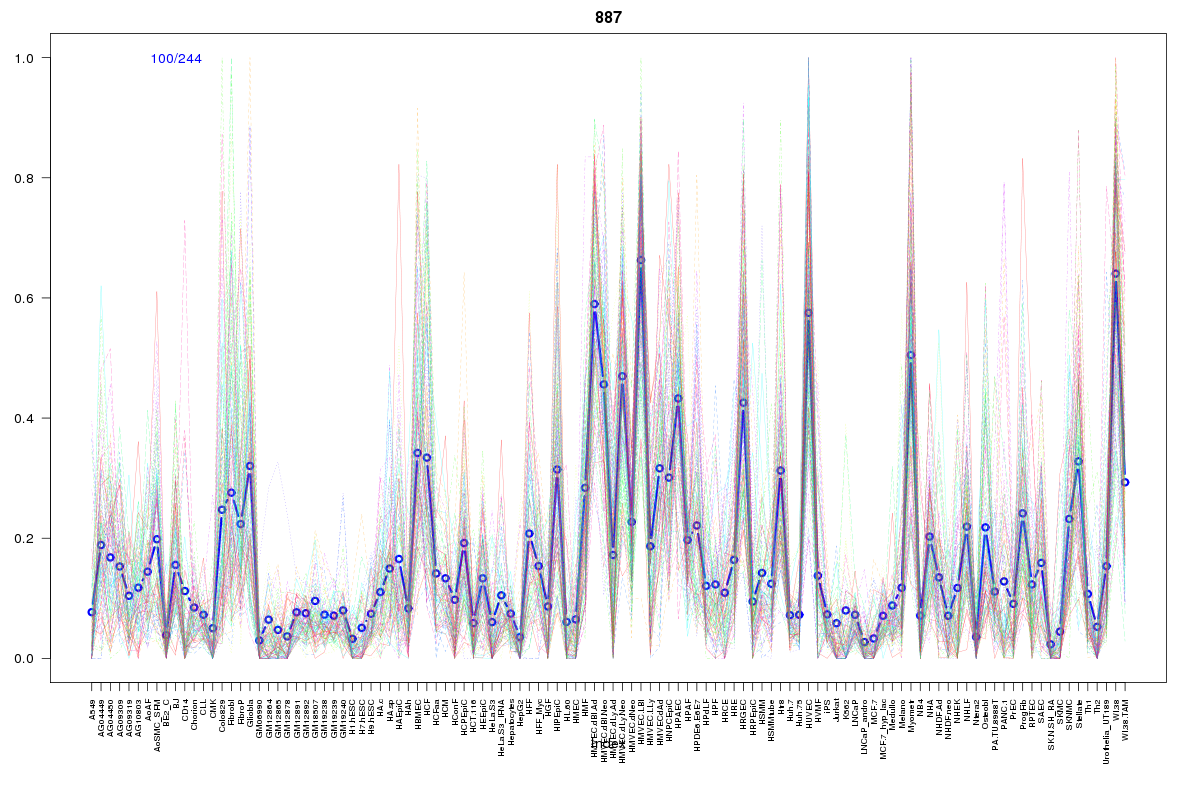 | 887 | 1 |
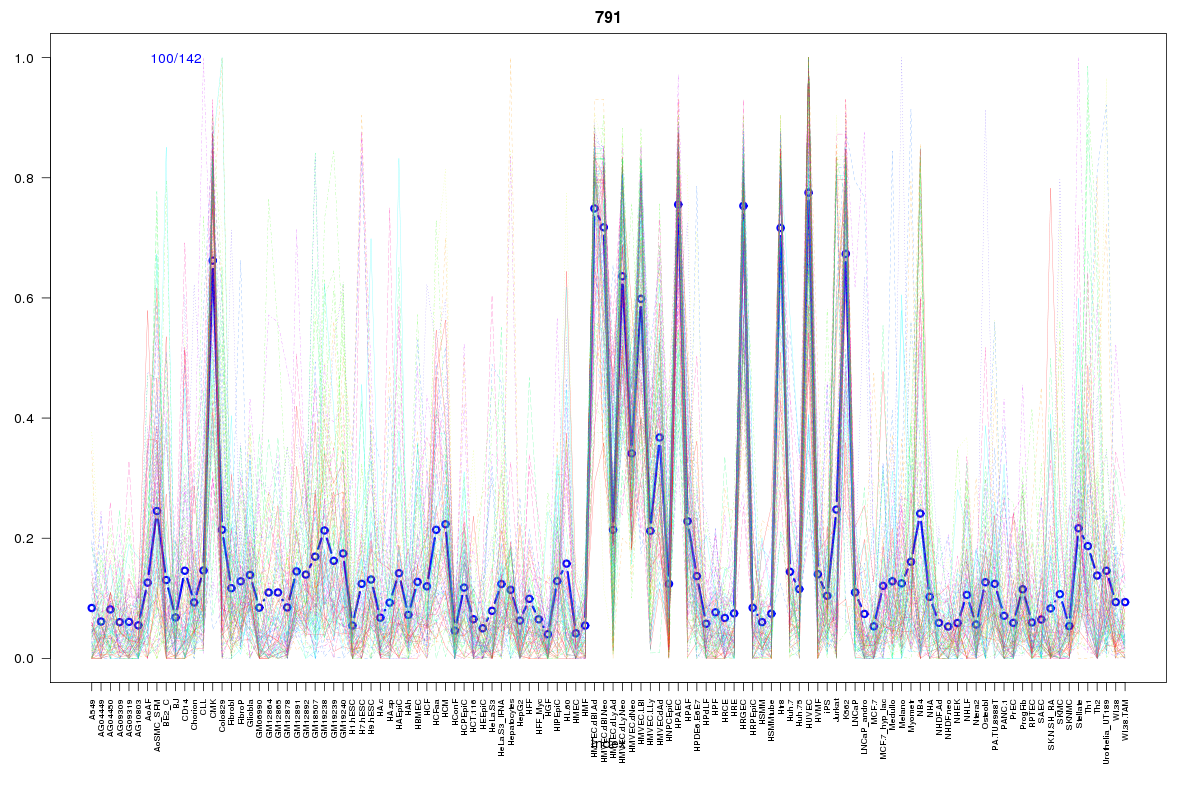 | 791 | 1 |
Resources
BED file downloads
Connects to 10 DHS sitesTop 10 Correlated DHS Sites
p-values indiciate significant higher or lower correlation| Location | Cluster | P-value |
|---|---|---|
| chr1:92783740-92783890 | 934 | 0.004 |
| chr1:92742780-92742930 | 887 | 0.004 |
| chr1:92781740-92781890 | 2072 | 0.005 |
| chr1:92601960-92602110 | 1942 | 0.007 |
| chr1:92781305-92781455 | 2072 | 0.012 |
| chr1:92668700-92668850 | 2072 | 0.012 |
| chr1:92789180-92789330 | 2072 | 0.012 |
| chr1:92662600-92662750 | 2171 | 0.013 |
| chr1:92779560-92779830 | 2072 | 0.02 |
| chr1:92783520-92783670 | 791 | 0.023 |
External Databases
UCSCEnsembl (ENSG00000233125)