Gene: TATDN2P3
chr13: 23817658-23821323Expression Profile
(log scale)
Graphical Connections
Distribution of linked clusters:
You may find it interesting if many of the connected DHS sites belong to the same cluster.| Cluster Profile | Cluster ID | Number of DHS sites in this cluster |
|---|---|---|
 | 1721 | 4 |
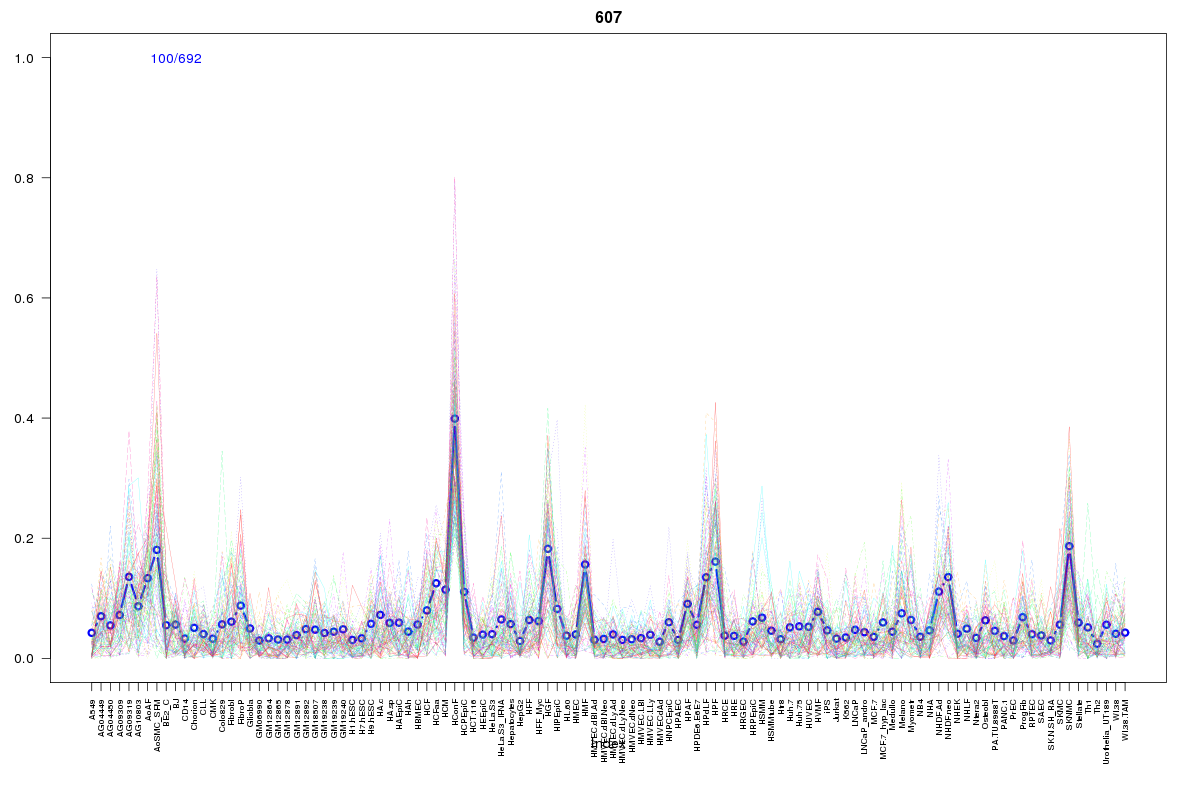 | 607 | 2 |
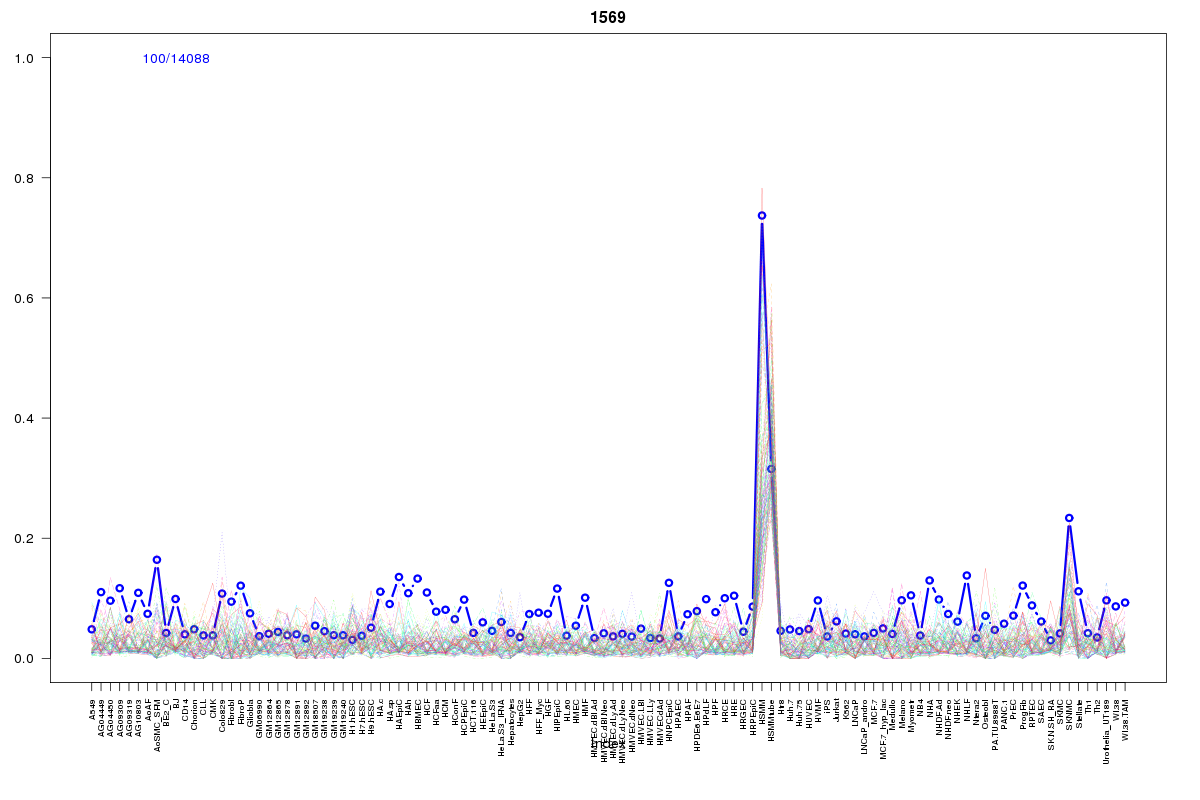 | 1569 | 2 |
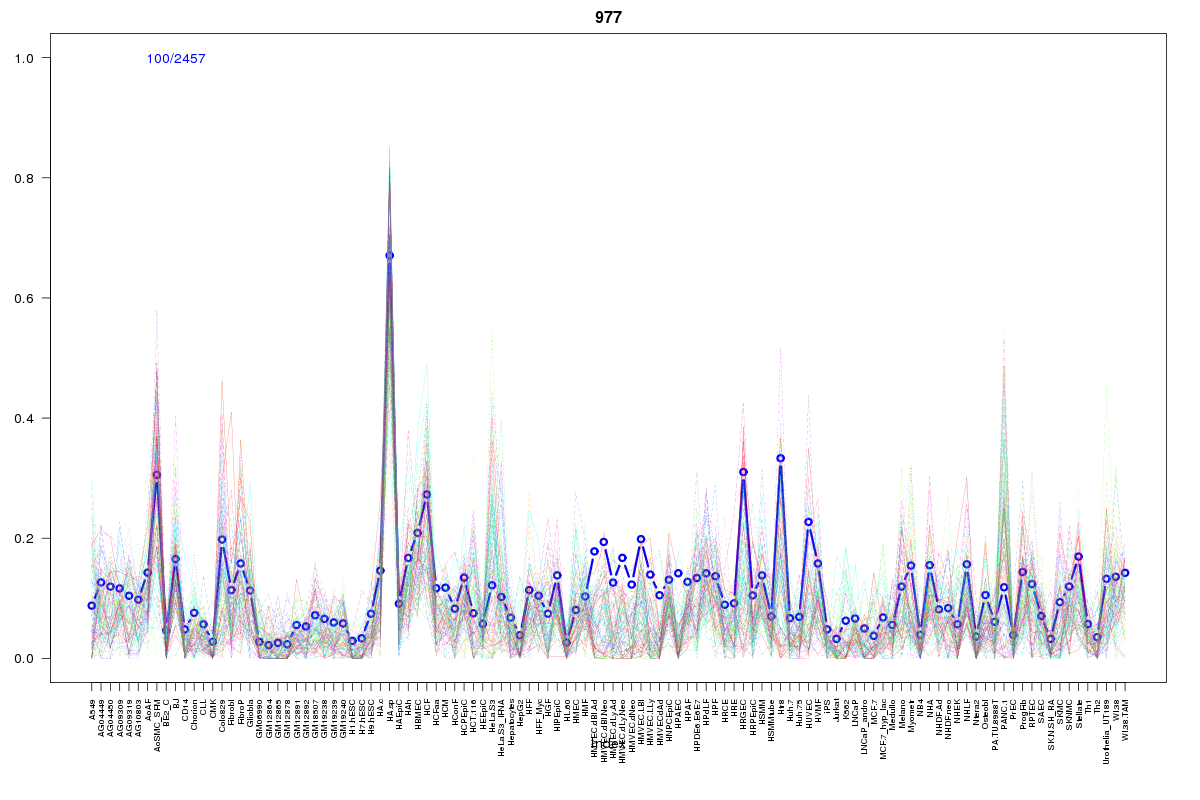 | 977 | 1 |
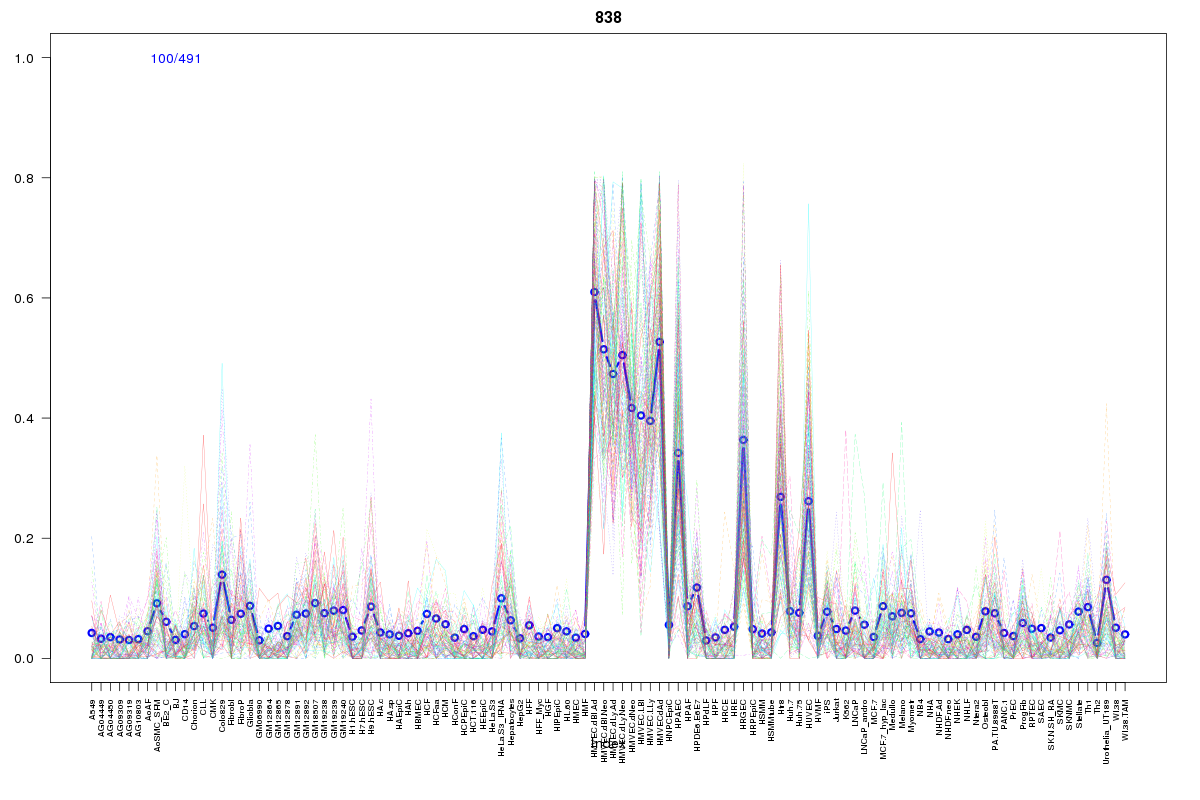 | 838 | 1 |
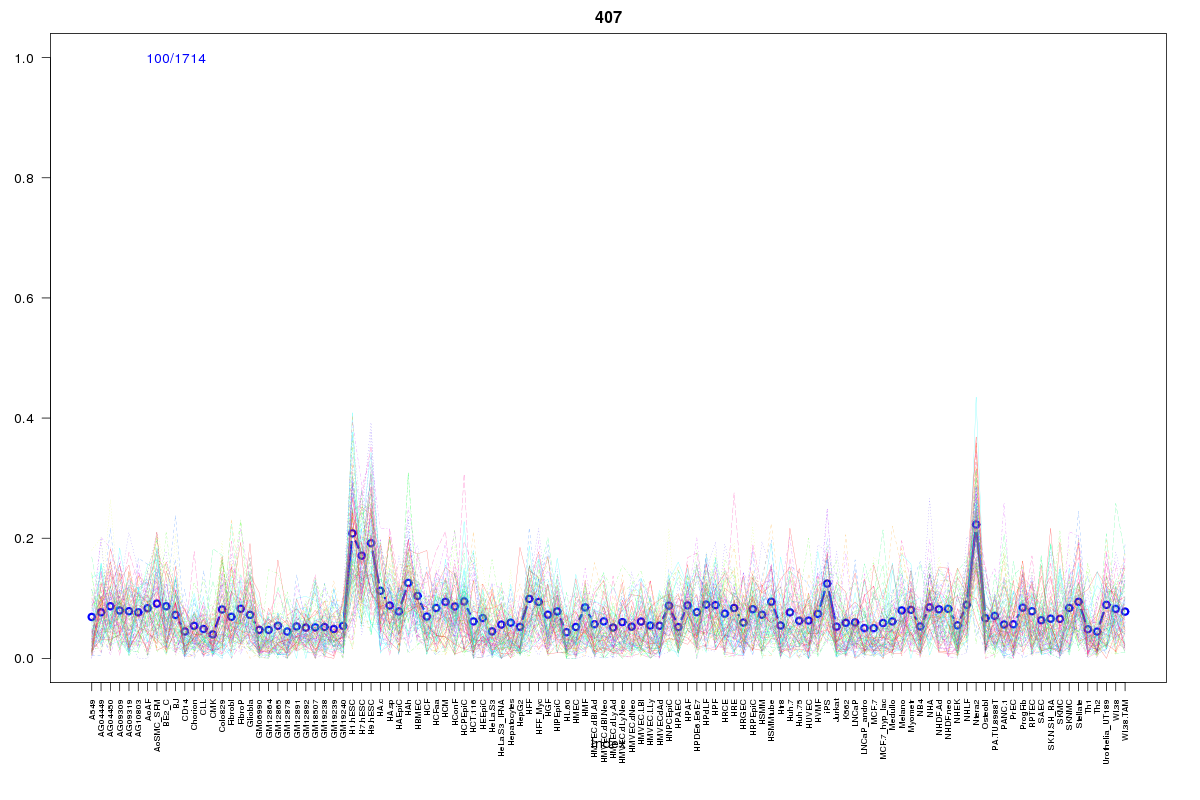 | 407 | 1 |
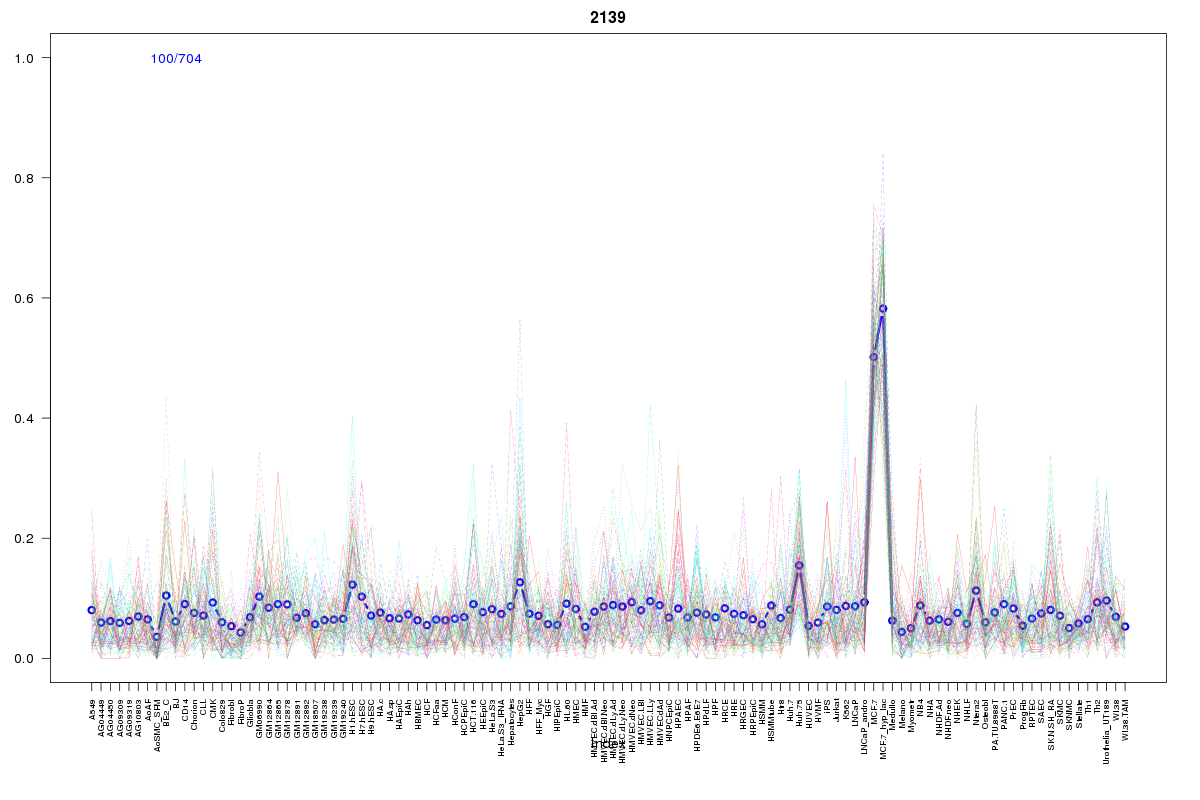 | 2139 | 1 |
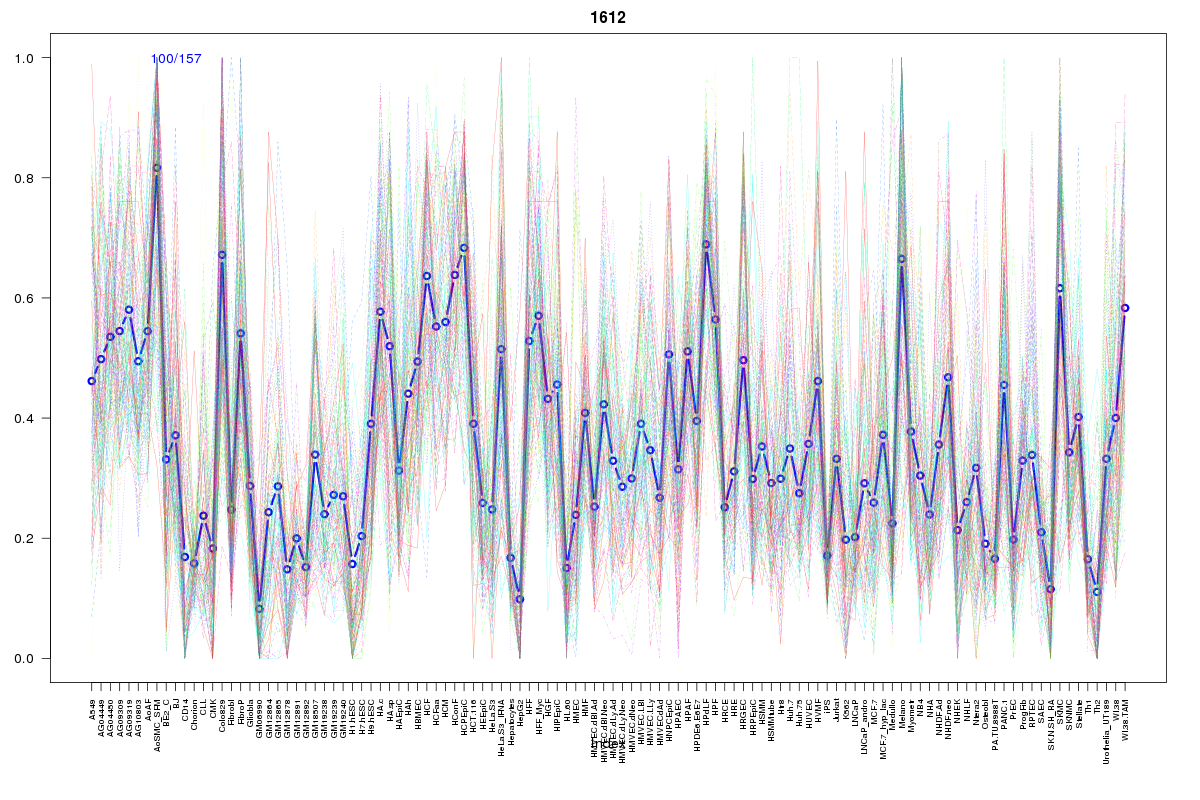 | 1612 | 1 |
Resources
BED file downloads
Connects to 13 DHS sitesTop 10 Correlated DHS Sites
p-values indiciate significant higher or lower correlation| Location | Cluster | P-value |
|---|---|---|
| chr13:23912560-23912710 | 1721 | 0.001 |
| chr13:23756400-23756550 | 1721 | 0.003 |
| chr13:23788520-23788670 | 1721 | 0.005 |
| chr13:23757540-23757690 | 1569 | 0.007 |
| chr13:23735360-23735510 | 607 | 0.009 |
| chr13:23817340-23817490 | 1569 | 0.009 |
| chr13:23735120-23735270 | 607 | 0.016 |
| chr13:23895465-23895615 | 977 | 0.02 |
| chr13:23732005-23732155 | 1721 | 0.02 |
| chr13:23734905-23735055 | 2139 | 0.023 |
| chr13:23733925-23734075 | 407 | 0.023 |
External Databases
UCSCEnsembl (ENSG00000235205)