Gene: GSTA1
chr6: 52656461-52668708Expression Profile
(log scale)
Graphical Connections
Distribution of linked clusters:
You may find it interesting if many of the connected DHS sites belong to the same cluster.| Cluster Profile | Cluster ID | Number of DHS sites in this cluster |
|---|---|---|
 | 1355 | 5 |
 | 1388 | 1 |
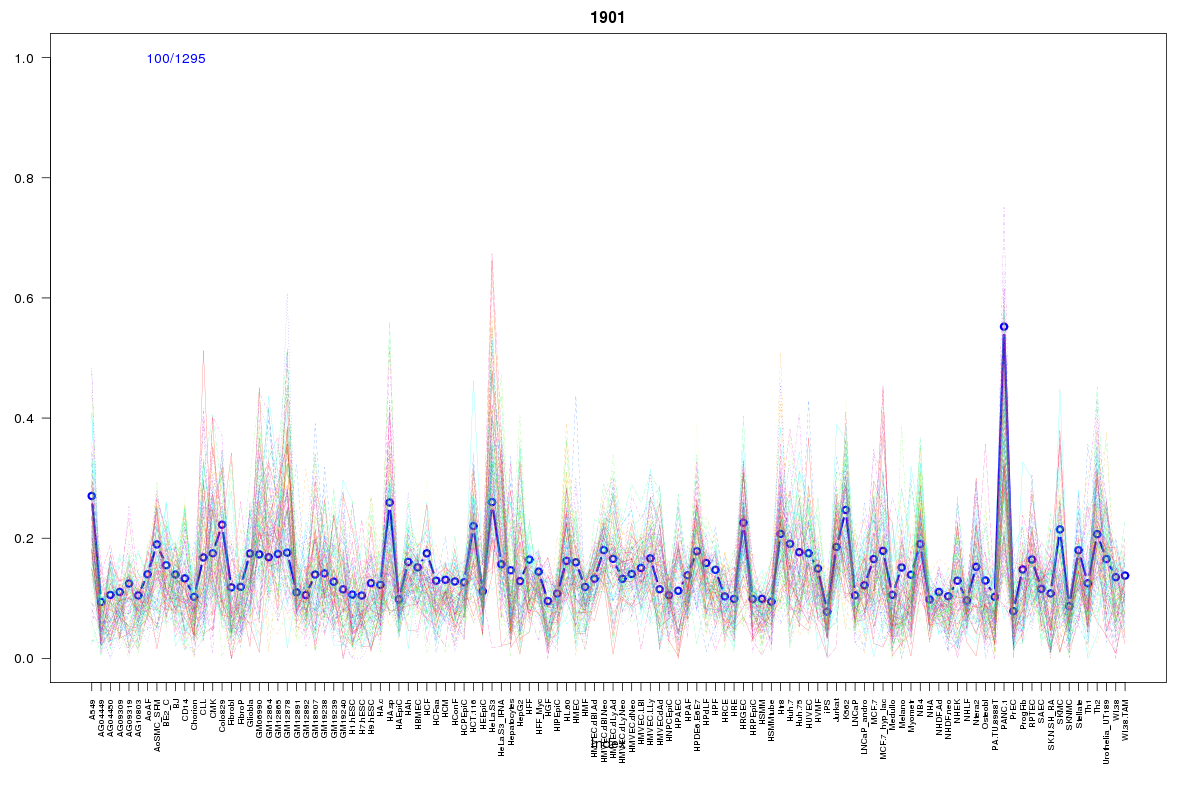 | 1901 | 1 |
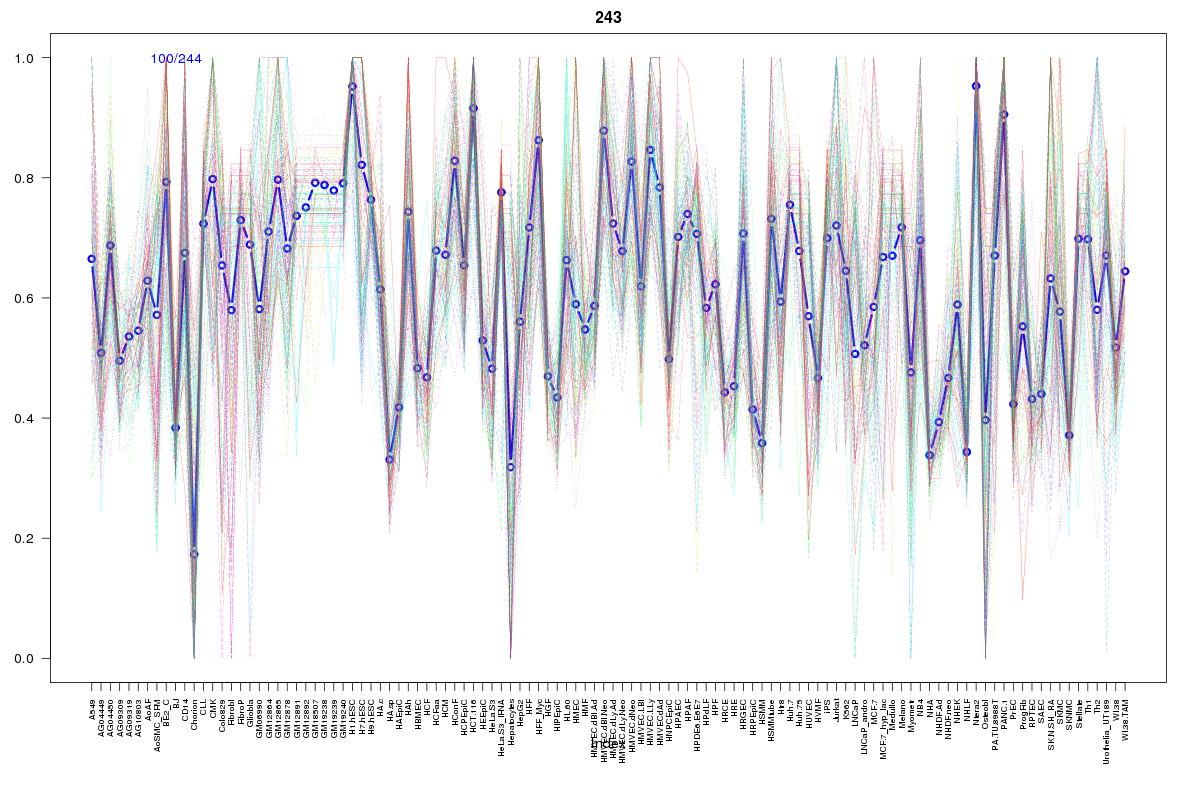 | 243 | 1 |
 | 2186 | 1 |
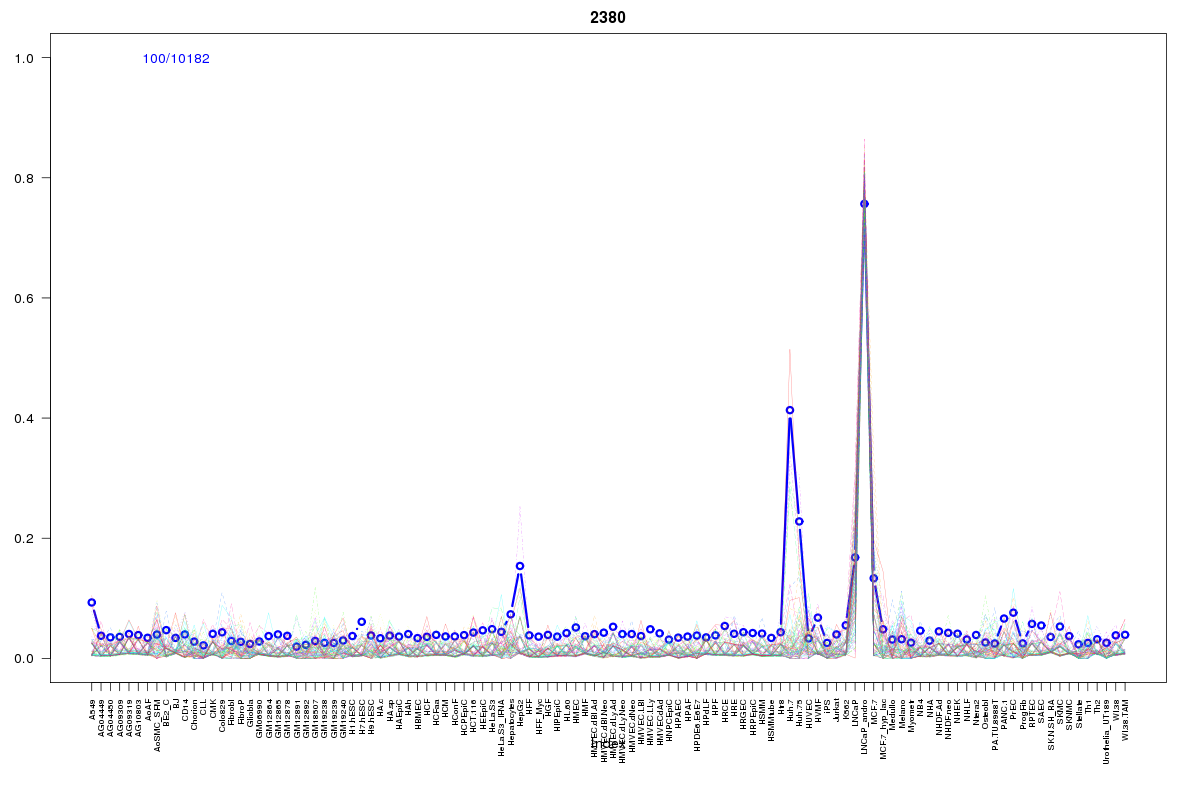 | 2380 | 1 |
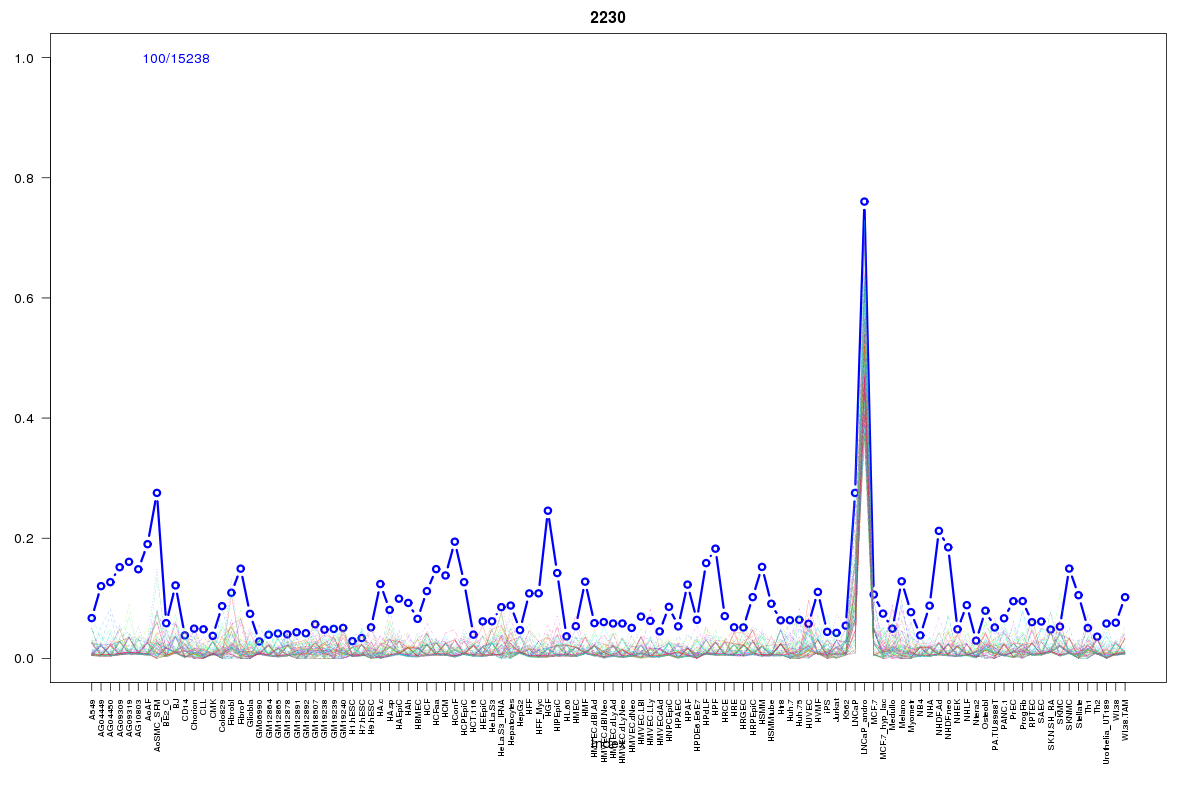 | 2230 | 1 |
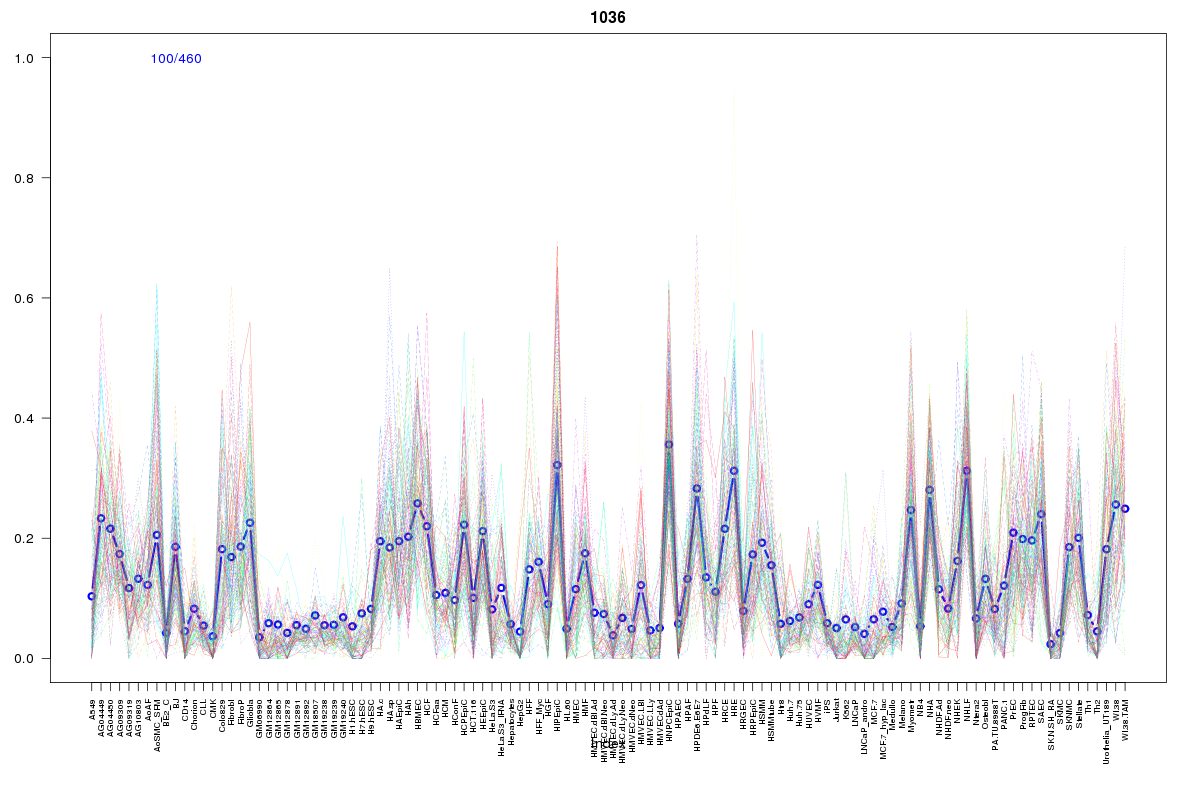 | 1036 | 1 |
Resources
BED file downloads
Connects to 12 DHS sitesTop 10 Correlated DHS Sites
p-values indiciate significant higher or lower correlation| Location | Cluster | P-value |
|---|---|---|
| chr6:52653360-52653510 | 2230 | 0.002 |
| chr6:52652840-52652990 | 2380 | 0.003 |
| chr6:52647765-52647915 | 2186 | 0.005 |
| chr6:52680100-52680250 | 1355 | 0.006 |
| chr6:52610600-52610750 | 1355 | 0.007 |
| chr6:52626740-52626890 | 1355 | 0.012 |
| chr6:52666320-52666470 | 1355 | 0.013 |
| chr6:52600005-52600155 | 1355 | 0.015 |
| chr6:52746965-52747115 | 1901 | 0.018 |
| chr6:52741985-52742135 | 1036 | 0.016 |
| chr6:52742140-52742290 | 1388 | 0.007 |
External Databases
UCSCEnsembl (ENSG00000243955)