Gene: TBCAP3
chr4: 99830687-99830999Expression Profile
(log scale)
Graphical Connections
Distribution of linked clusters:
You may find it interesting if many of the connected DHS sites belong to the same cluster.| Cluster Profile | Cluster ID | Number of DHS sites in this cluster |
|---|---|---|
 | 2110 | 2 |
 | 416 | 1 |
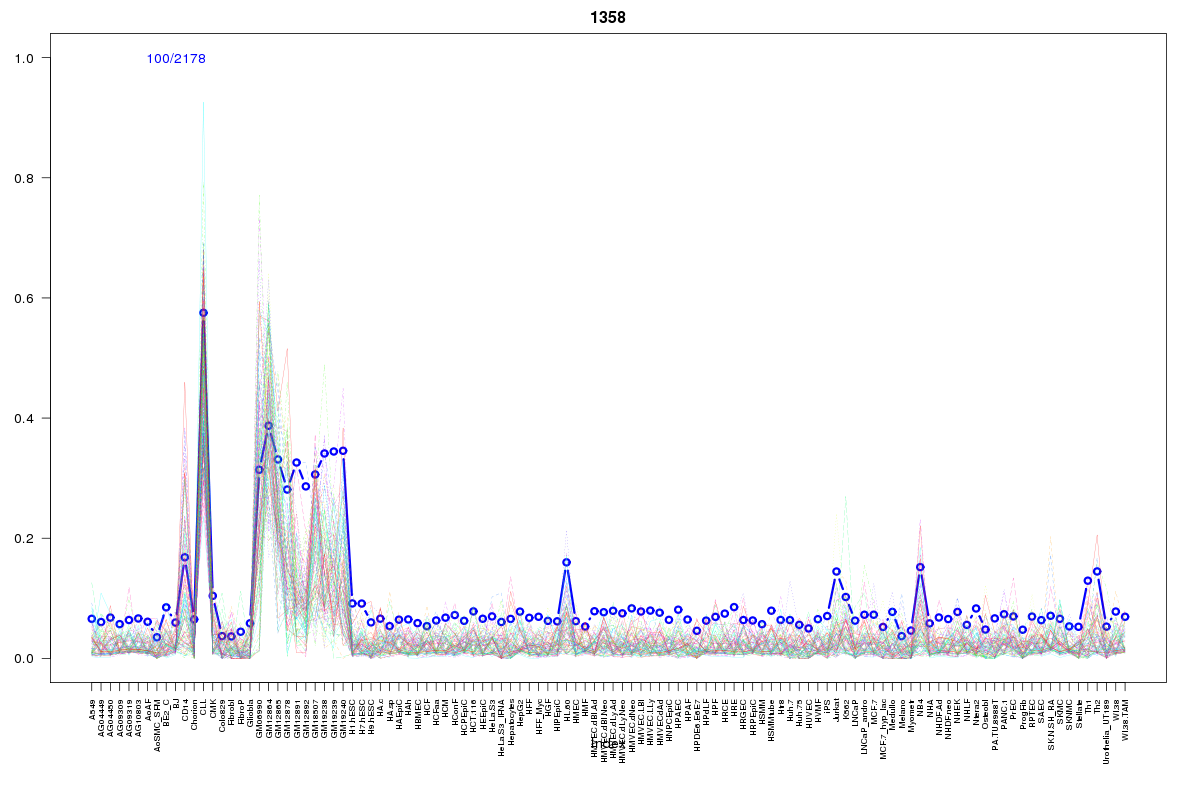 | 1358 | 1 |
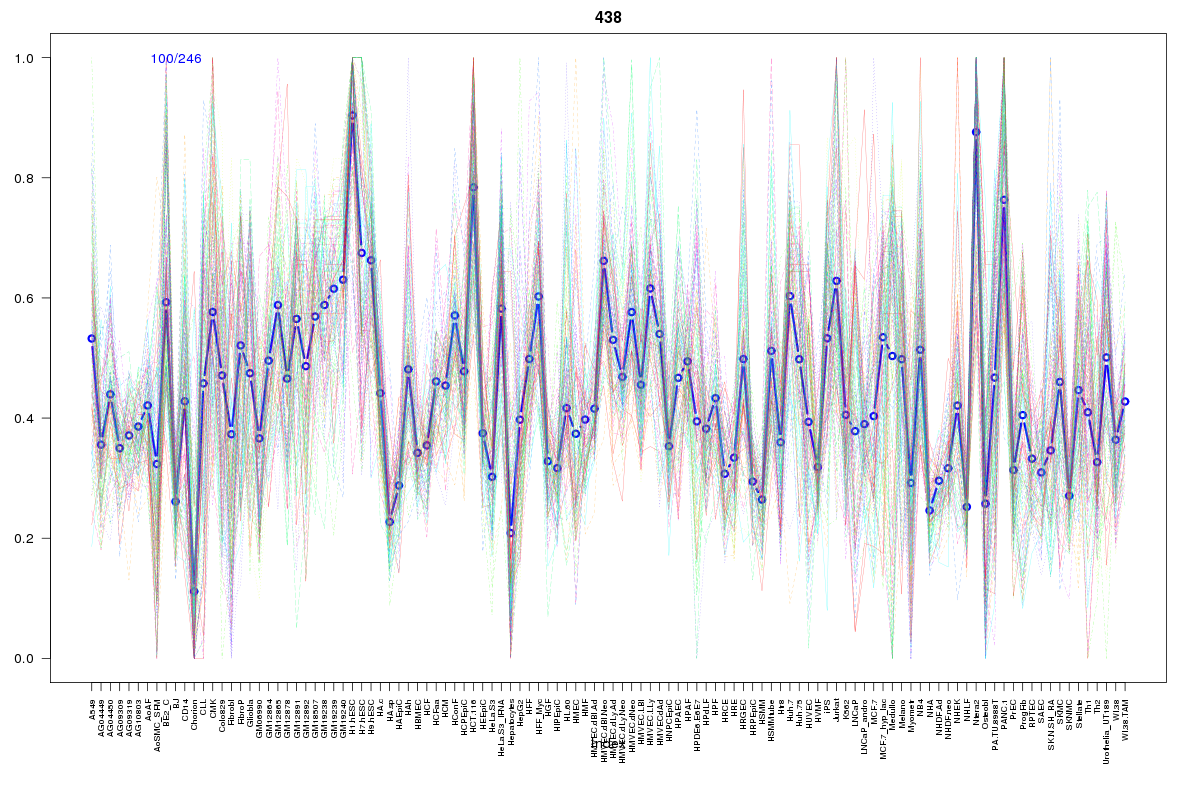 | 438 | 1 |
 | 134 | 1 |
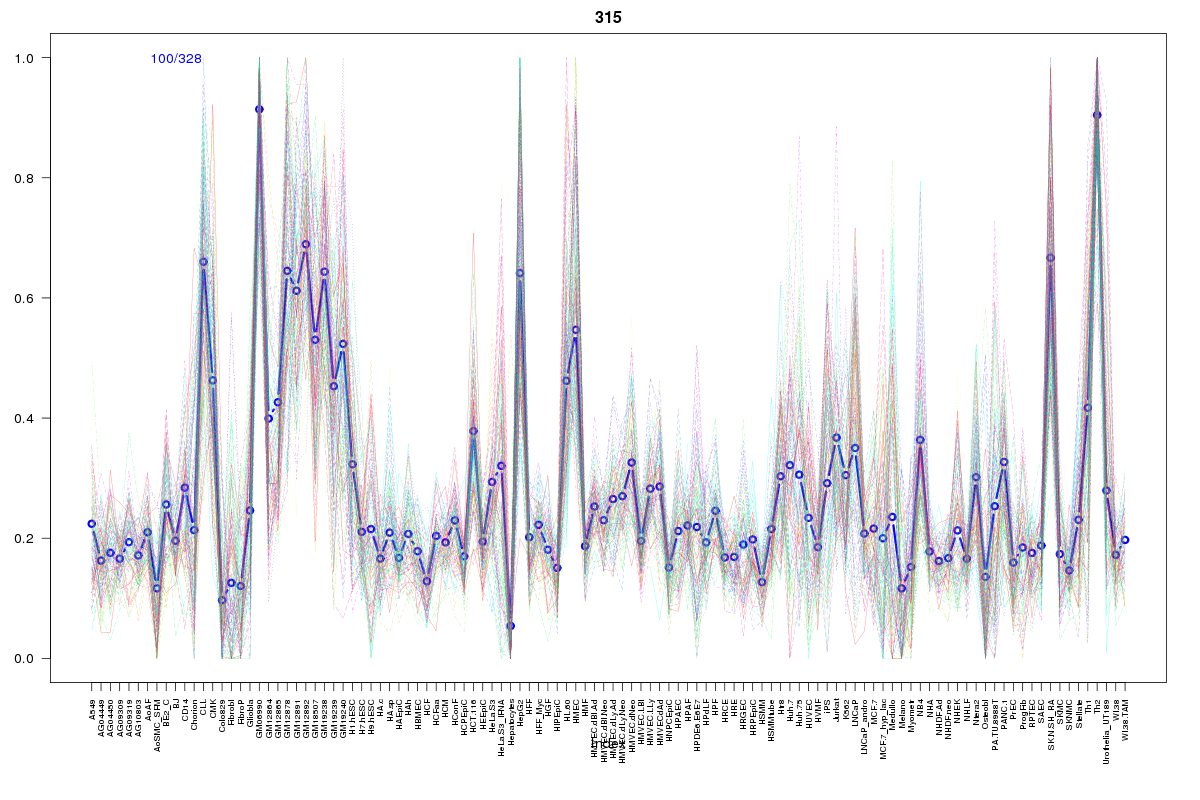 | 315 | 1 |
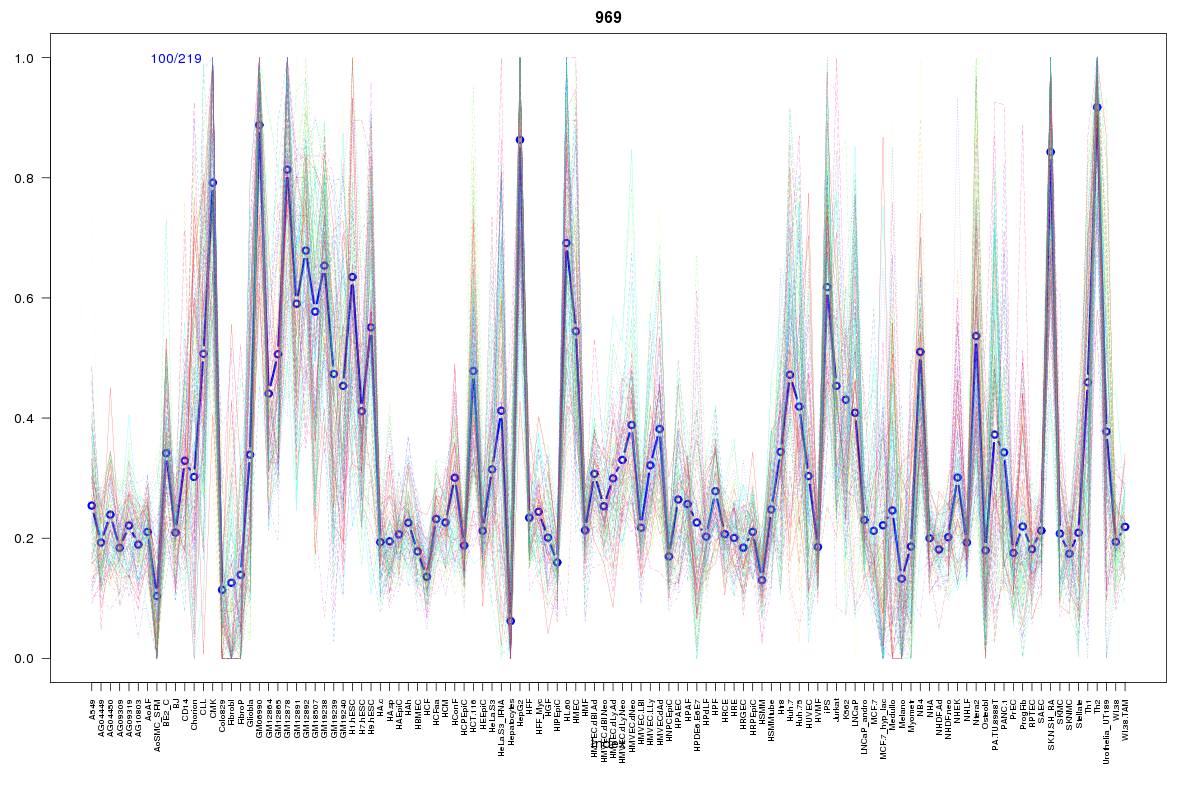 | 969 | 1 |
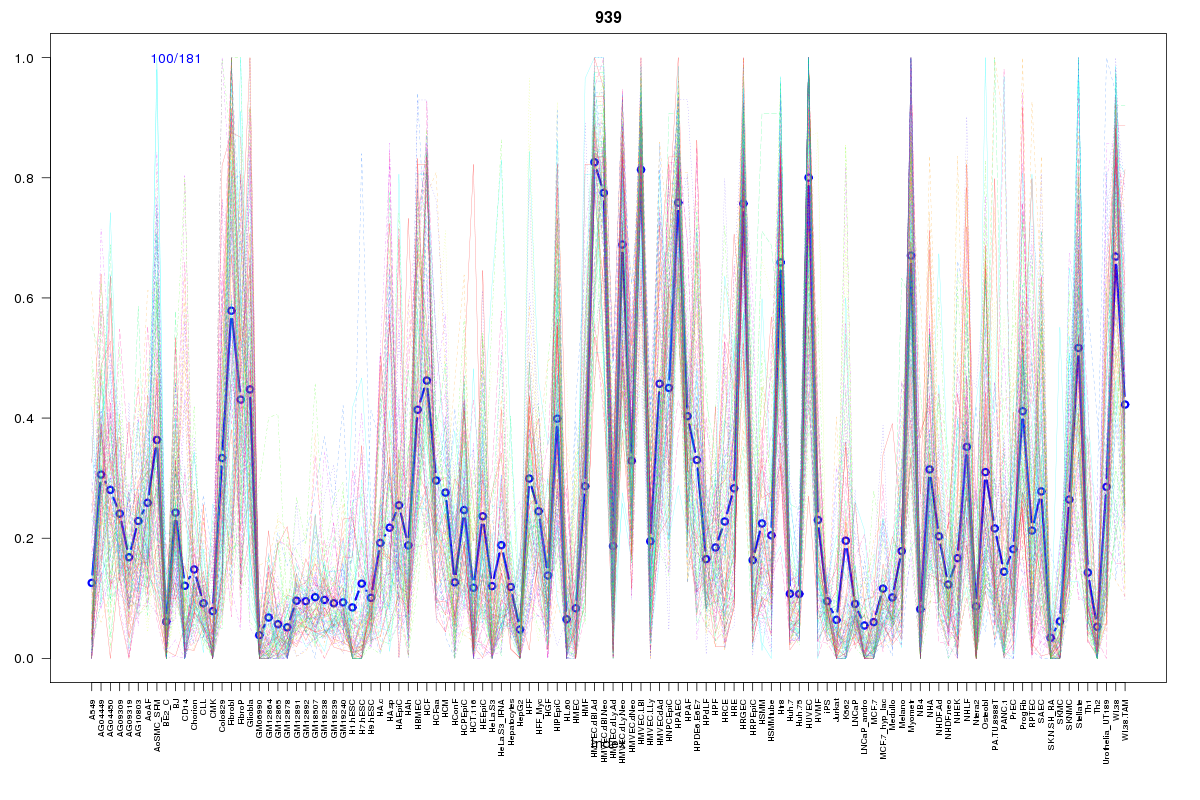 | 939 | 1 |
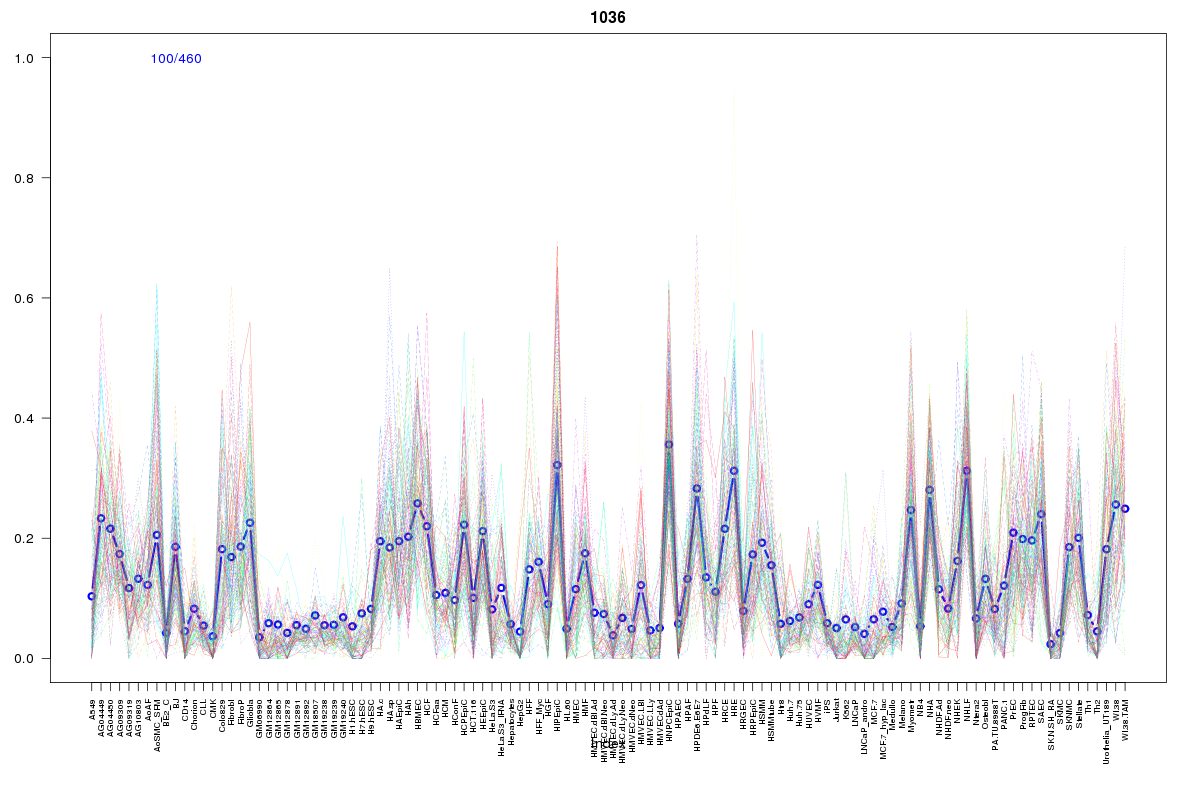 | 1036 | 1 |
 | 1963 | 1 |
 | 1755 | 1 |
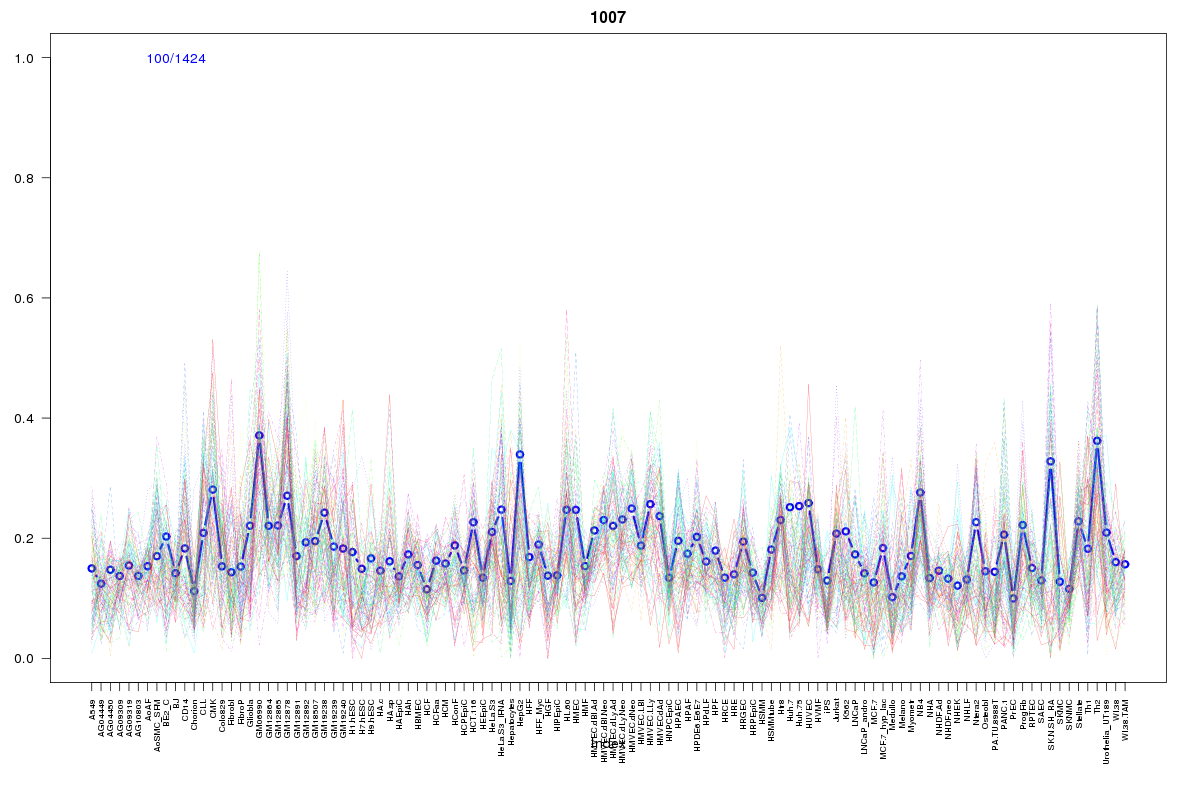 | 1007 | 1 |
 | 615 | 1 |
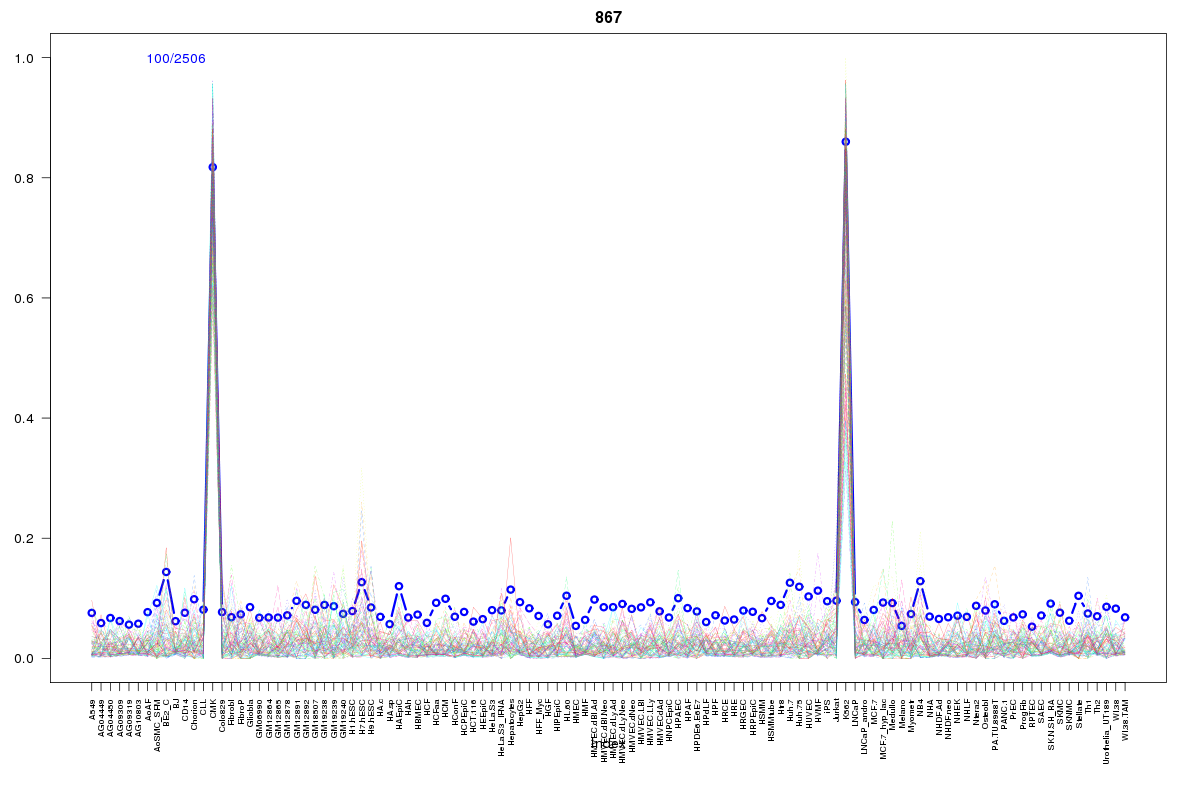 | 867 | 1 |
Resources
BED file downloads
Connects to 15 DHS sitesTop 10 Correlated DHS Sites
p-values indiciate significant higher or lower correlation| Location | Cluster | P-value |
|---|---|---|
| chr4:99845080-99845230 | 1358 | 0.002 |
| chr4:99849420-99849570 | 134 | 0.005 |
| chr4:99849900-99850050 | 315 | 0.01 |
| chr4:99850100-99850250 | 969 | 0.01 |
| chr4:99858205-99858355 | 2110 | 0.014 |
| chr4:99742540-99742690 | 615 | 0.014 |
| chr4:99907685-99907835 | 1755 | 0.016 |
| chr4:99917860-99918010 | 1007 | 0.017 |
| chr4:99849265-99849415 | 438 | 0.018 |
| chr4:99872940-99873090 | 1963 | 0.018 |
| chr4:99743400-99743550 | 867 | 0.02 |
External Databases
UCSCEnsembl (ENSG00000249055)