Gene: TPTE2P1
chr13: 25498814-25542415Expression Profile
(log scale)
Graphical Connections
Distribution of linked clusters:
You may find it interesting if many of the connected DHS sites belong to the same cluster.| Cluster Profile | Cluster ID | Number of DHS sites in this cluster |
|---|---|---|
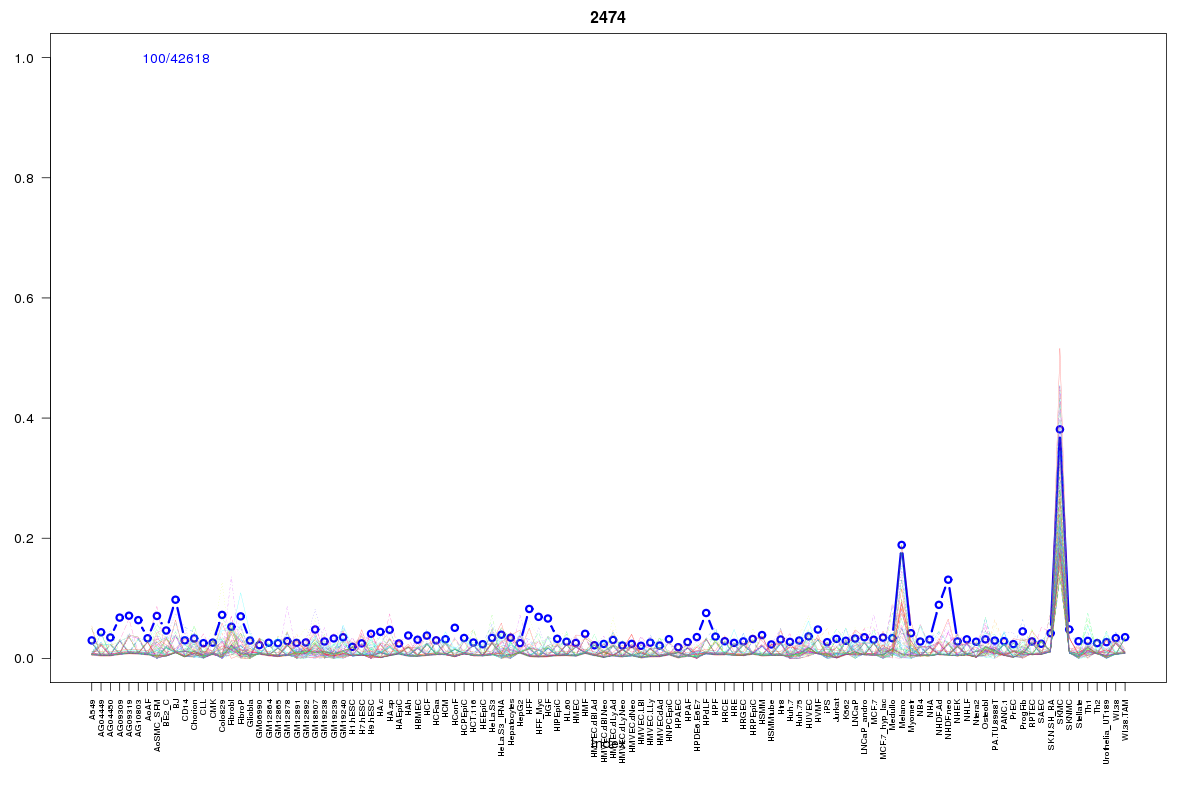 | 2474 | 2 |
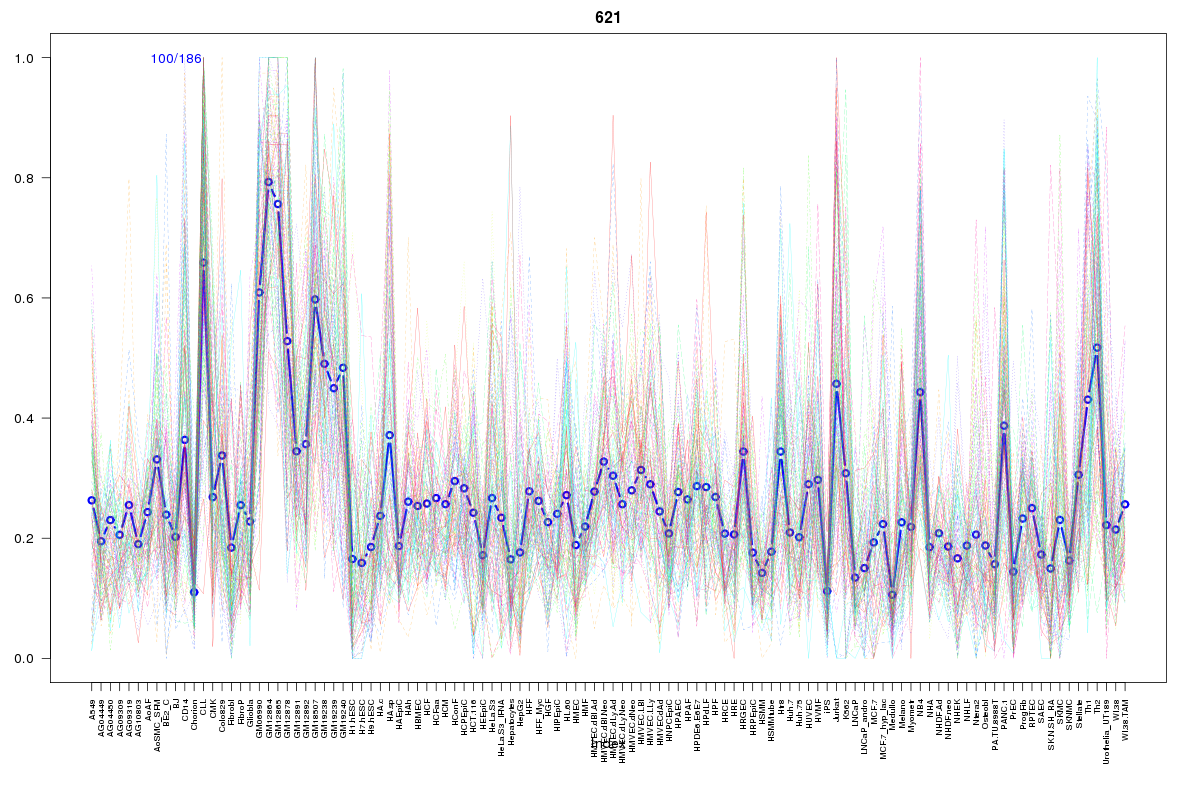 | 621 | 1 |
 | 2411 | 1 |
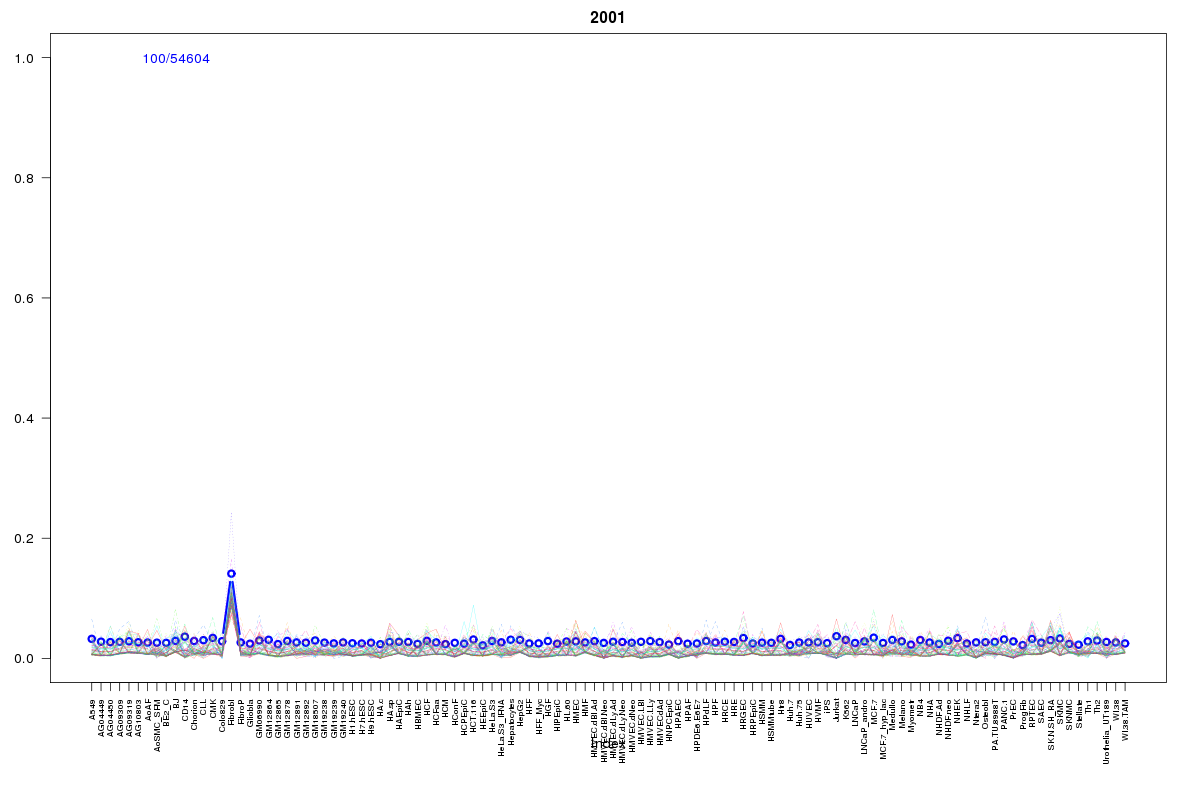 | 2001 | 1 |
 | 2223 | 1 |
 | 10 | 1 |
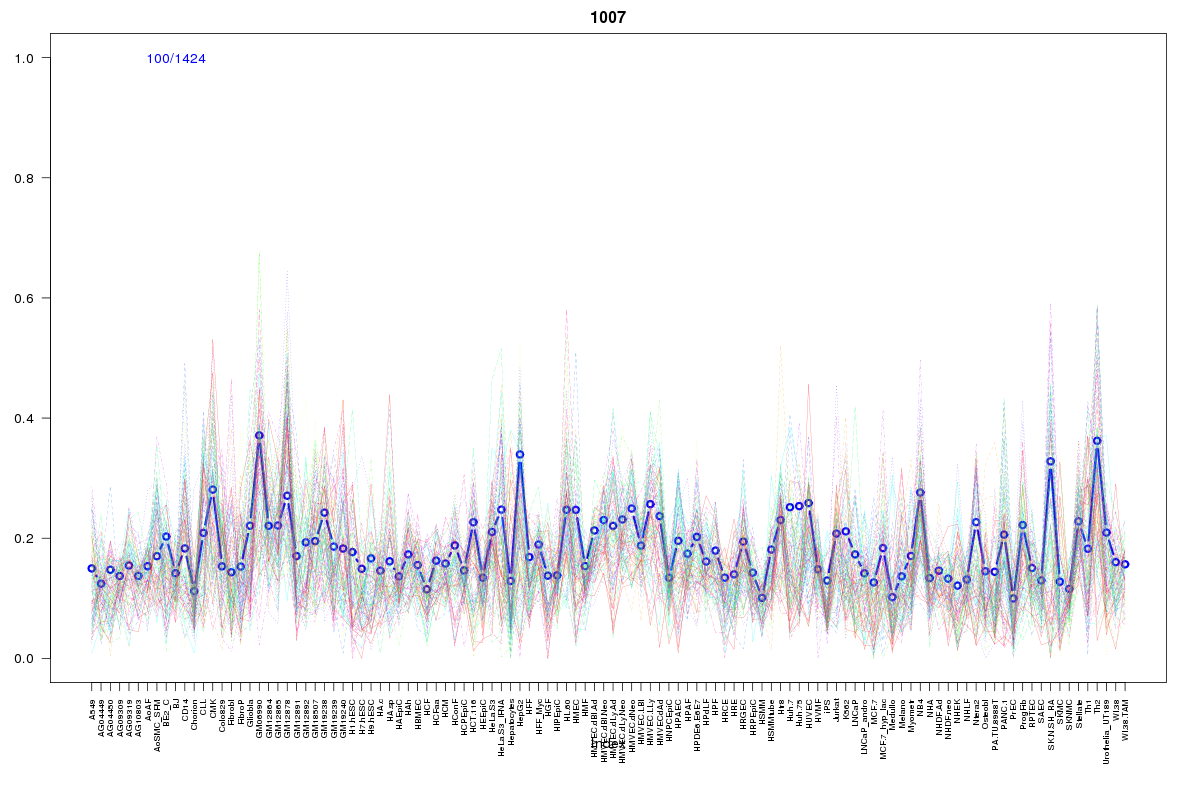 | 1007 | 1 |
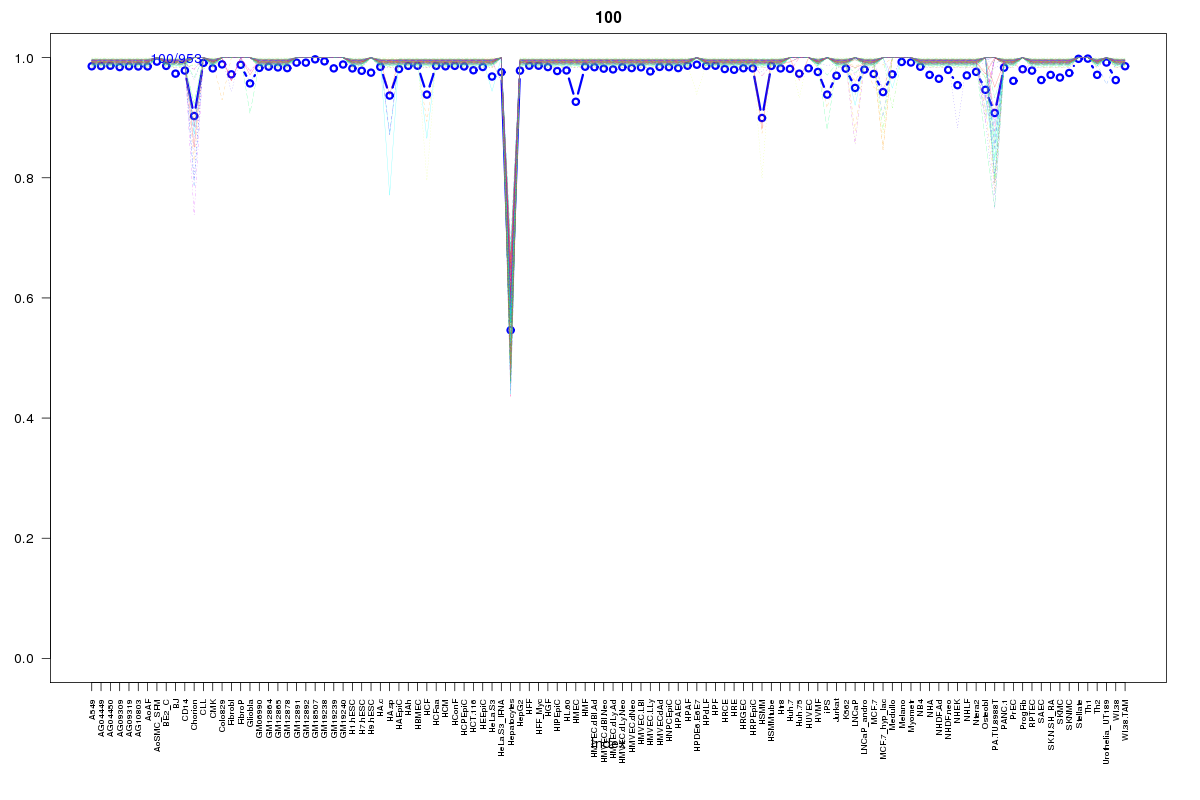 | 100 | 1 |
Resources
BED file downloads
Connects to 9 DHS sitesTop 10 Correlated DHS Sites
p-values indiciate significant higher or lower correlation| Location | Cluster | P-value |
|---|---|---|
| chr13:25439125-25439275 | 2001 | 0.001 |
| chr13:25569725-25569875 | 2474 | 0.02 |
| chr13:25439440-25439590 | 2223 | 0.022 |
| chr13:25488040-25488190 | 2474 | 0.024 |
| chr13:25497040-25497190 | 100 | 0.024 |
| chr13:25576580-25576730 | 2411 | 0.022 |
| chr13:25462760-25462910 | 10 | 0.013 |
| chr13:25496520-25496670 | 1007 | 0.009 |
| chr13:25497620-25497770 | 621 | 0.006 |
External Databases
UCSCEnsembl (ENSG00000253771)