Gene: ATP13A1
chr19: 19756006-19758520Expression Profile
(log scale)
Graphical Connections
Distribution of linked clusters:
You may find it interesting if many of the connected DHS sites belong to the same cluster.| Cluster Profile | Cluster ID | Number of DHS sites in this cluster |
|---|---|---|
 | 1008 | 3 |
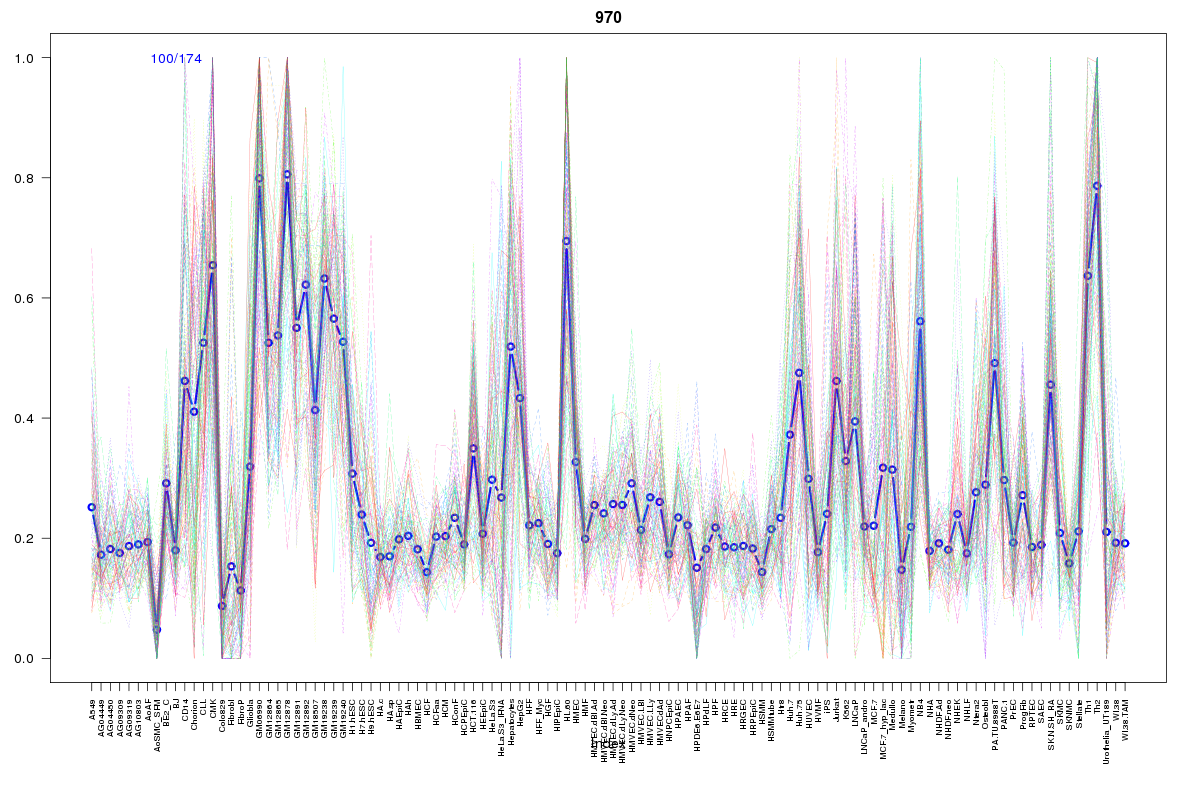 | 970 | 2 |
 | 1078 | 2 |
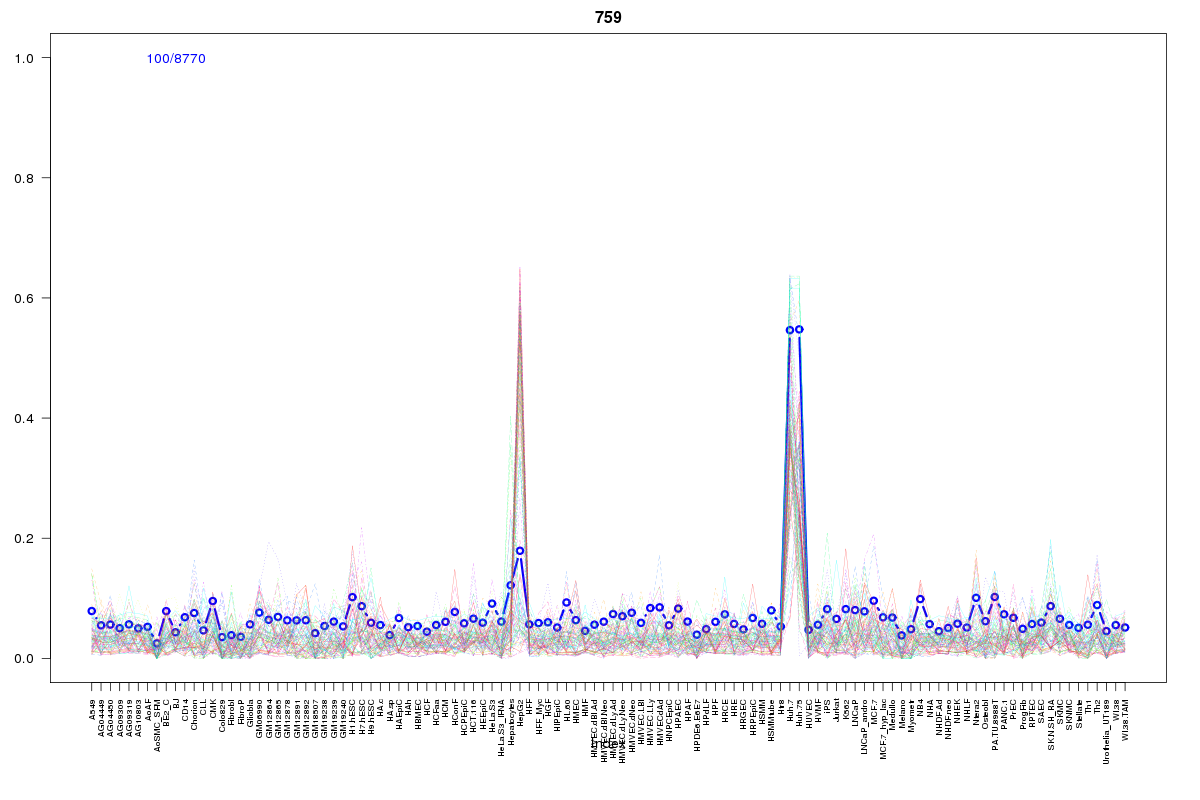 | 759 | 2 |
 | 1056 | 1 |
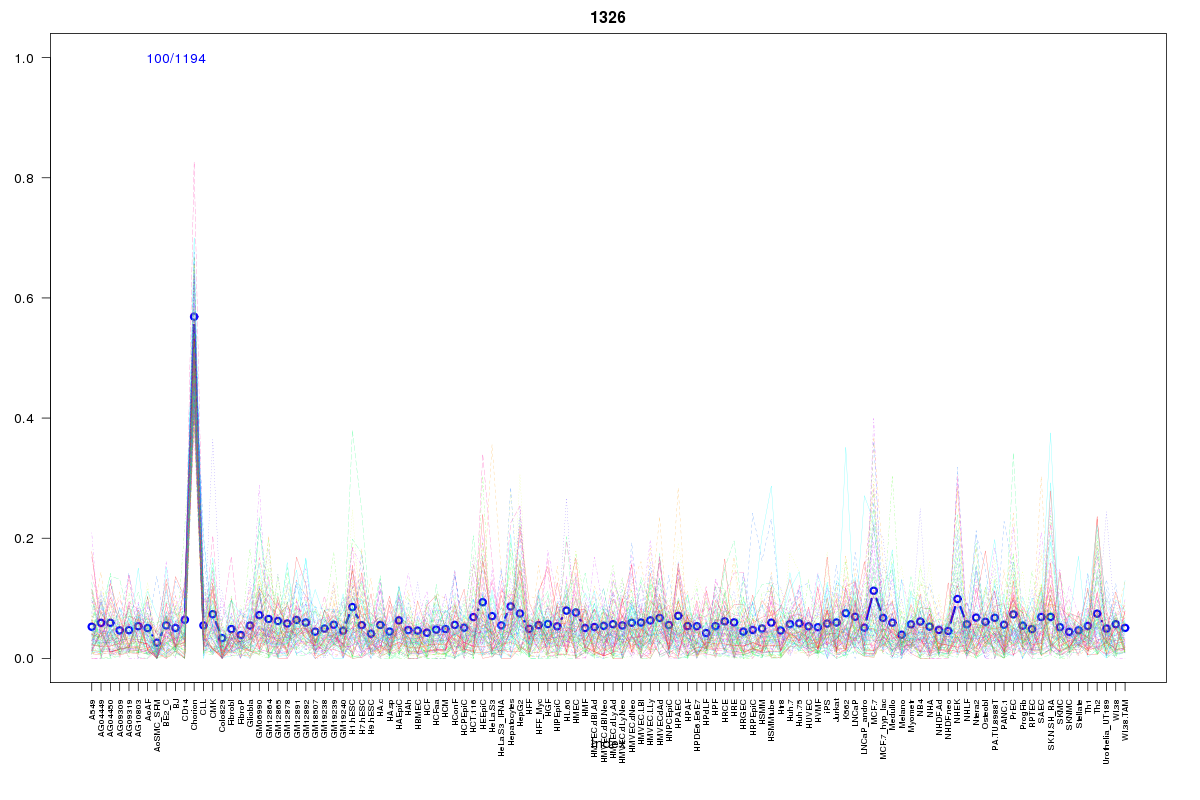 | 1326 | 1 |
 | 174 | 1 |
 | 569 | 1 |
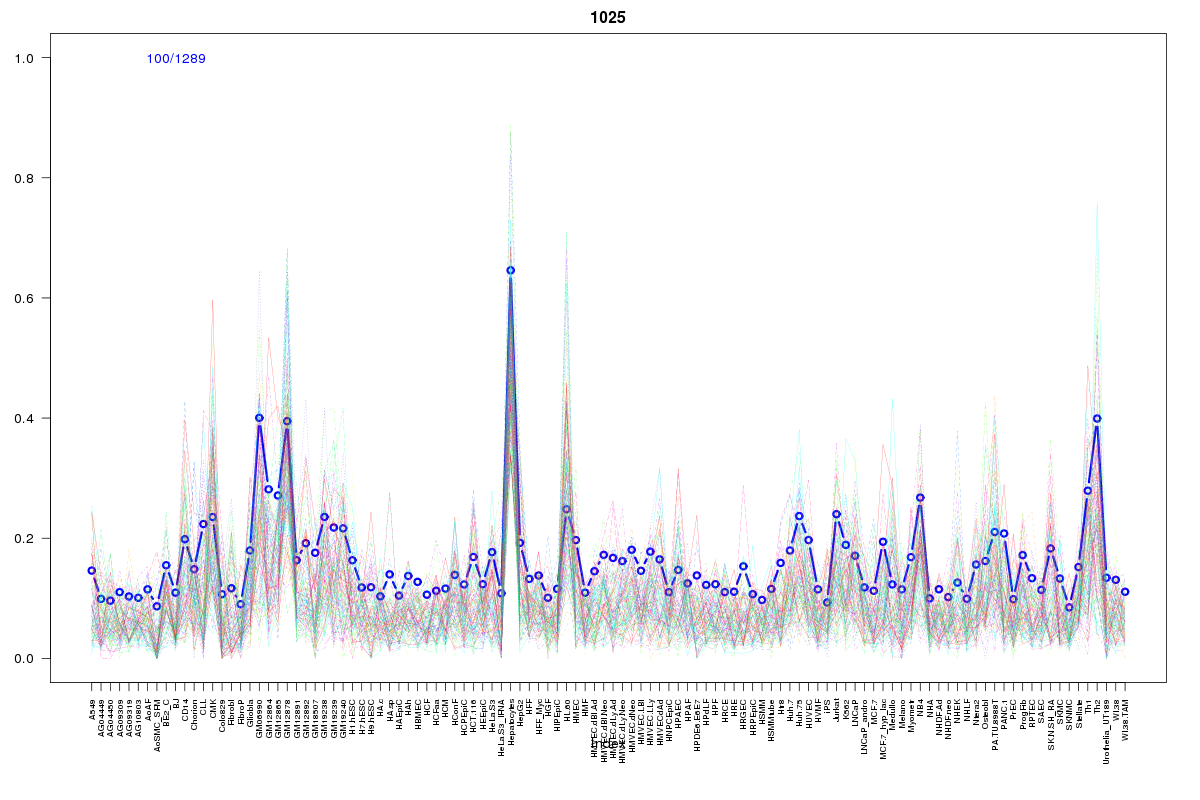 | 1025 | 1 |
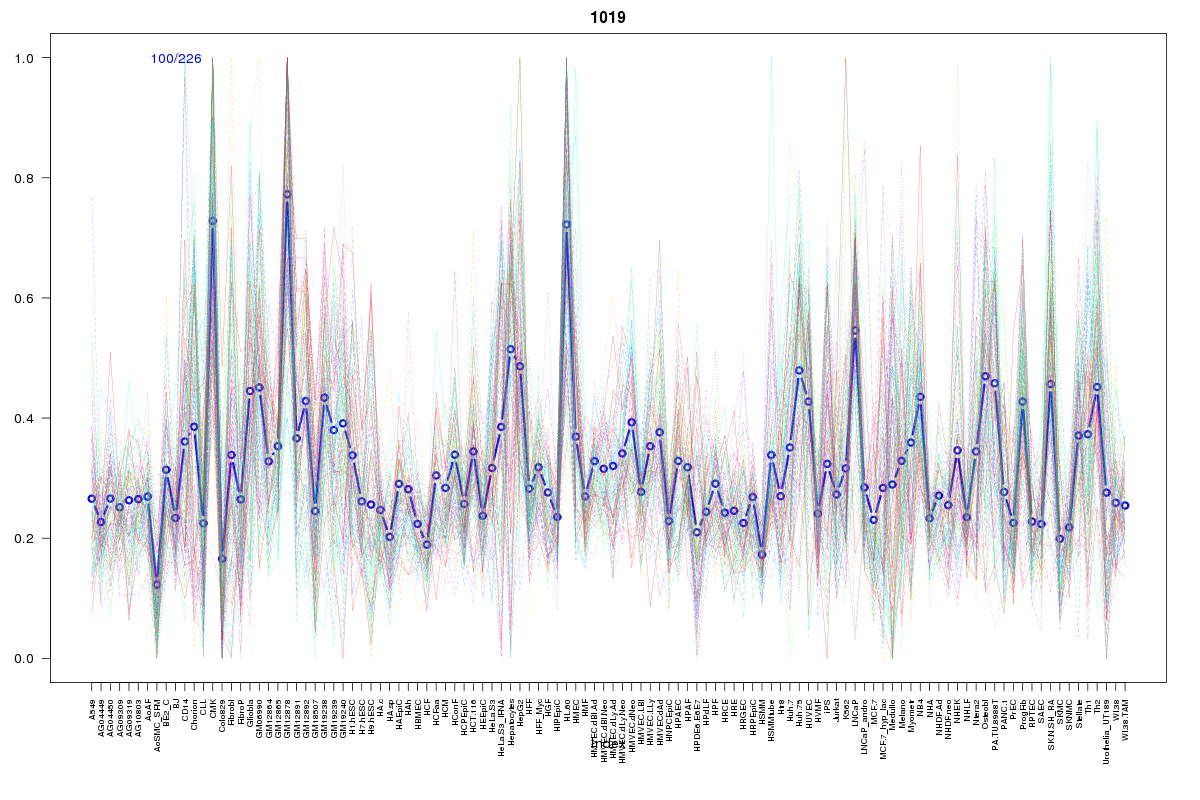 | 1019 | 1 |
 | 2211 | 1 |
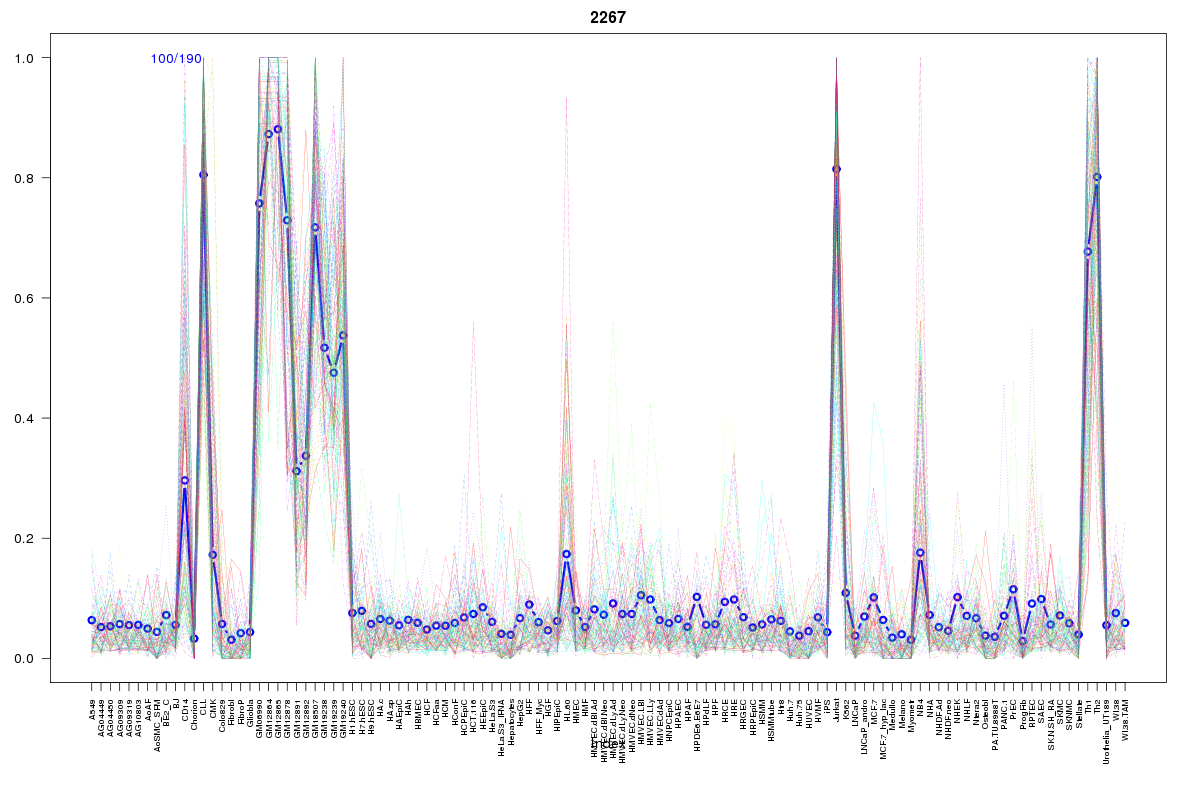 | 2267 | 1 |
 | 582 | 1 |
 | 2055 | 1 |
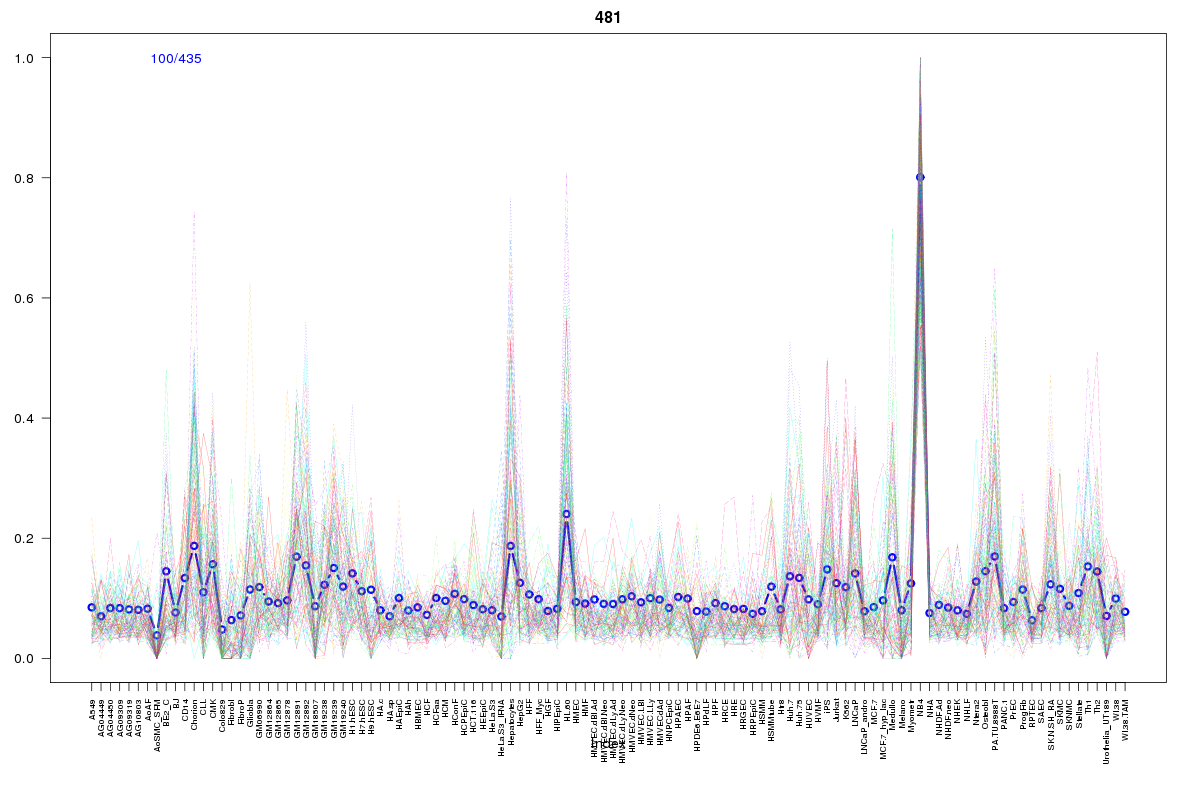 | 481 | 1 |
Resources
BED file downloads
Connects to 20 DHS sitesTop 10 Correlated DHS Sites
p-values indiciate significant higher or lower correlation| Location | Cluster | P-value |
|---|---|---|
| chr19:19798005-19798155 | 582 | 0.001 |
| chr19:19726805-19726955 | 759 | 0.002 |
| chr19:19753365-19753515 | 970 | 0.002 |
| chr19:19735420-19735570 | 569 | 0.01 |
| chr19:19657085-19657235 | 759 | 0.013 |
| chr19:19774040-19774190 | 970 | 0.013 |
| chr19:19779100-19779250 | 2267 | 0.014 |
| chr19:19740305-19740455 | 1025 | 0.014 |
| chr19:19762705-19762855 | 2211 | 0.019 |
| chr19:19709580-19709730 | 174 | 0.022 |
| chr19:19659945-19660095 | 481 | 0.023 |
External Databases
UCSCEnsembl (ENSG00000105726)