Gene: AKAP3
chr12: 4724673-4758213Expression Profile
(log scale)
Graphical Connections
Distribution of linked clusters:
You may find it interesting if many of the connected DHS sites belong to the same cluster.| Cluster Profile | Cluster ID | Number of DHS sites in this cluster |
|---|---|---|
 | 10 | 17 |
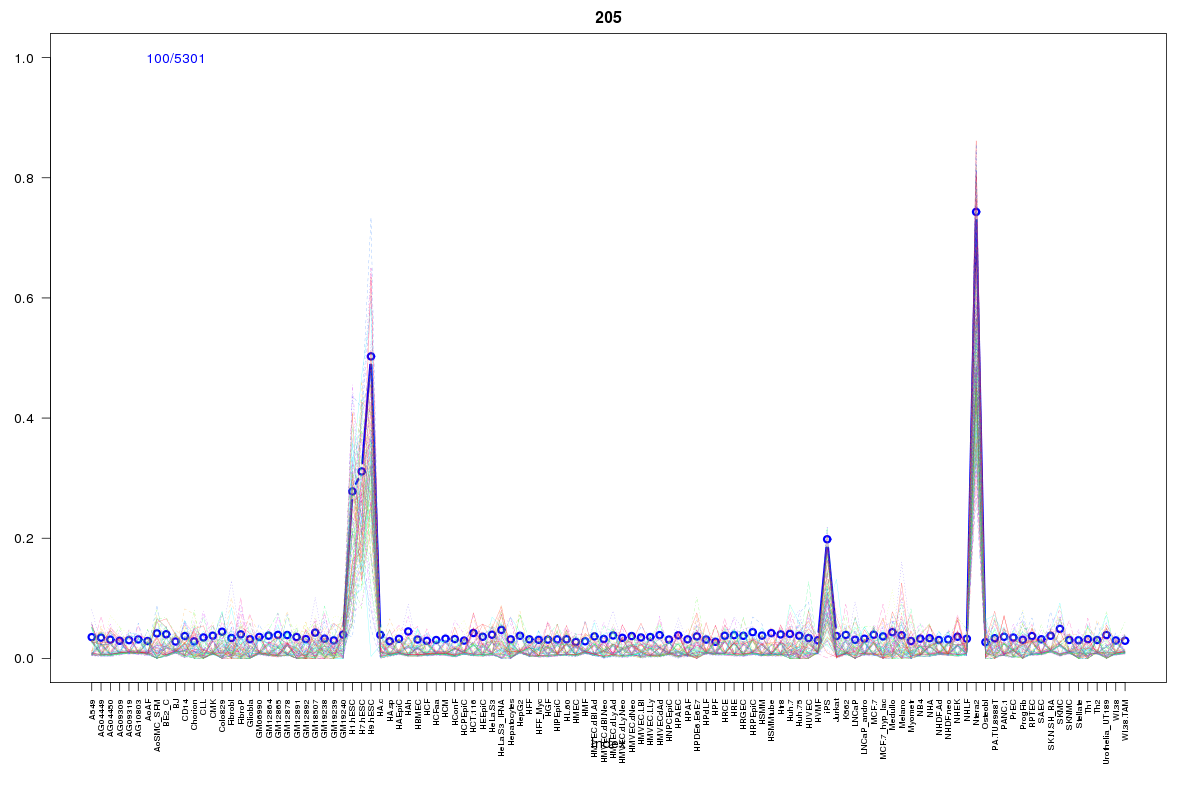 | 205 | 7 |
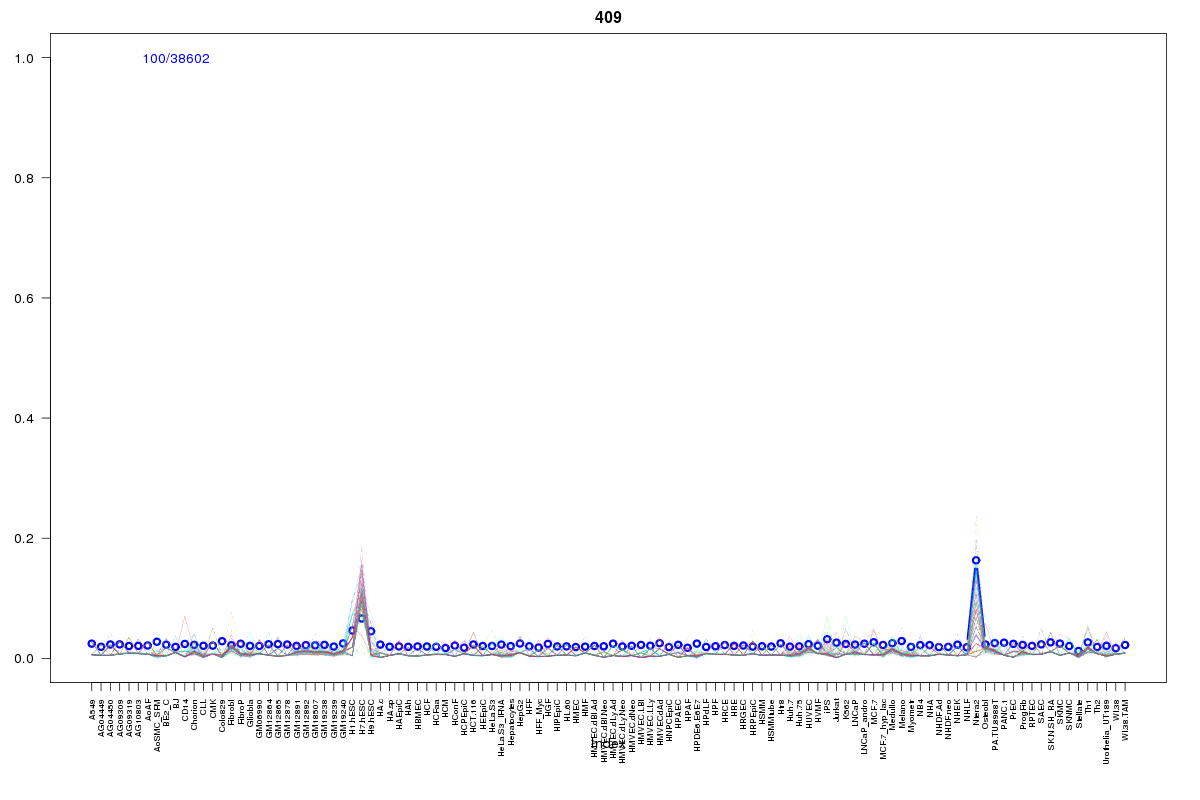 | 409 | 7 |
 | 860 | 4 |
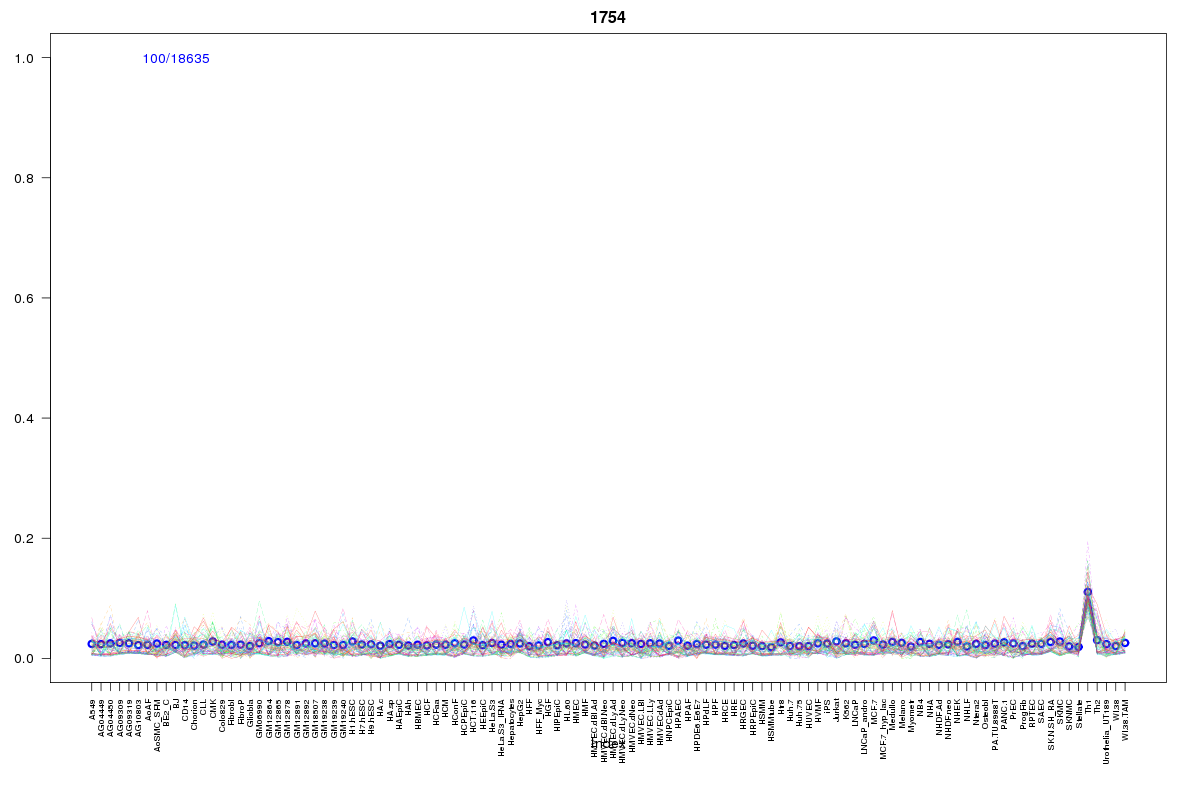 | 1754 | 2 |
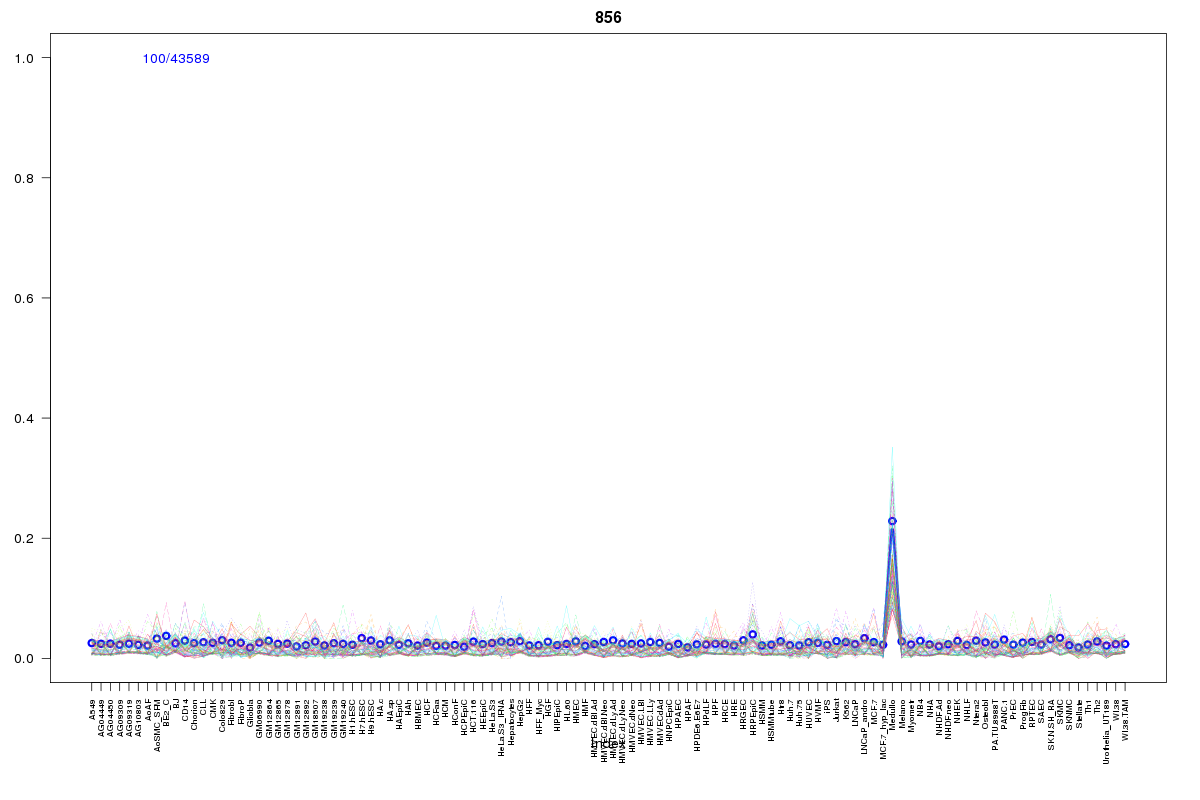 | 856 | 1 |
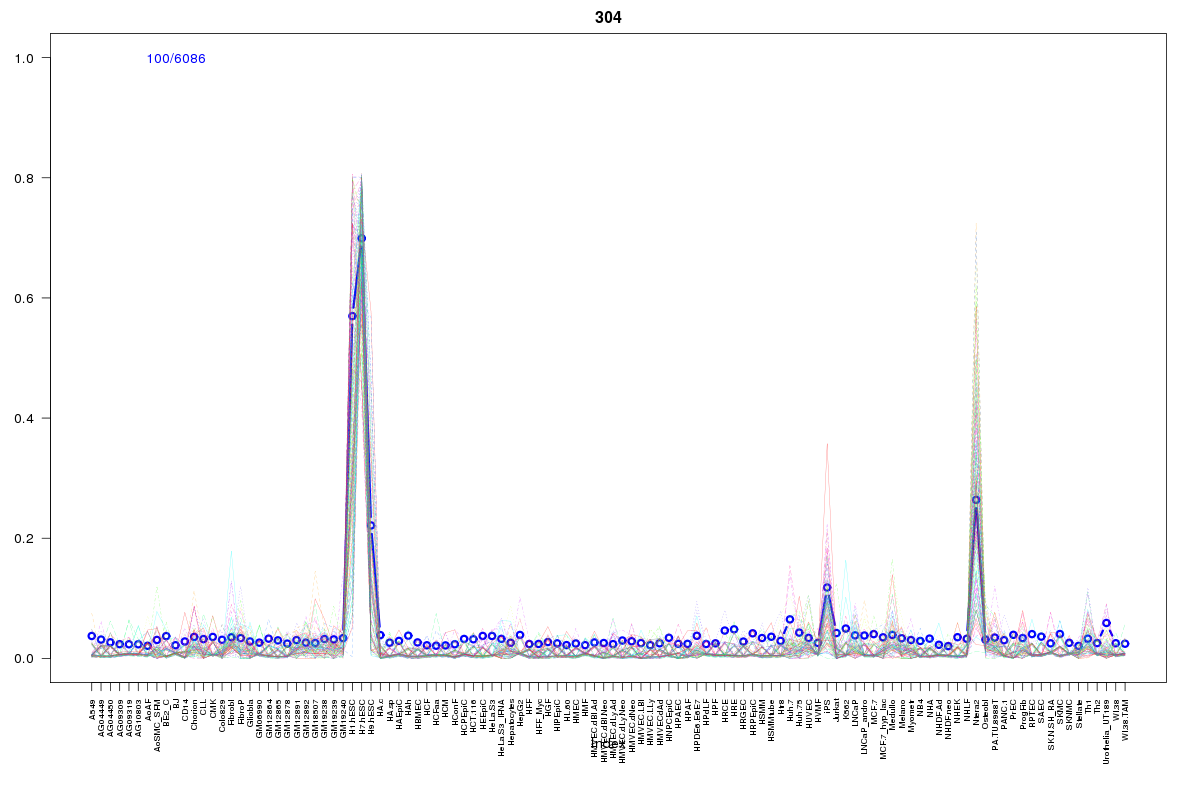 | 304 | 1 |
 | 1056 | 1 |
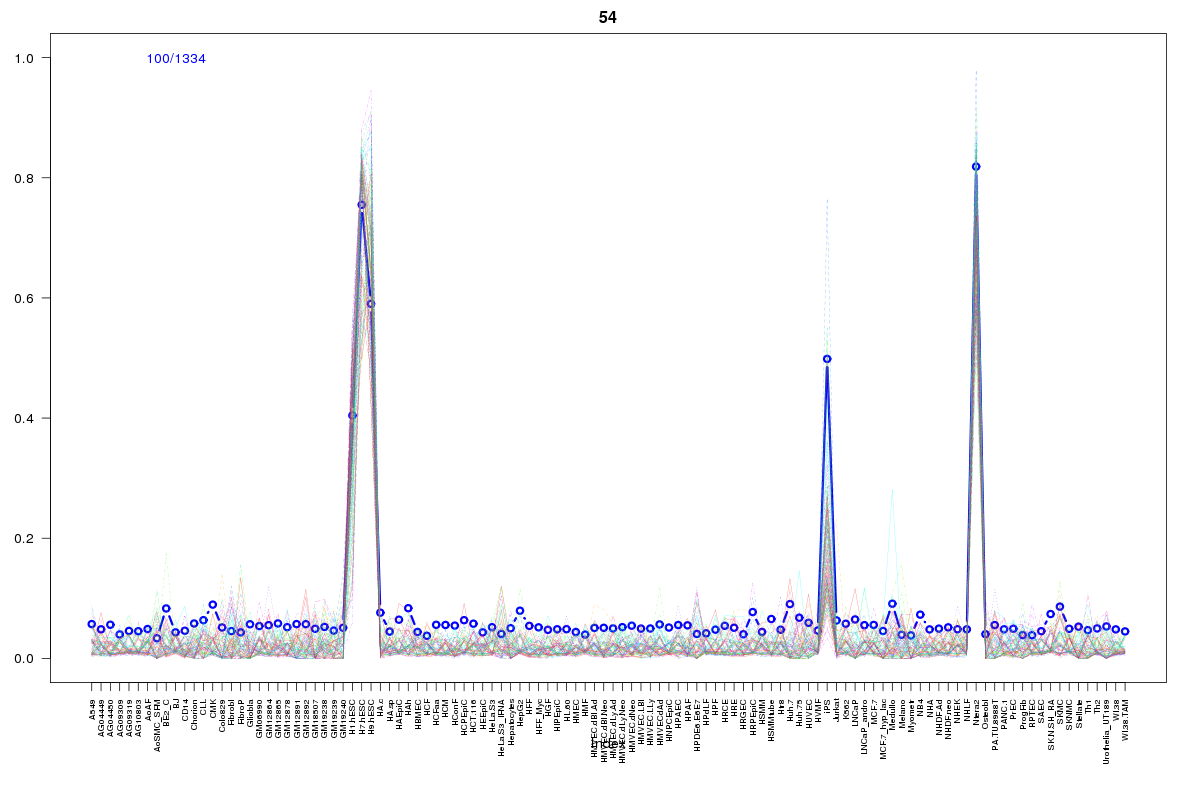 | 54 | 1 |
 | 15 | 1 |
 | 416 | 1 |
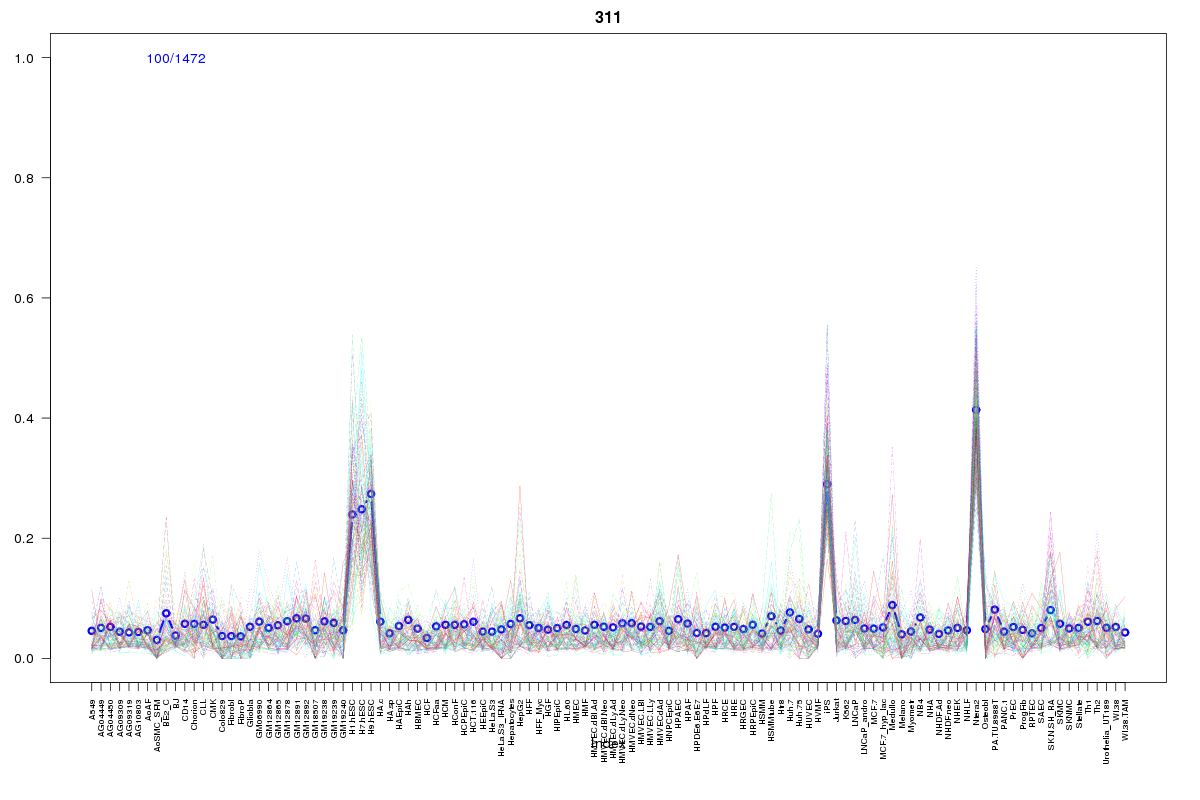 | 311 | 1 |
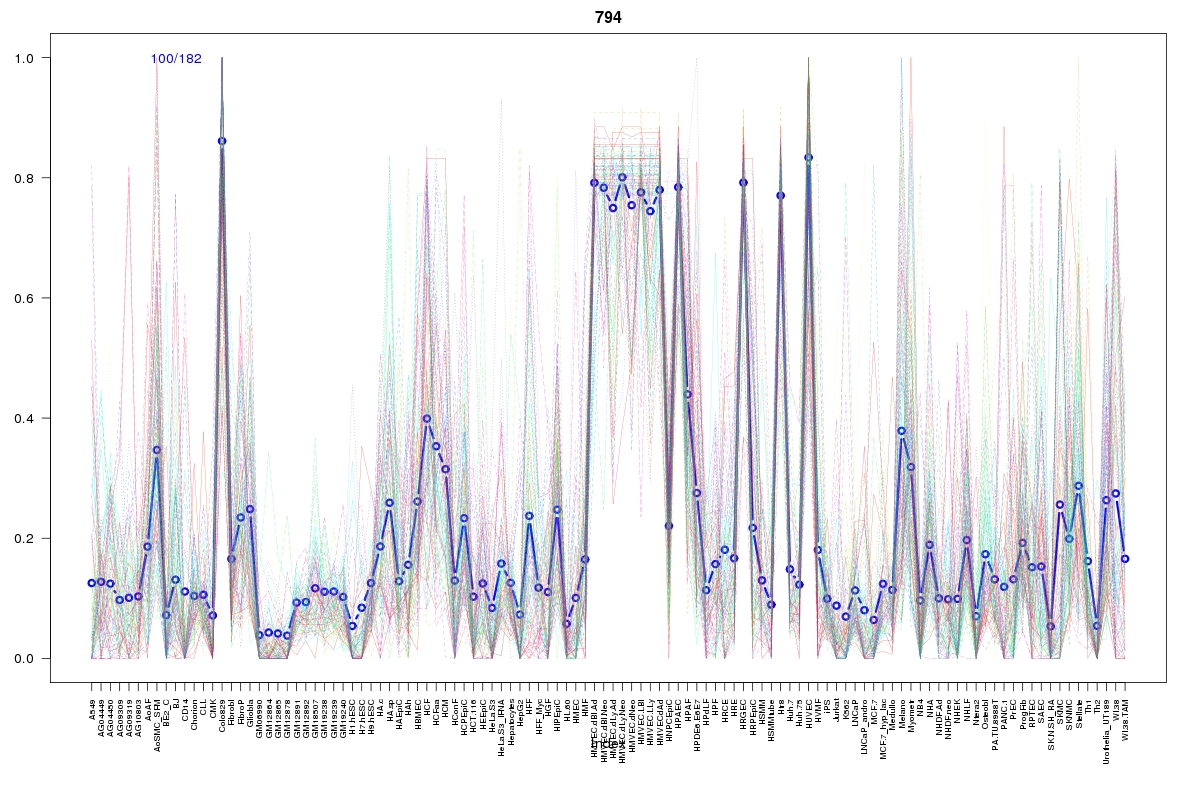 | 794 | 1 |
 | 2023 | 1 |
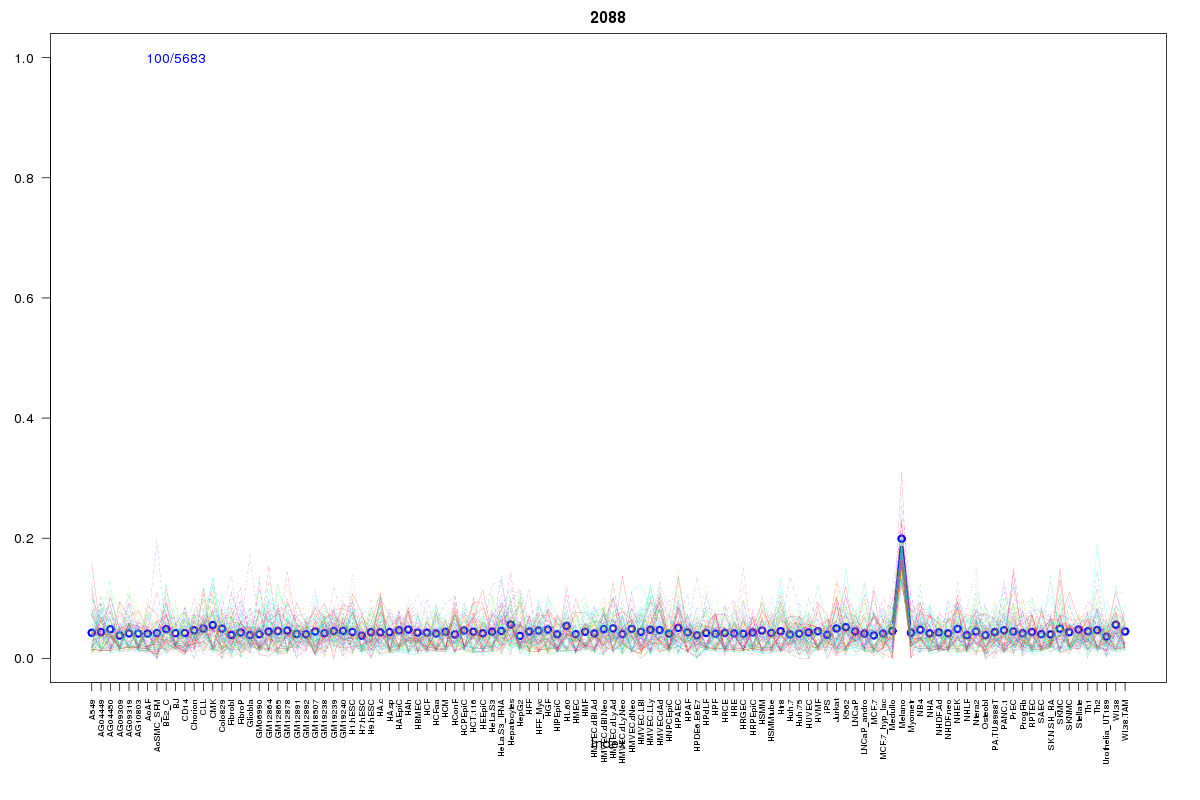 | 2088 | 1 |
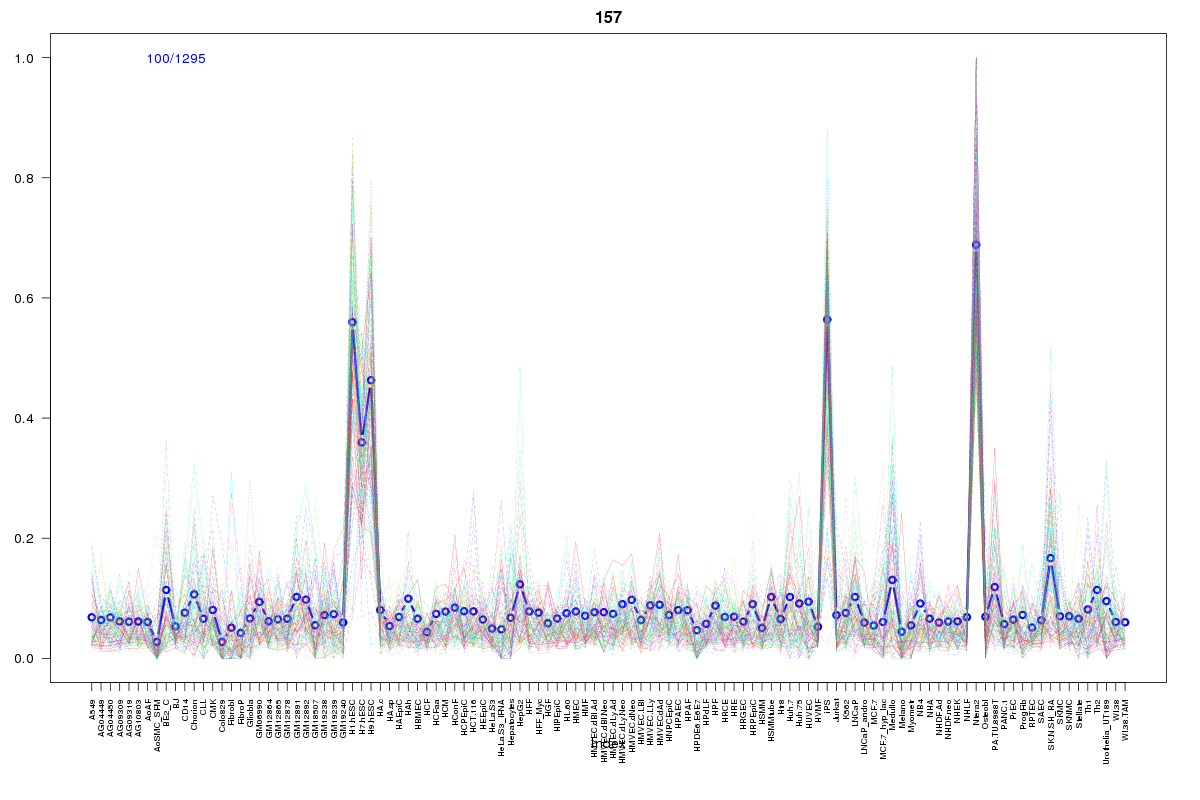 | 157 | 1 |
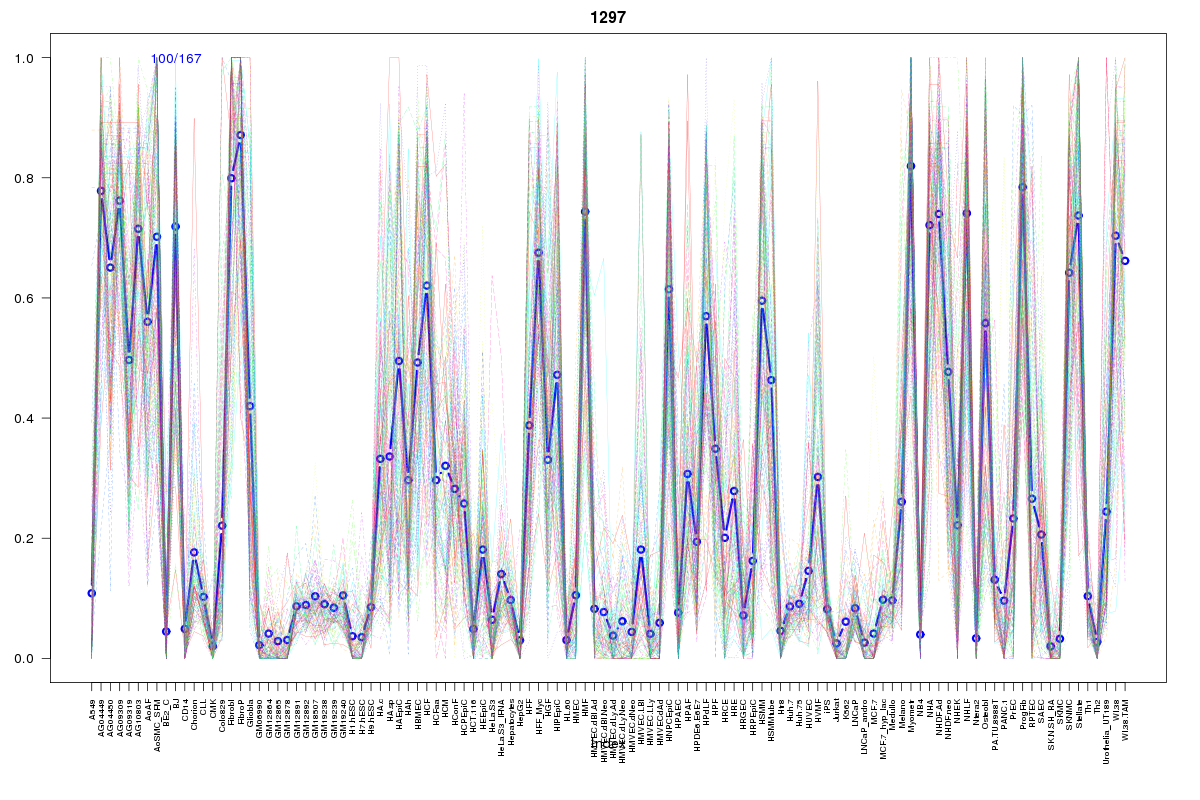 | 1297 | 1 |
 | 1230 | 1 |
Resources
BED file downloads
Connects to 50 DHS sitesTop 10 Correlated DHS Sites
p-values indiciate significant higher or lower correlation| Location | Cluster | P-value |
|---|---|---|
| chr12:4824125-4824275 | 856 | 0 |
| chr12:4834545-4834695 | 409 | 0 |
| chr12:4674645-4674795 | 10 | 0 |
| chr12:4801405-4801555 | 860 | 0 |
| chr12:4821740-4821890 | 409 | 0.002 |
| chr12:4702825-4702975 | 10 | 0.002 |
| chr12:4807005-4807155 | 409 | 0.002 |
| chr12:4746460-4746610 | 409 | 0.002 |
| chr12:4754300-4754450 | 205 | 0.002 |
| chr12:4800105-4800255 | 860 | 0.002 |
| chr12:4694100-4694250 | 205 | 0.002 |
External Databases
UCSCEnsembl (ENSG00000111254)