Gene: TPT1
chr13: 45911007-45915347Expression Profile
(log scale)
Graphical Connections
Distribution of linked clusters:
You may find it interesting if many of the connected DHS sites belong to the same cluster.| Cluster Profile | Cluster ID | Number of DHS sites in this cluster |
|---|---|---|
 | 569 | 2 |
 | 2055 | 2 |
 | 1605 | 2 |
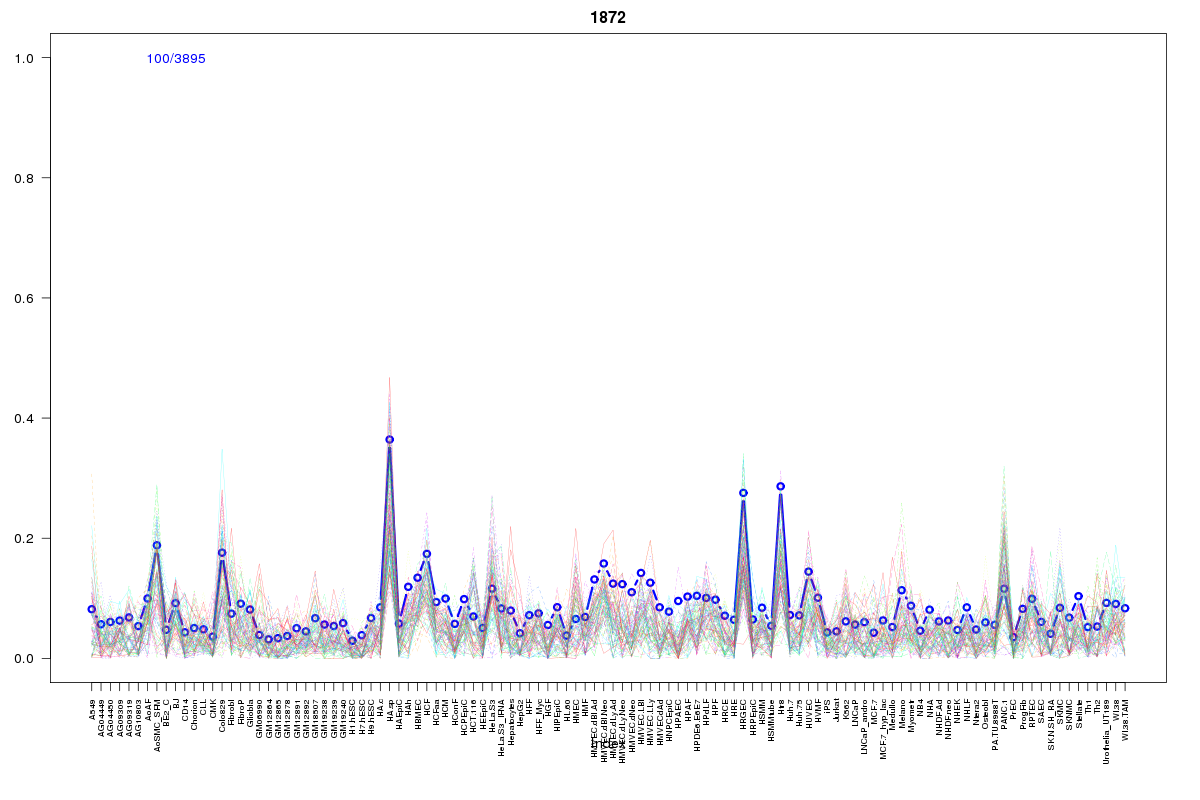 | 1872 | 2 |
 | 934 | 2 |
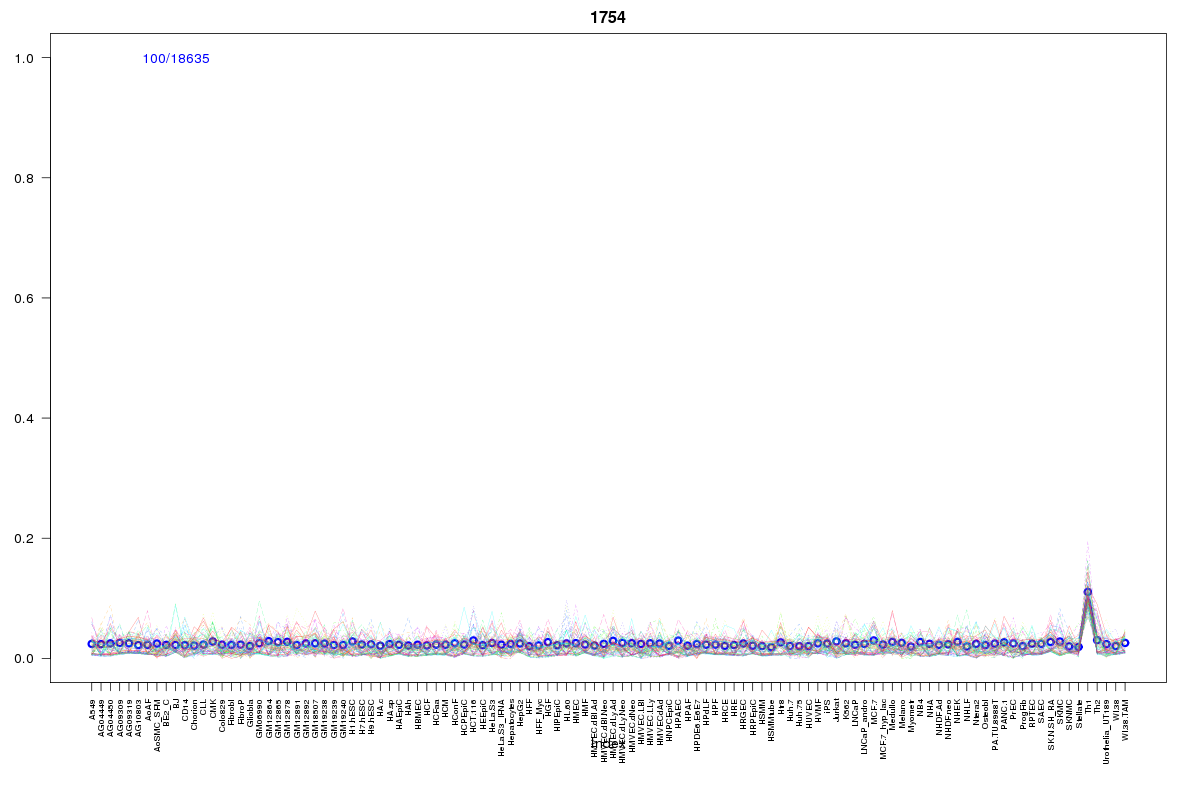 | 1754 | 2 |
 | 10 | 1 |
 | 687 | 1 |
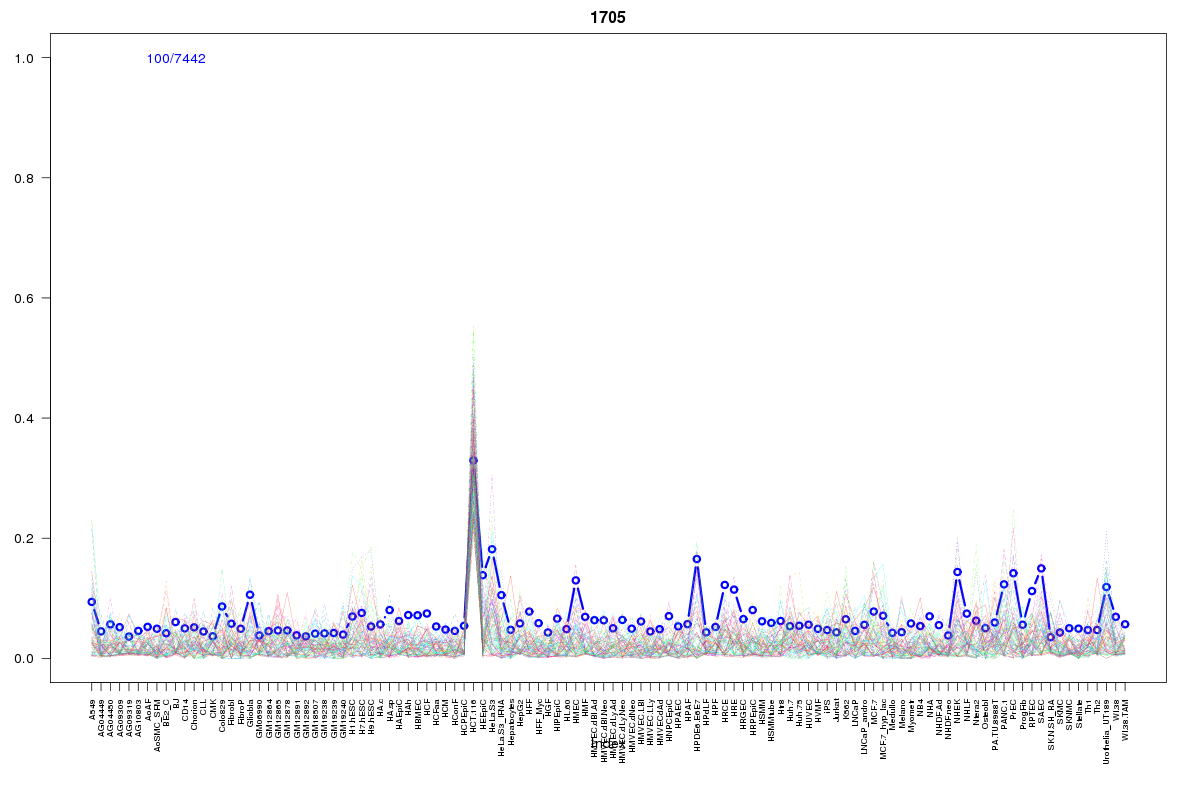 | 1705 | 1 |
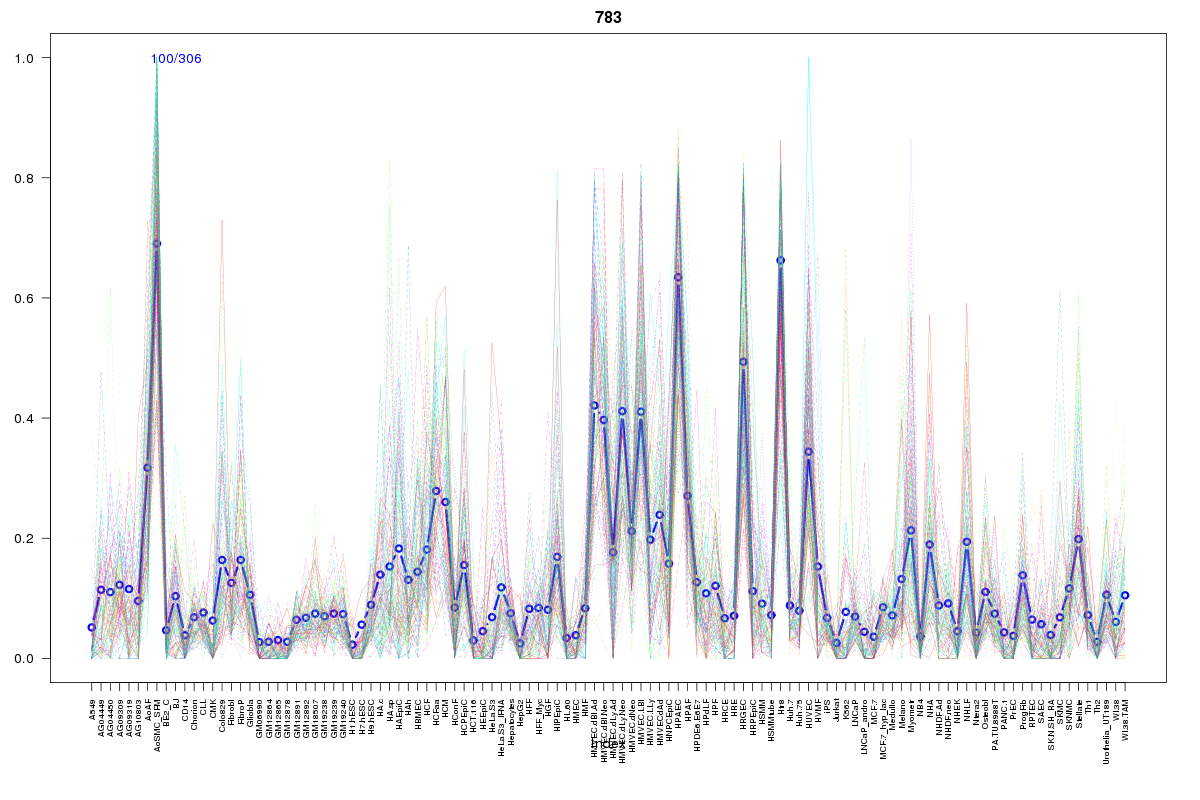 | 783 | 1 |
 | 2017 | 1 |
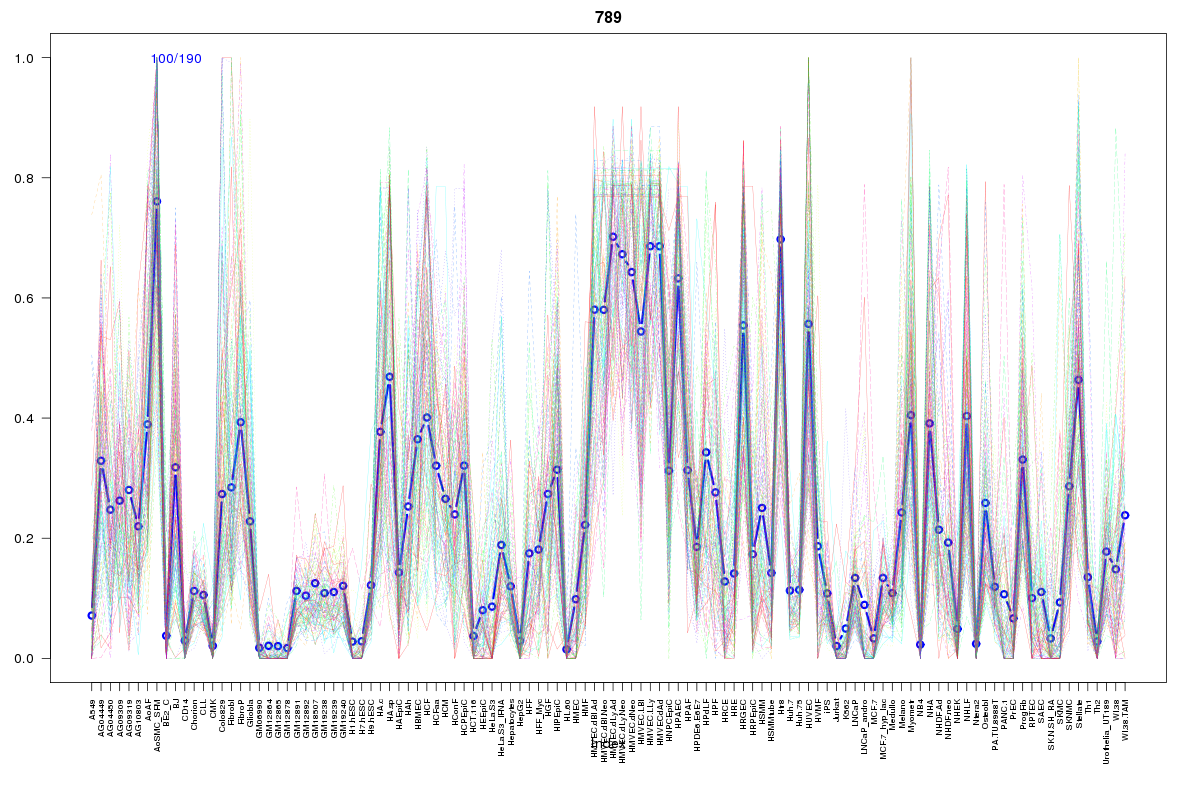 | 789 | 1 |
 | 881 | 1 |
 | 2211 | 1 |
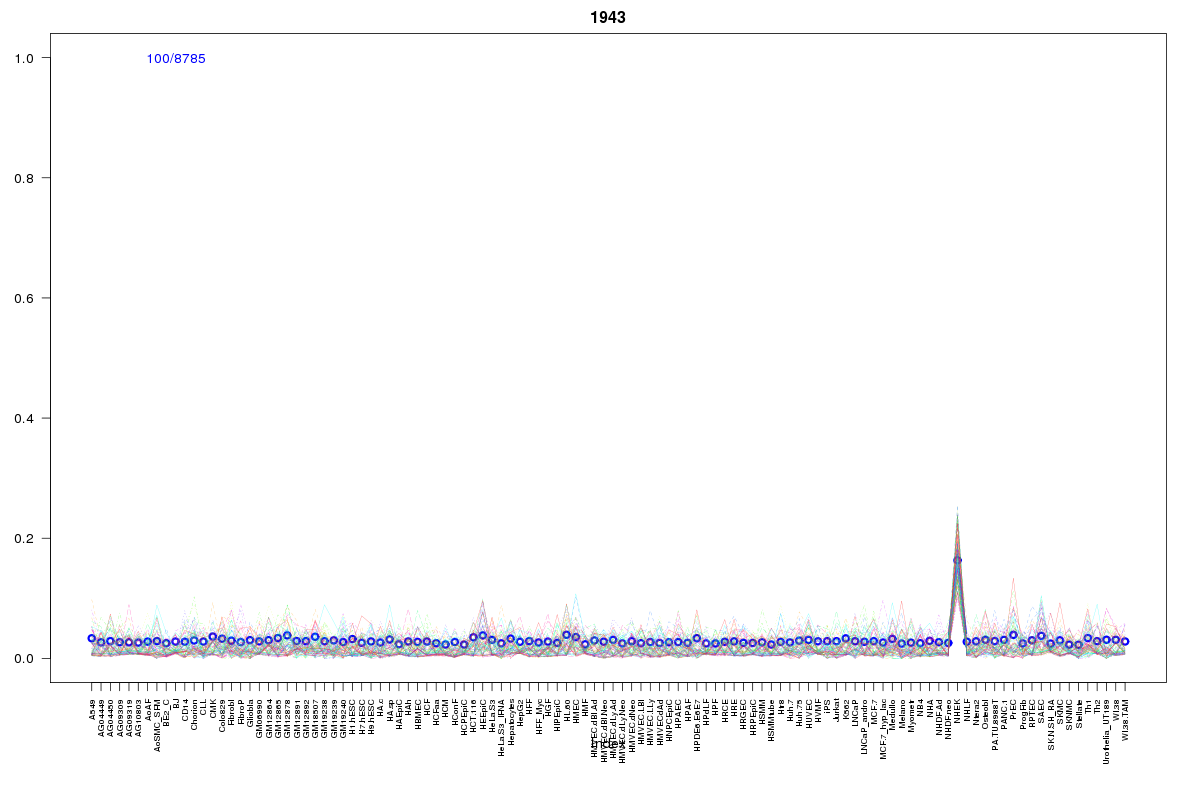 | 1943 | 1 |
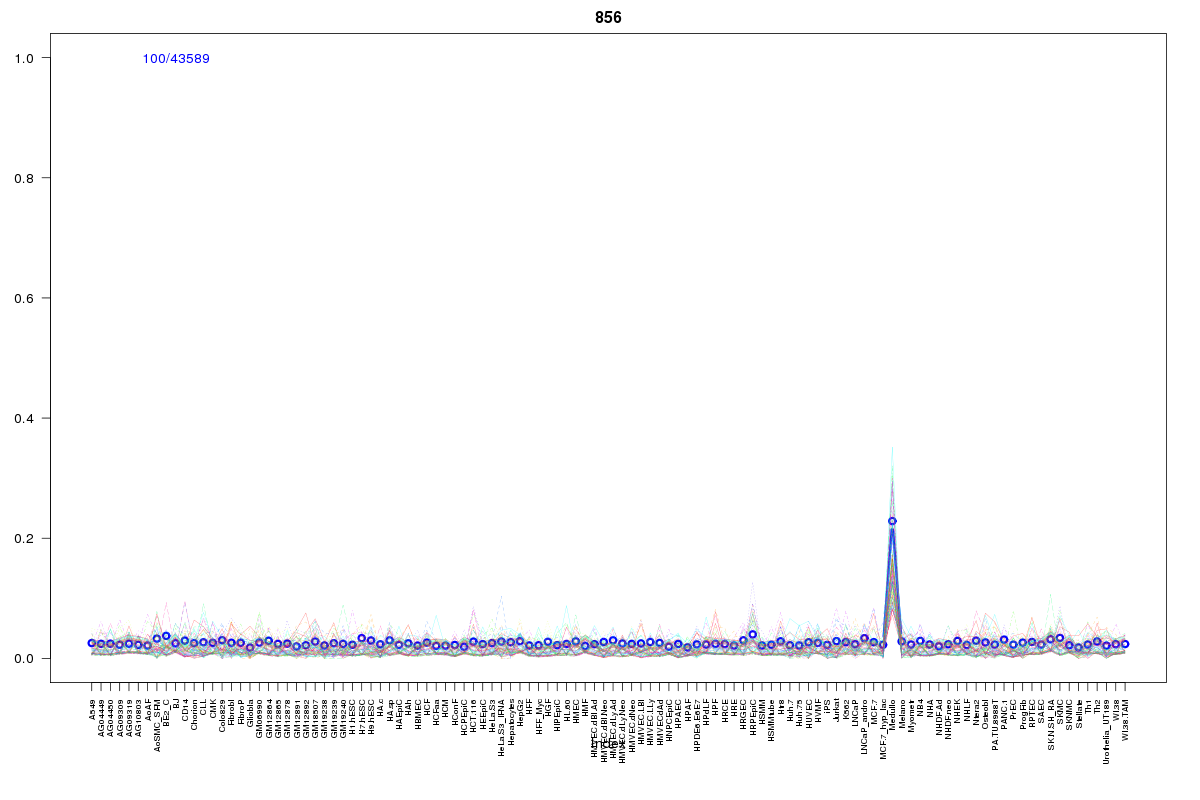 | 856 | 1 |
 | 2195 | 1 |
 | 568 | 1 |
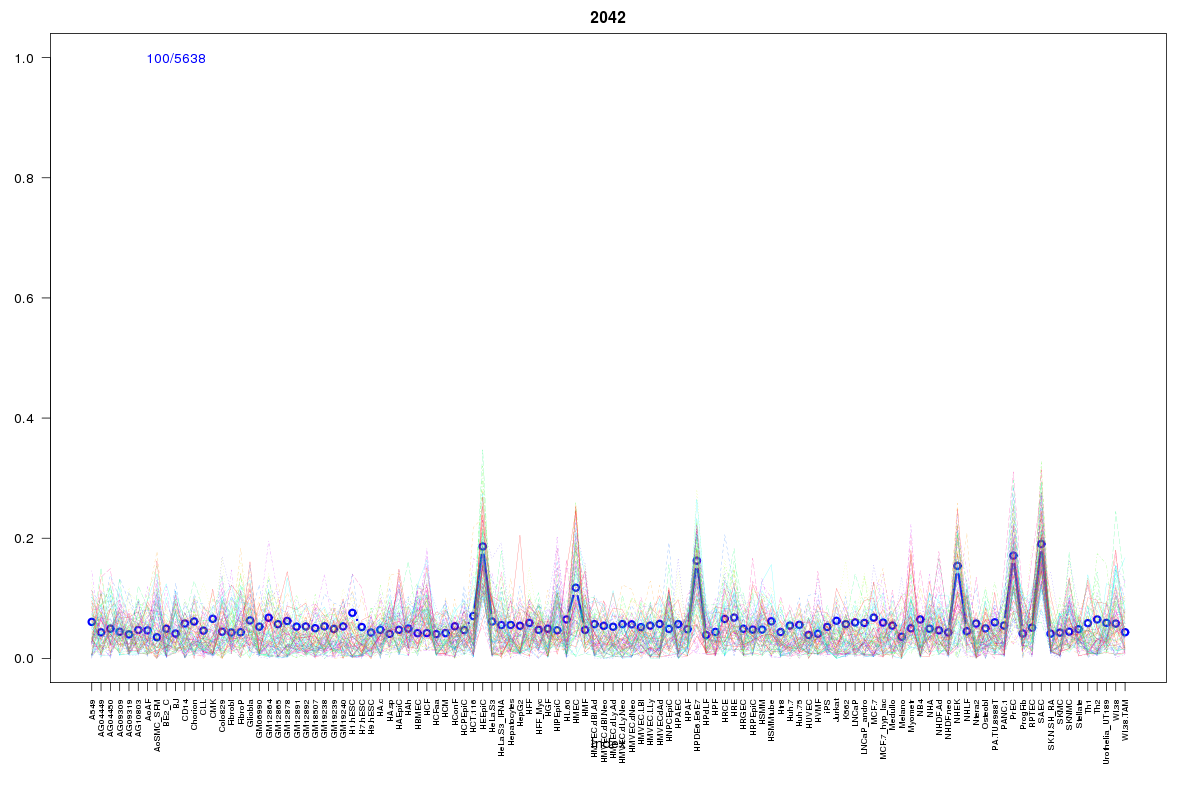 | 2042 | 1 |
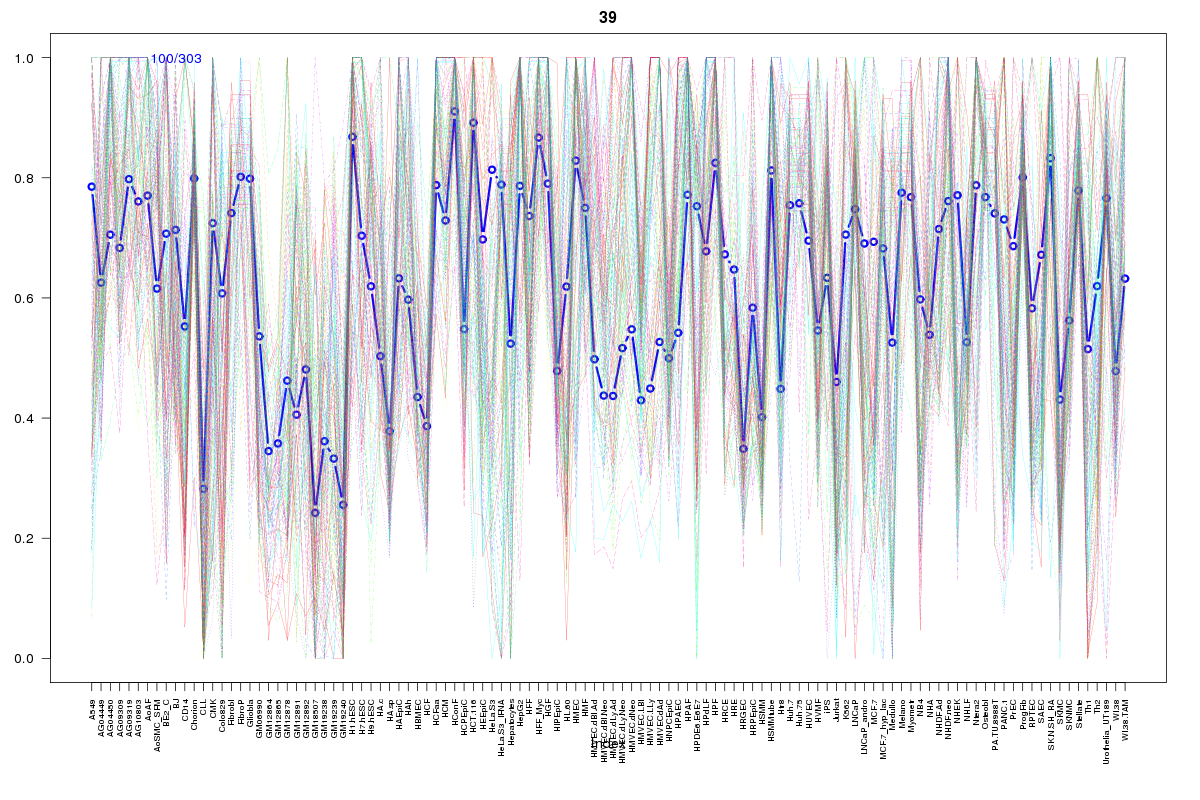 | 39 | 1 |
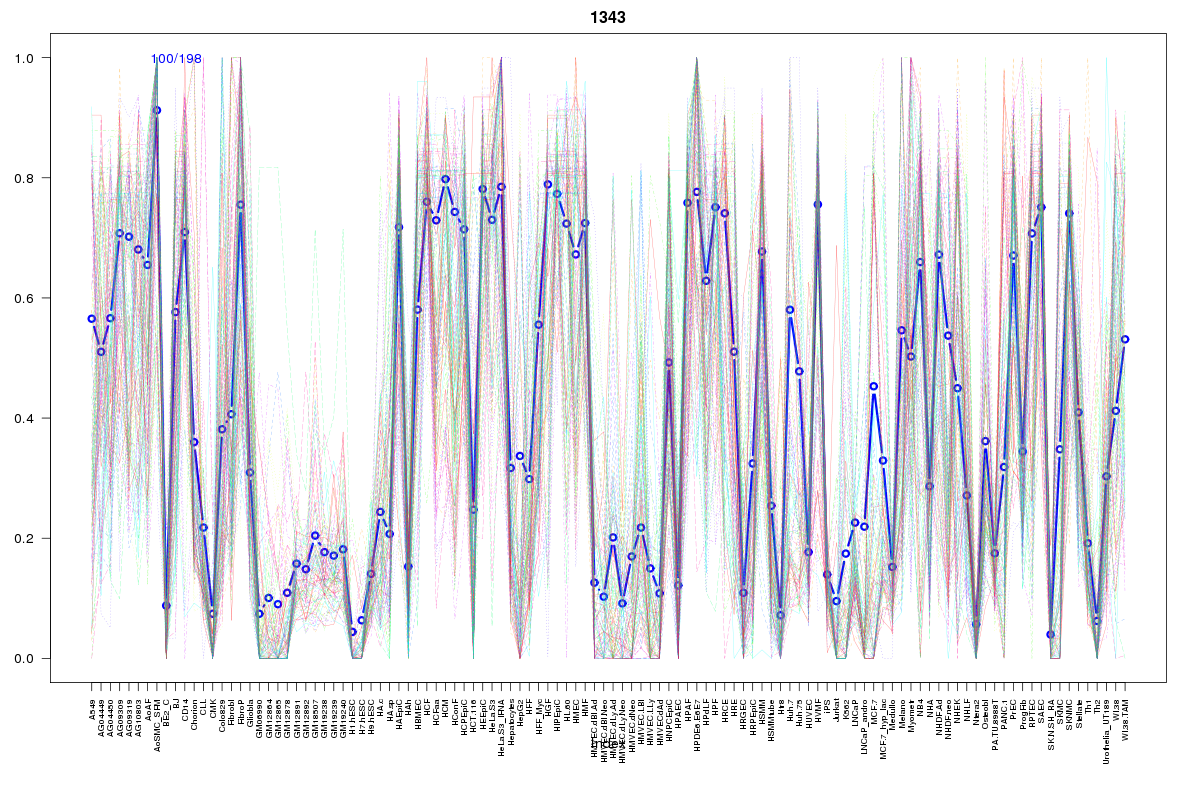 | 1343 | 1 |
 | 1659 | 1 |
 | 1755 | 1 |
 | 935 | 1 |
Resources
BED file downloads
Connects to 30 DHS sitesTop 10 Correlated DHS Sites
p-values indiciate significant higher or lower correlation| Location | Cluster | P-value |
|---|---|---|
| chr13:45922285-45922435 | 1943 | 0 |
| chr13:45910380-45910530 | 569 | 0 |
| chr13:45866400-45866550 | 1659 | 0.005 |
| chr13:45813160-45813310 | 1605 | 0.006 |
| chr13:45910920-45911070 | 1605 | 0.006 |
| chr13:45909920-45910070 | 881 | 0.006 |
| chr13:45827760-45827910 | 1343 | 0.011 |
| chr13:45907540-45907690 | 1705 | 0.012 |
| chr13:45910560-45910710 | 2055 | 0.013 |
| chr13:45914080-45914230 | 2211 | 0.013 |
| chr13:45881725-45881875 | 10 | 0.015 |
External Databases
UCSCEnsembl (ENSG00000133112)