Gene: GGACT
chr13: 101183809-101236251Expression Profile
(log scale)
Graphical Connections
Distribution of linked clusters:
You may find it interesting if many of the connected DHS sites belong to the same cluster.| Cluster Profile | Cluster ID | Number of DHS sites in this cluster |
|---|---|---|
 | 568 | 4 |
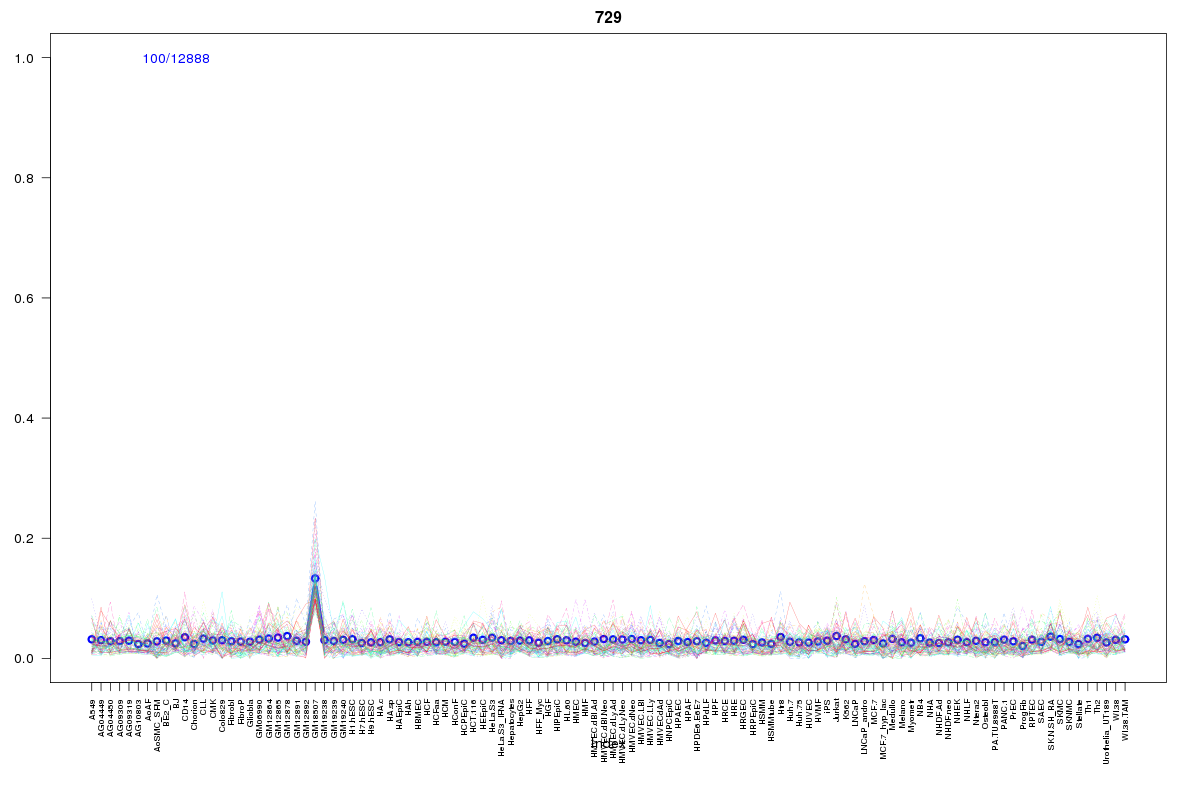 | 729 | 3 |
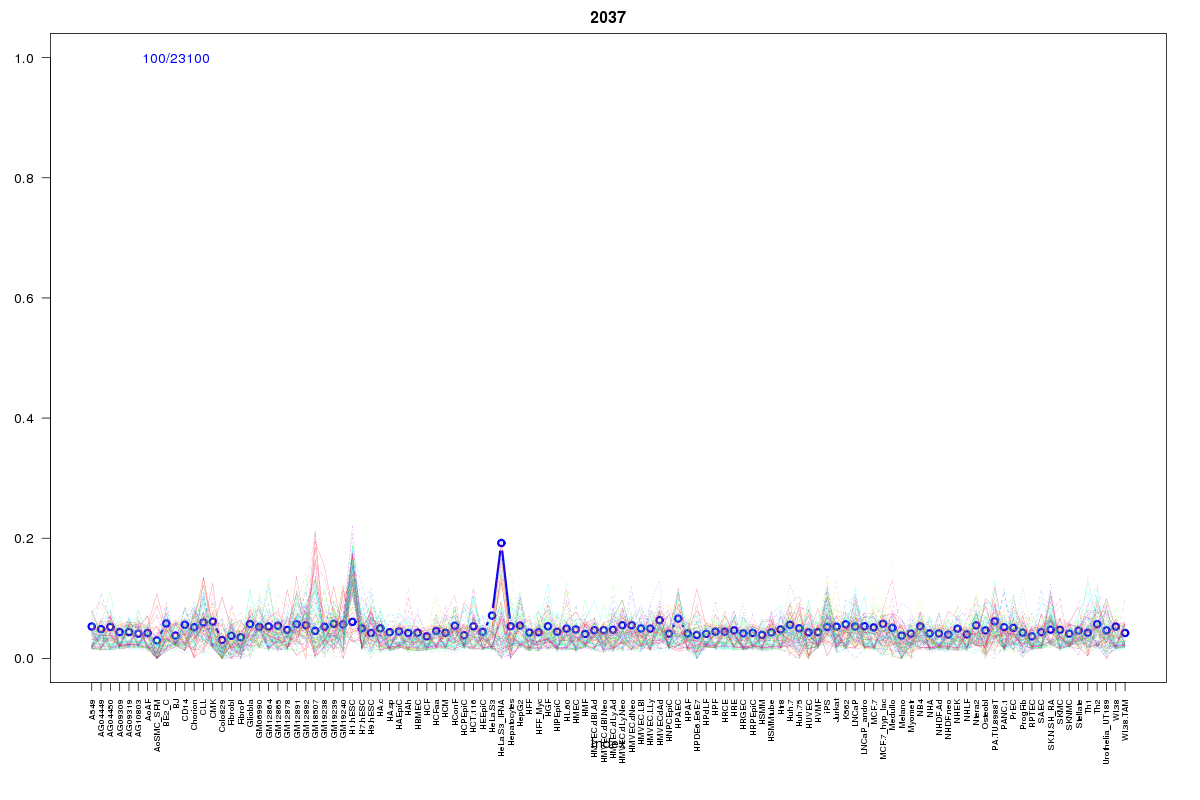 | 2037 | 2 |
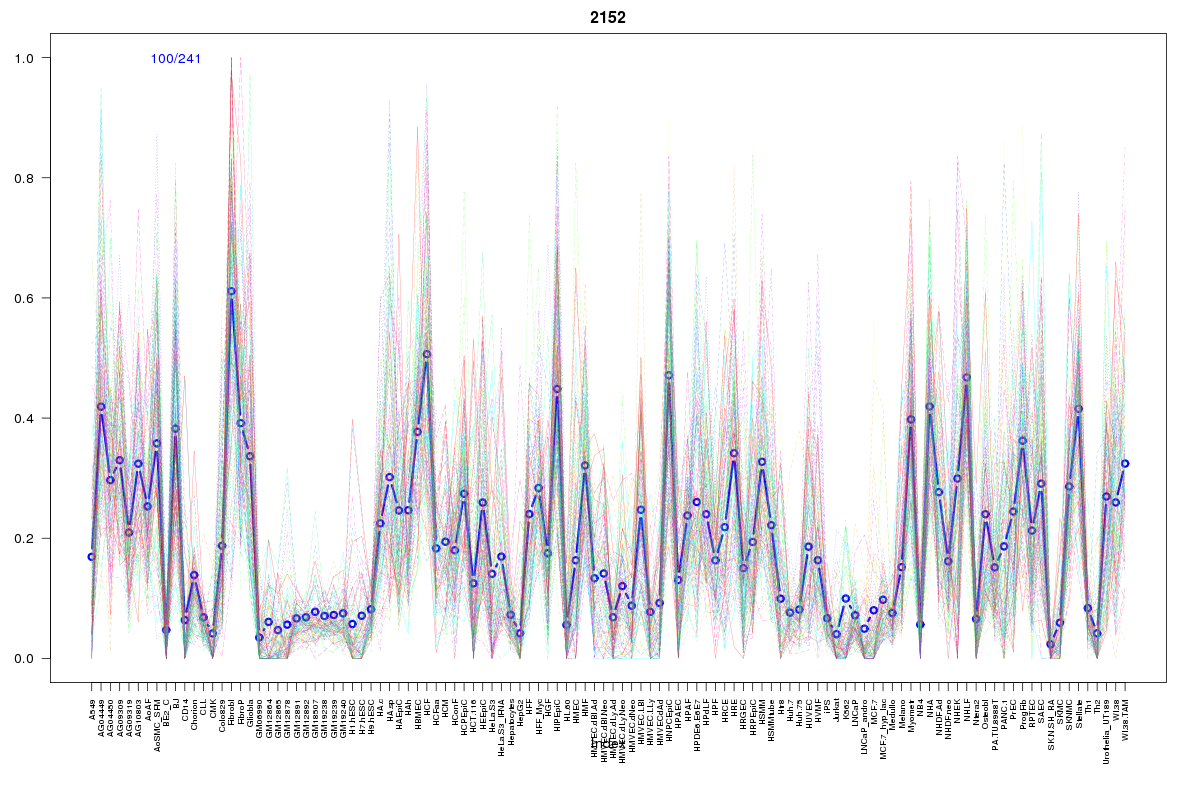 | 2152 | 2 |
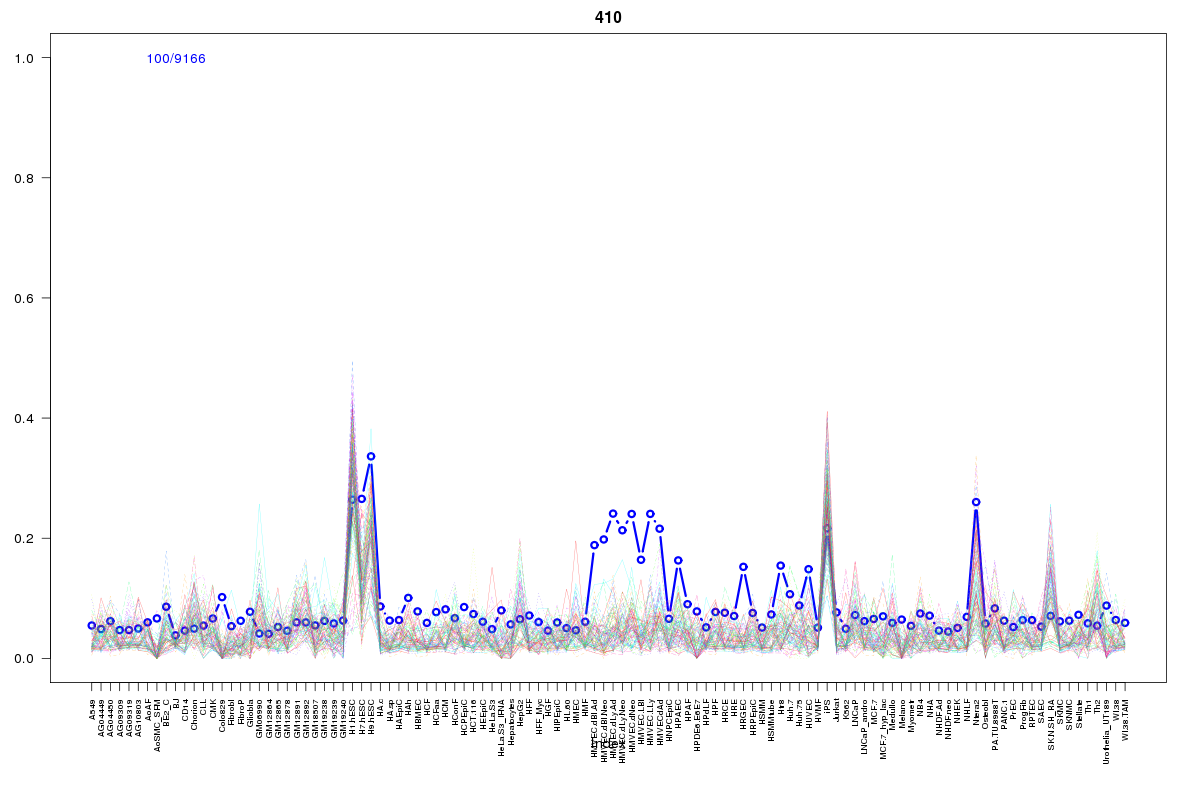 | 410 | 1 |
 | 1605 | 1 |
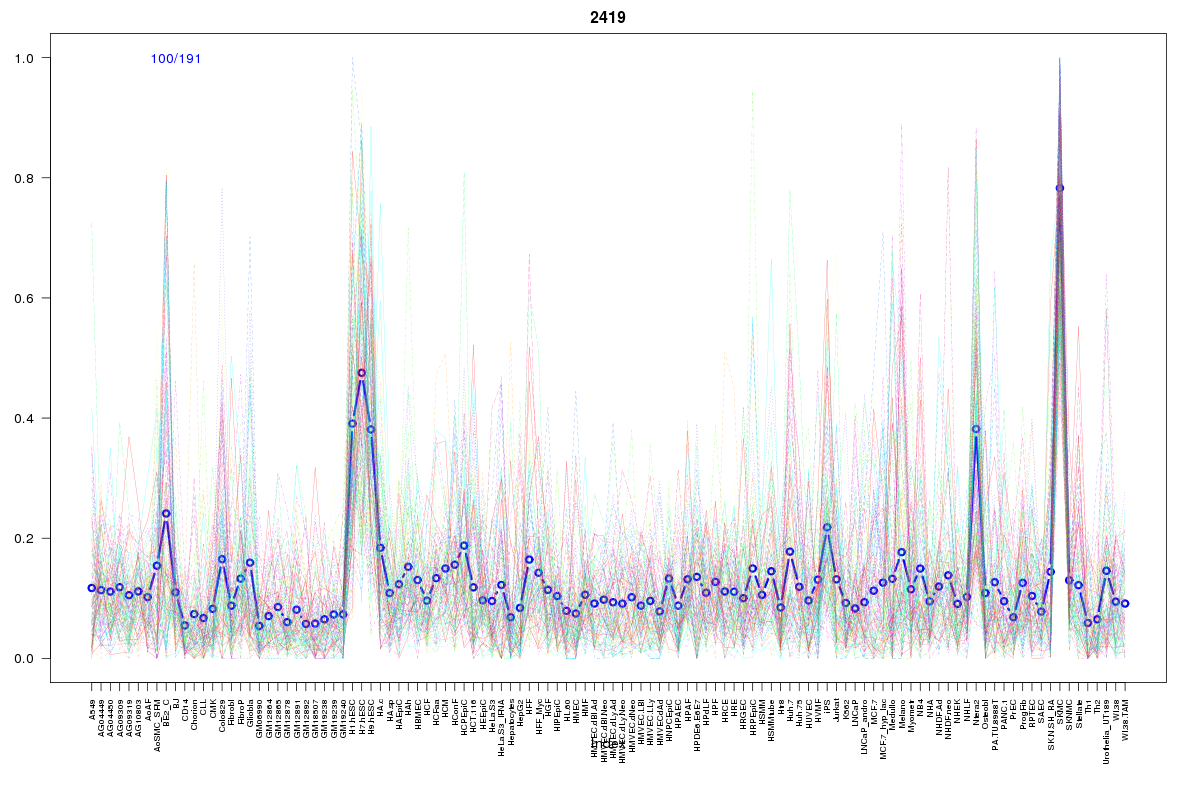 | 2419 | 1 |
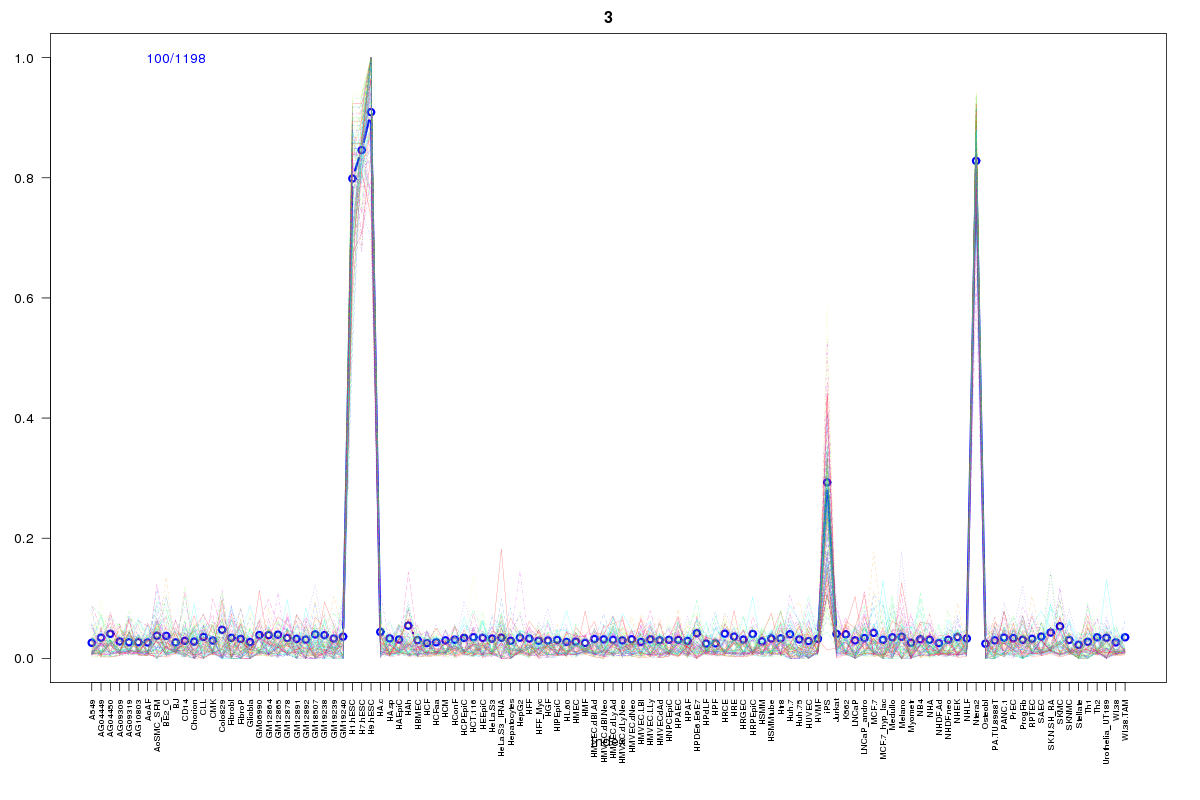 | 3 | 1 |
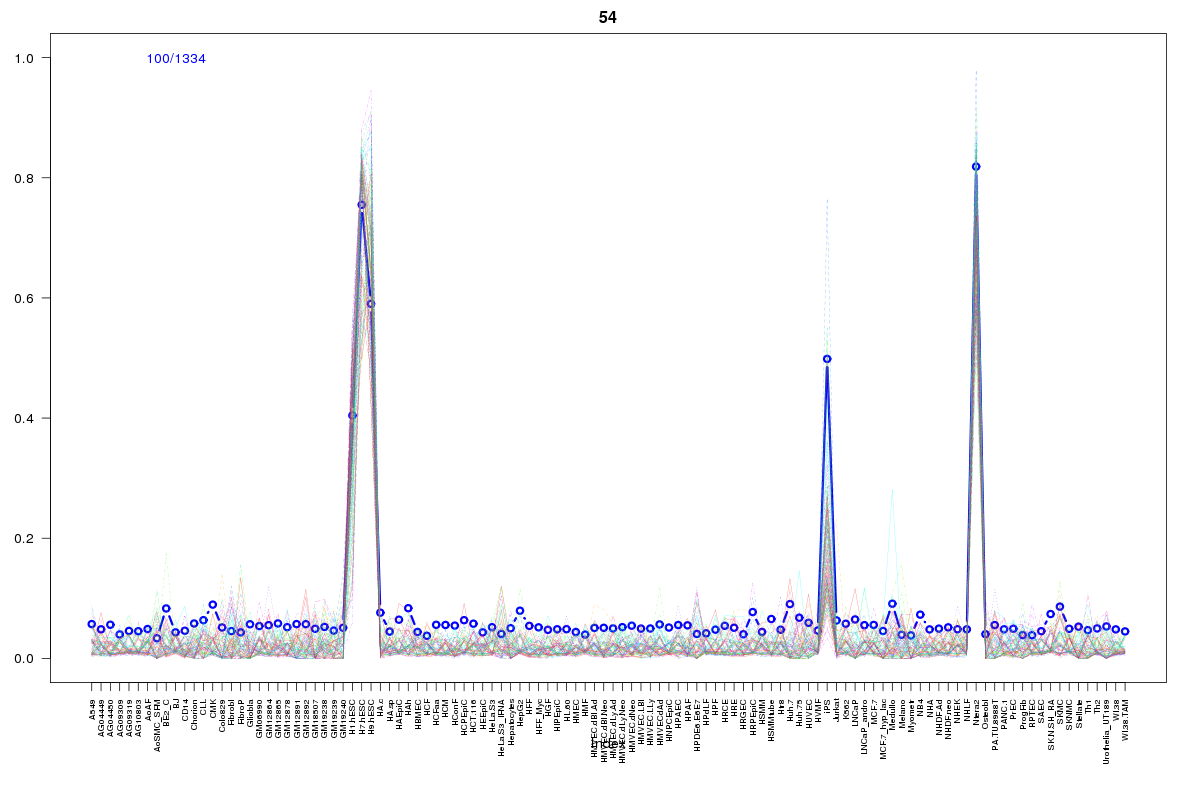 | 54 | 1 |
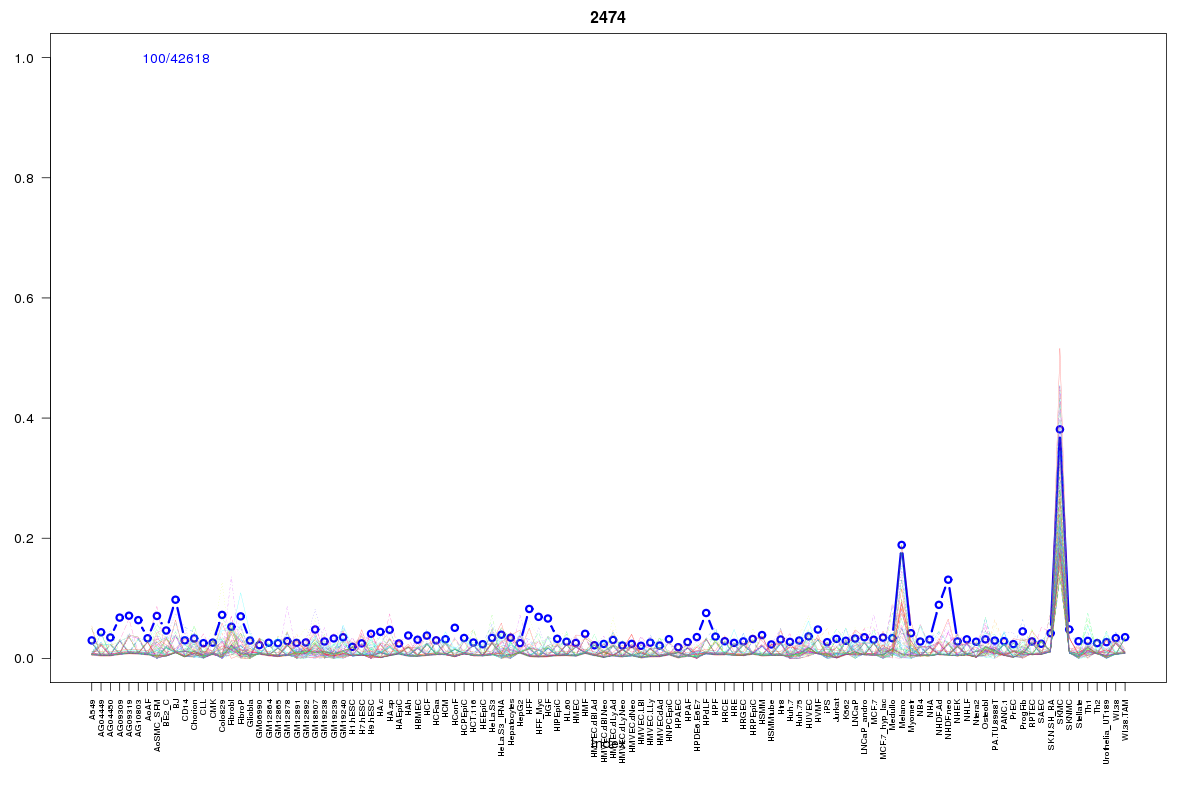 | 2474 | 1 |
 | 2468 | 1 |
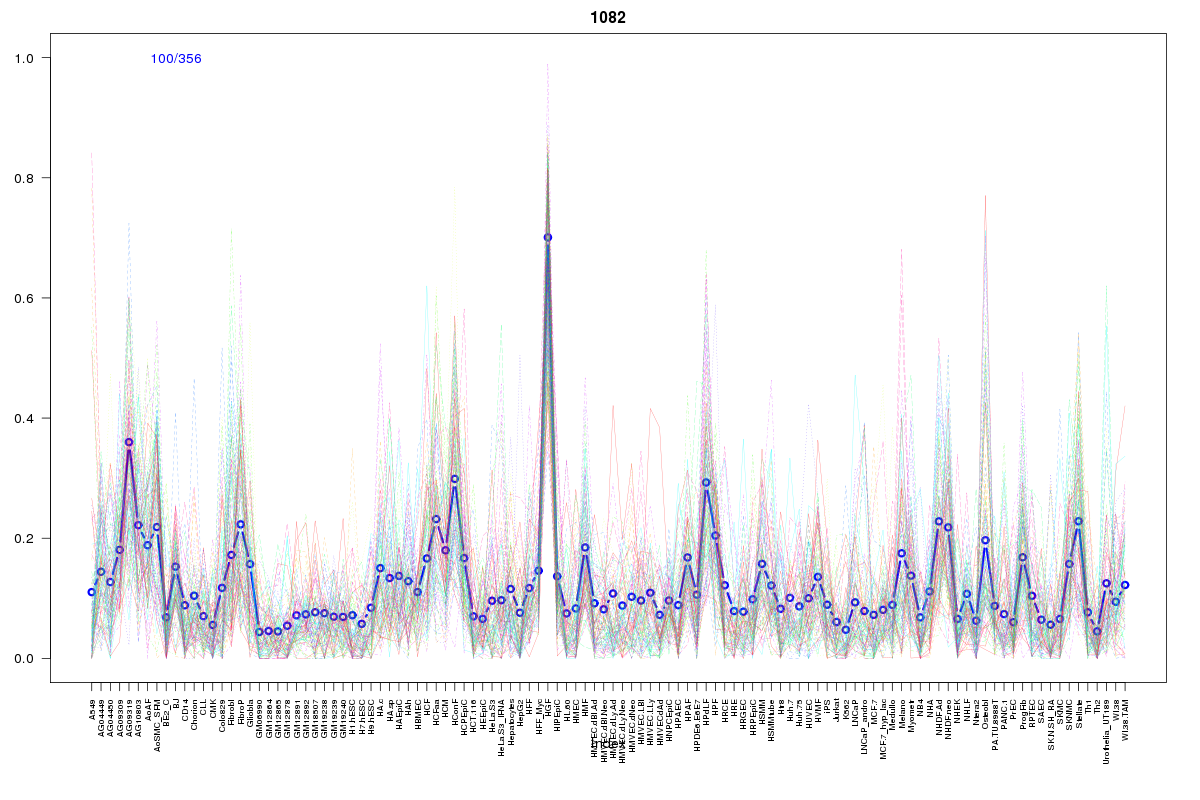 | 1082 | 1 |
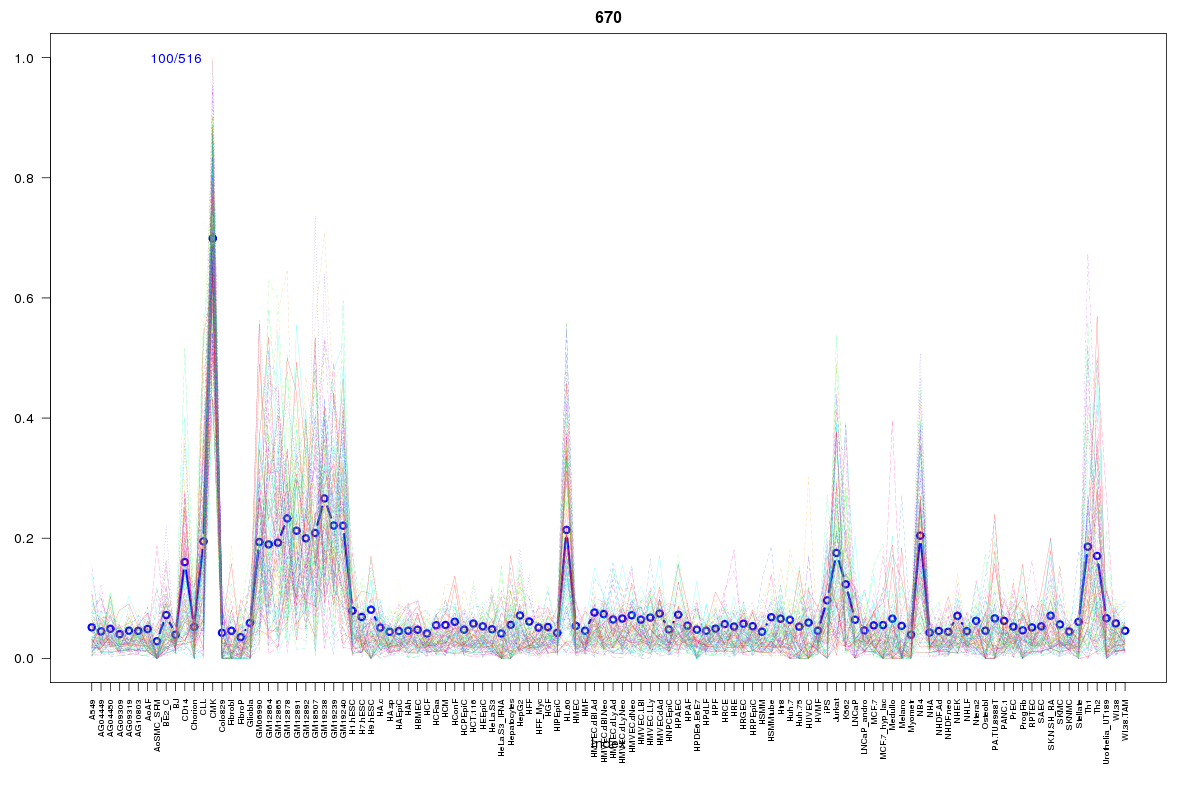 | 670 | 1 |
 | 2055 | 1 |
 | 2110 | 1 |
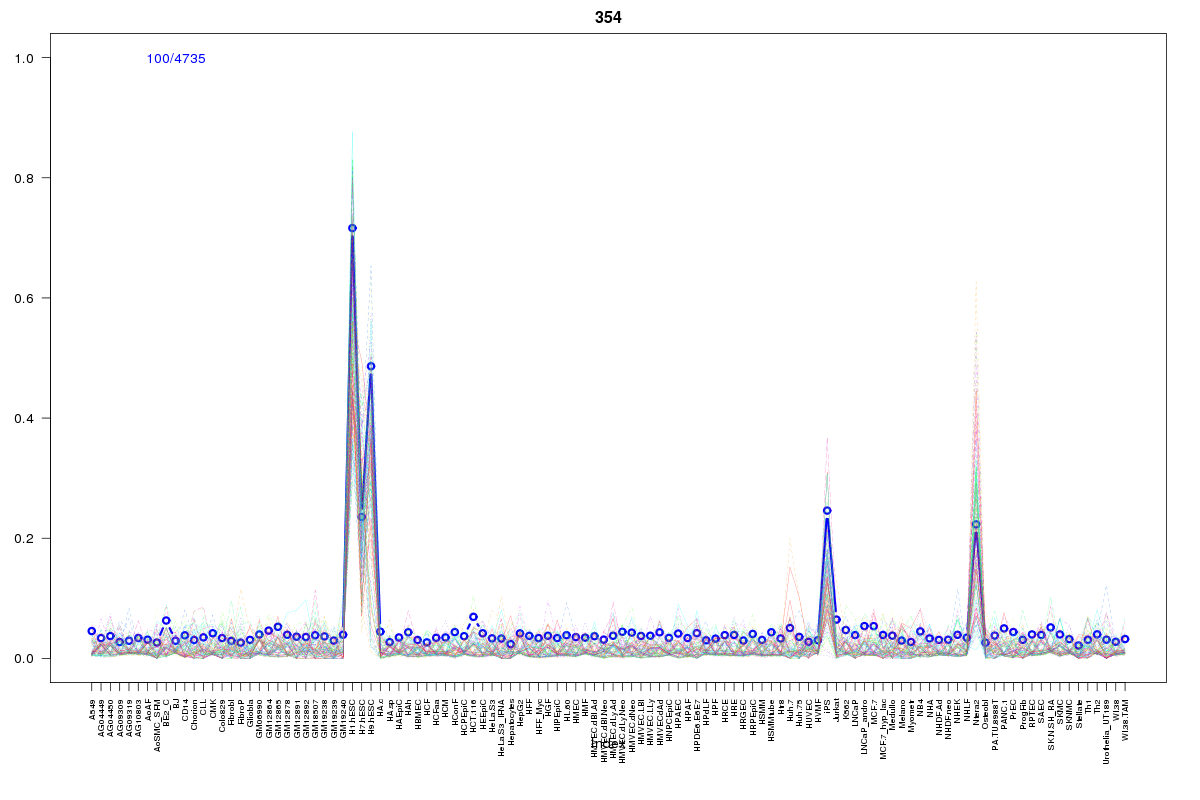 | 354 | 1 |
 | 1388 | 1 |
Resources
BED file downloads
Connects to 24 DHS sitesTop 10 Correlated DHS Sites
p-values indiciate significant higher or lower correlation| Location | Cluster | P-value |
|---|---|---|
| chr13:101285800-101285950 | 1388 | 0.005 |
| chr13:101282045-101282195 | 568 | 0.005 |
| chr13:101234360-101234510 | 568 | 0.006 |
| chr13:101265425-101265575 | 2055 | 0.008 |
| chr13:101262440-101262590 | 670 | 0.008 |
| chr13:101285645-101285795 | 2152 | 0.013 |
| chr13:101193645-101193795 | 729 | 0.014 |
| chr13:101095265-101095415 | 568 | 0.015 |
| chr13:101260745-101260895 | 2037 | 0.015 |
| chr13:101214605-101214755 | 2037 | 0.017 |
| chr13:101187840-101187990 | 1082 | 0.017 |
External Databases
UCSCEnsembl (ENSG00000134864)