Gene: SERPINI1
chr3: 167453030-167508390Expression Profile
(log scale)
Graphical Connections
Distribution of linked clusters:
You may find it interesting if many of the connected DHS sites belong to the same cluster.| Cluster Profile | Cluster ID | Number of DHS sites in this cluster |
|---|---|---|
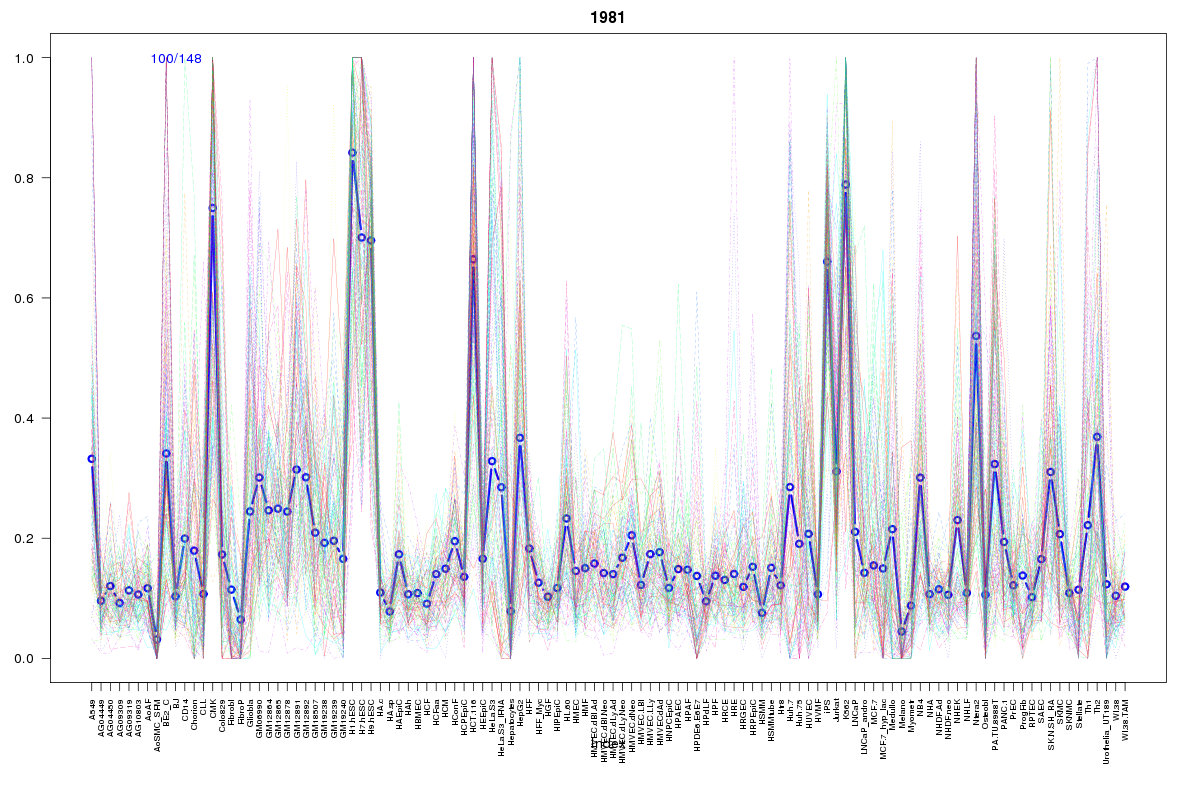 | 1981 | 1 |
 | 192 | 1 |
 | 1355 | 1 |
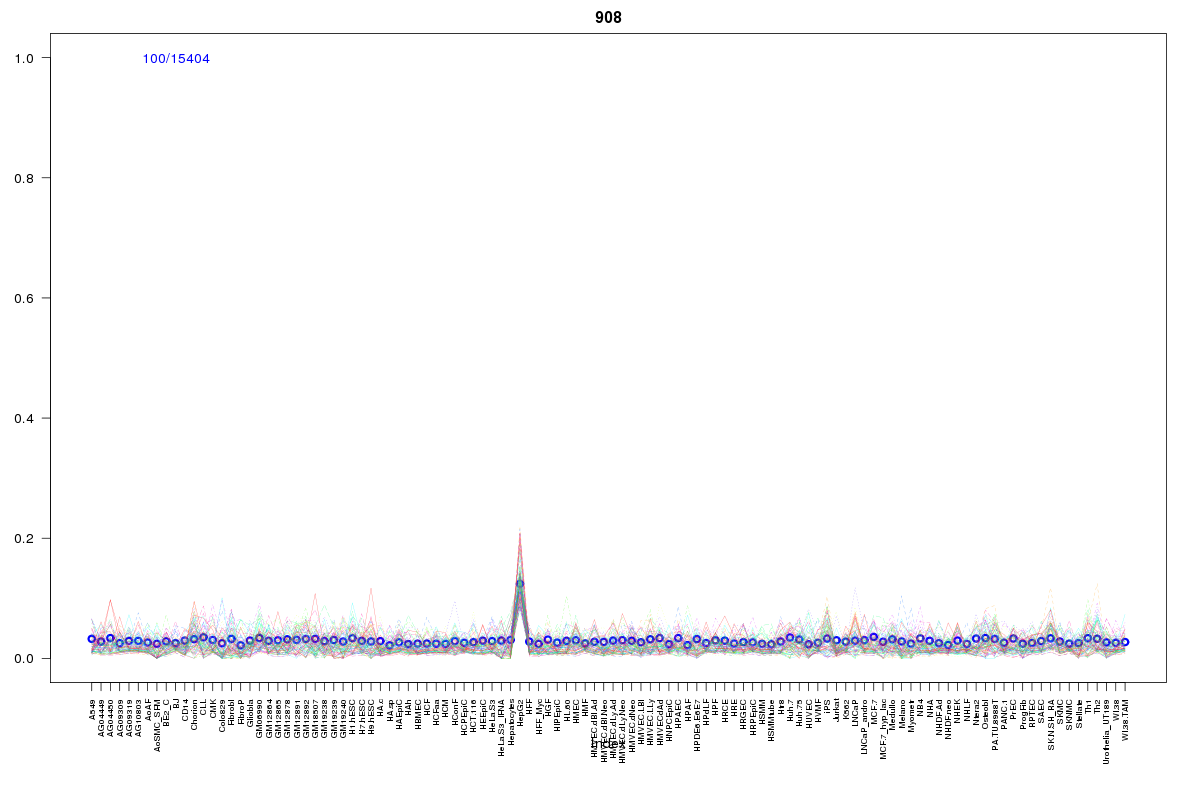 | 908 | 1 |
 | 15 | 1 |
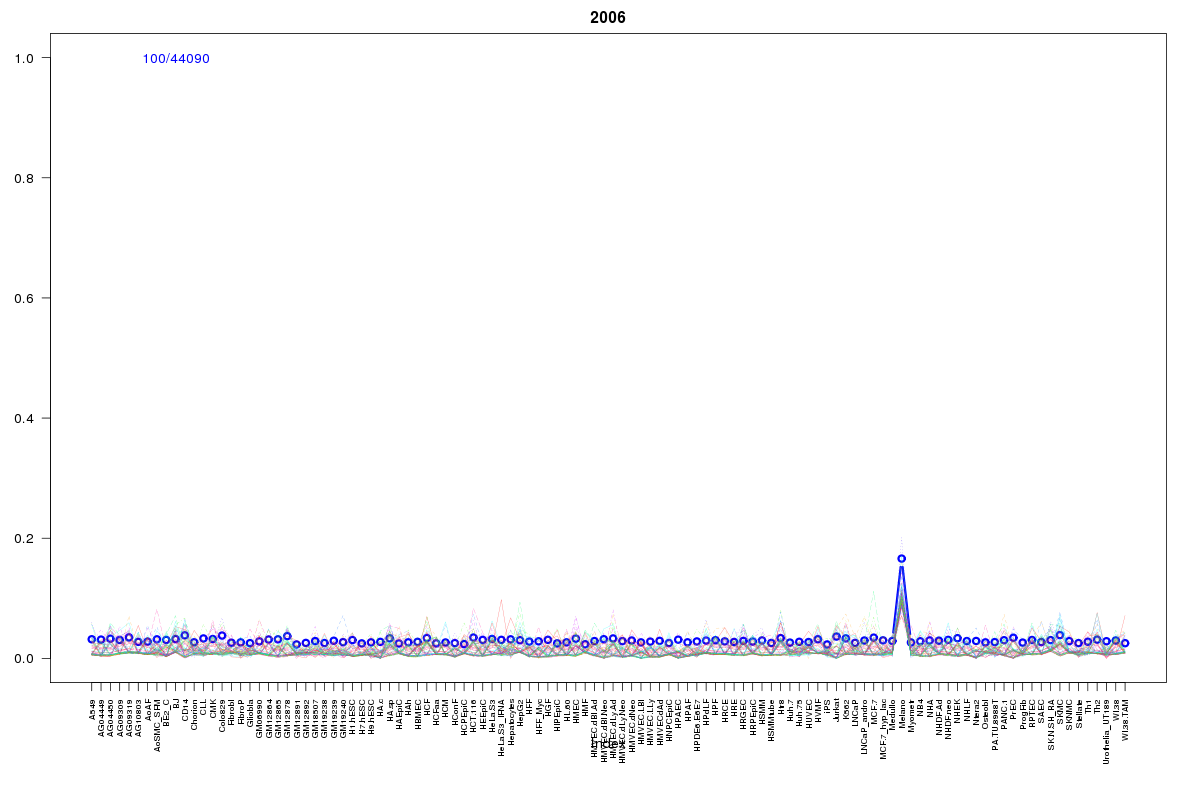 | 2006 | 1 |
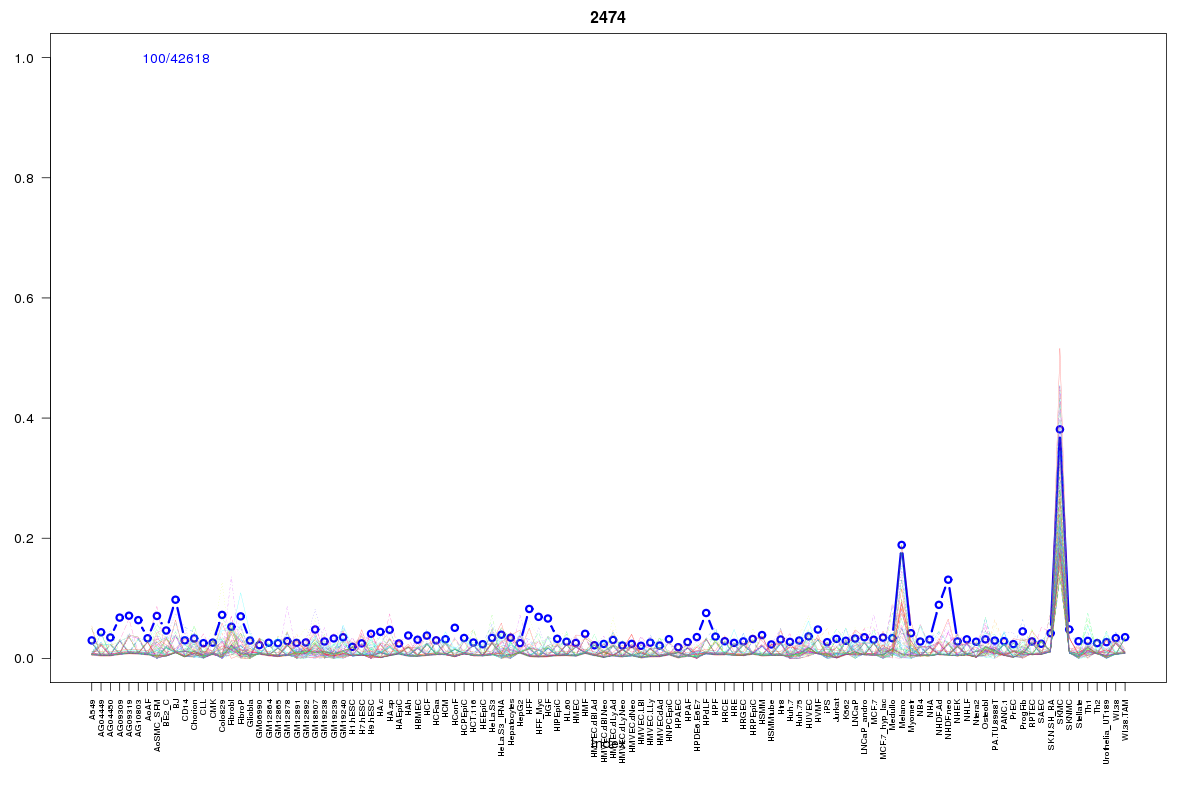 | 2474 | 1 |
Resources
BED file downloads
Connects to 7 DHS sitesTop 10 Correlated DHS Sites
p-values indiciate significant higher or lower correlation| Location | Cluster | P-value |
|---|---|---|
| chr3:167457080-167457230 | 1355 | 0.001 |
| chr3:167498545-167498695 | 2006 | 0.001 |
| chr3:167452925-167453075 | 192 | 0.004 |
| chr3:167478765-167478915 | 908 | 0.008 |
| chr3:167452185-167452335 | 1981 | 0.01 |
| chr3:167602360-167602510 | 2474 | 0.016 |
| chr3:167490940-167491090 | 15 | 0.017 |
External Databases
UCSCEnsembl (ENSG00000163536)