Gene: GTPBP8
chr3: 112709764-112720189Expression Profile
(log scale)
Graphical Connections
Distribution of linked clusters:
You may find it interesting if many of the connected DHS sites belong to the same cluster.| Cluster Profile | Cluster ID | Number of DHS sites in this cluster |
|---|---|---|
 | 626 | 4 |
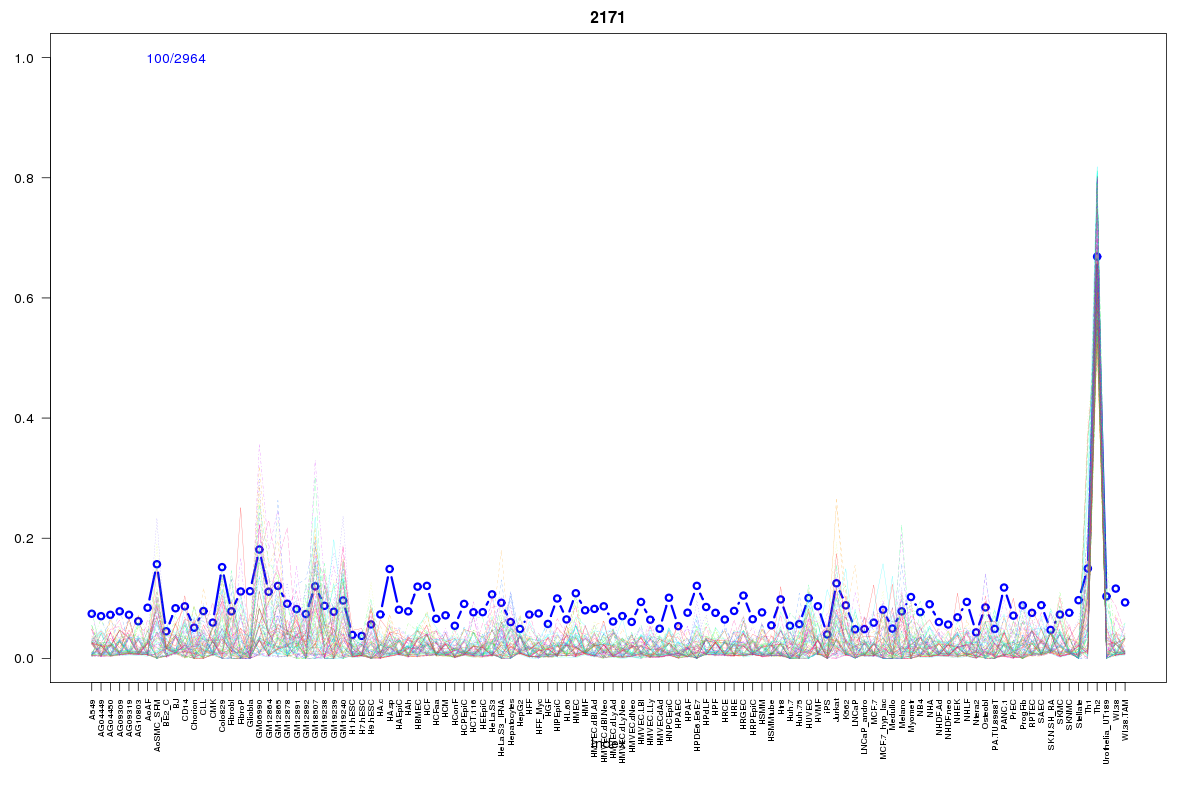 | 2171 | 2 |
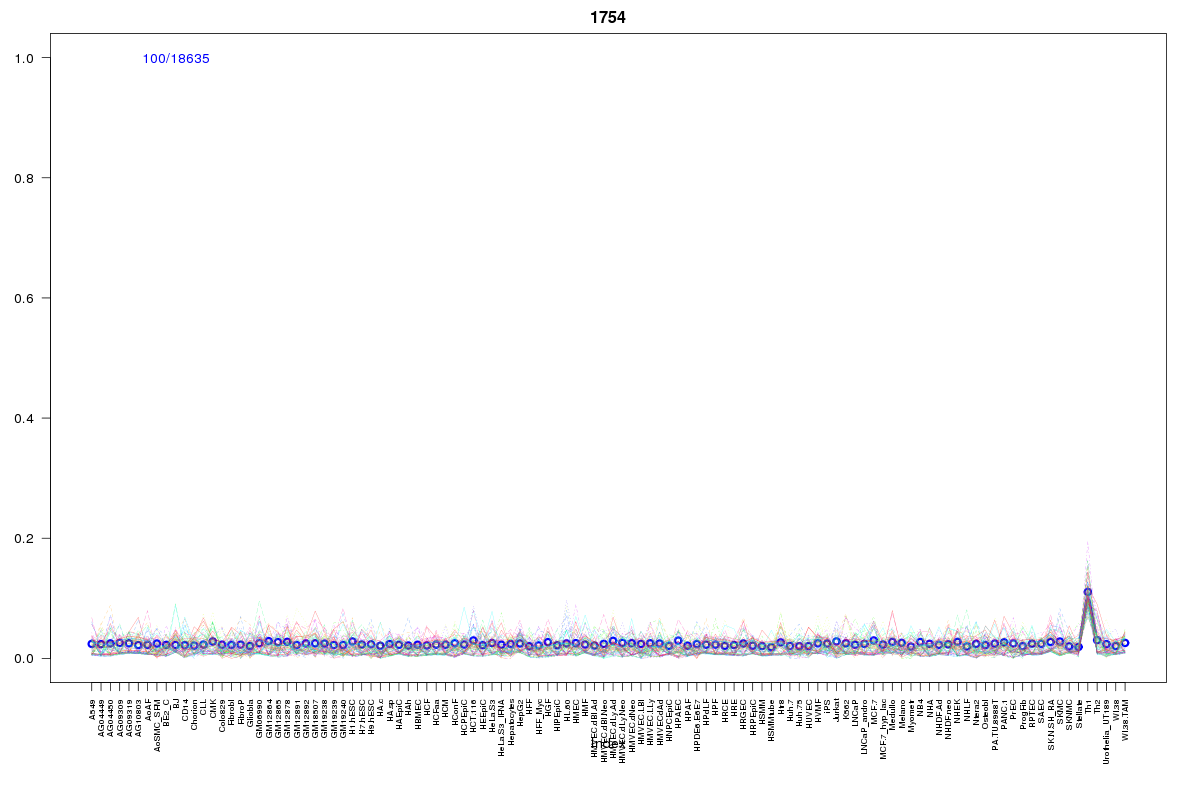 | 1754 | 2 |
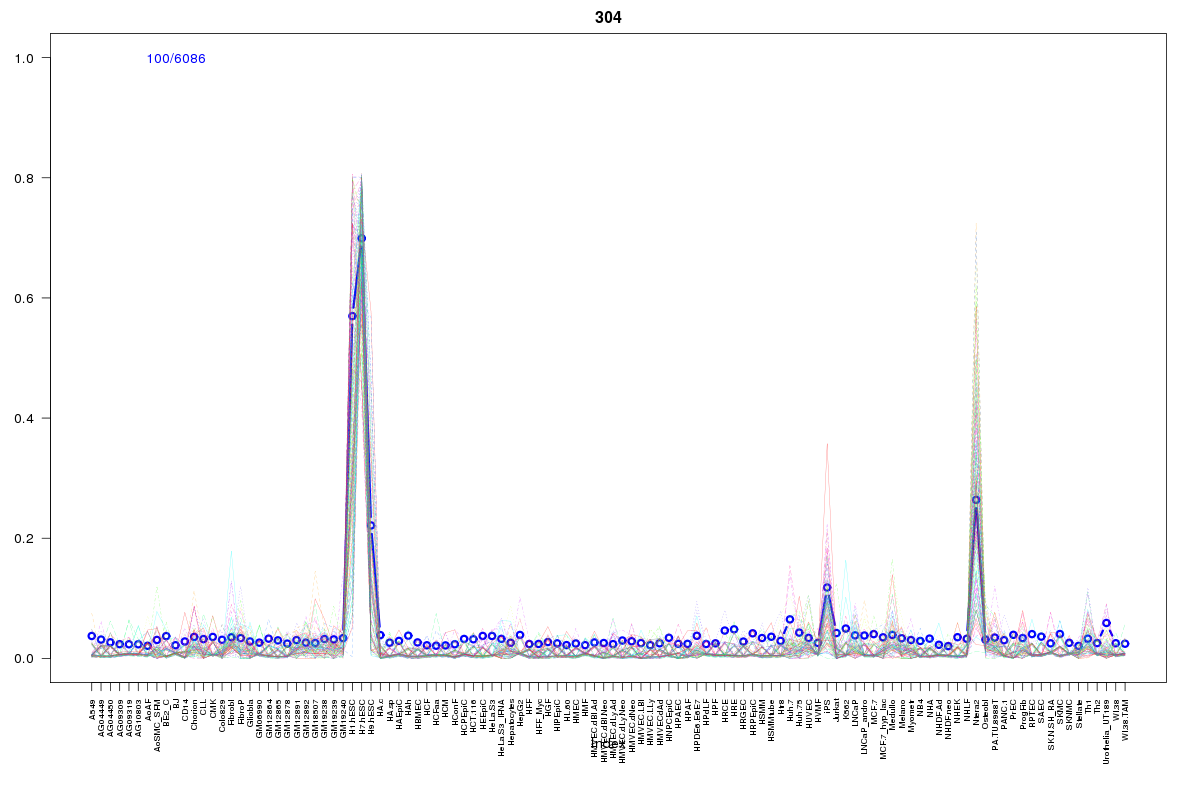 | 304 | 1 |
 | 2068 | 1 |
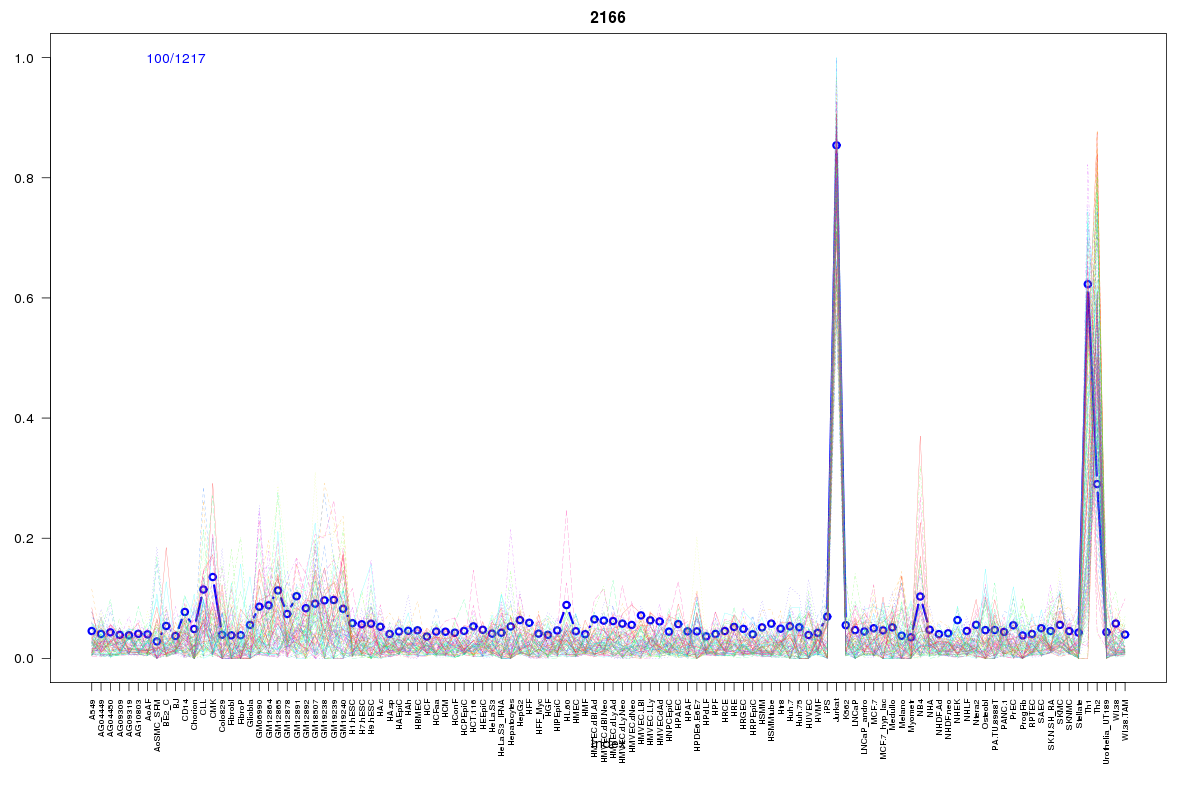 | 2166 | 1 |
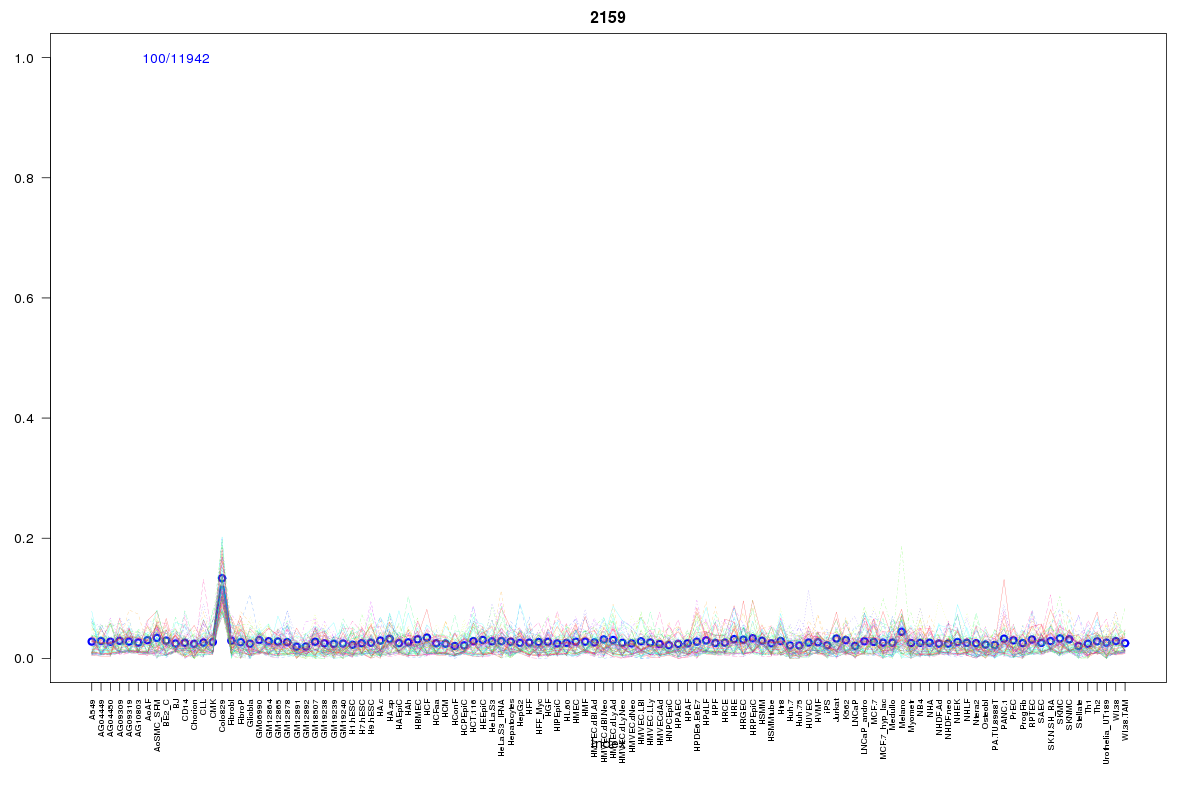 | 2159 | 1 |
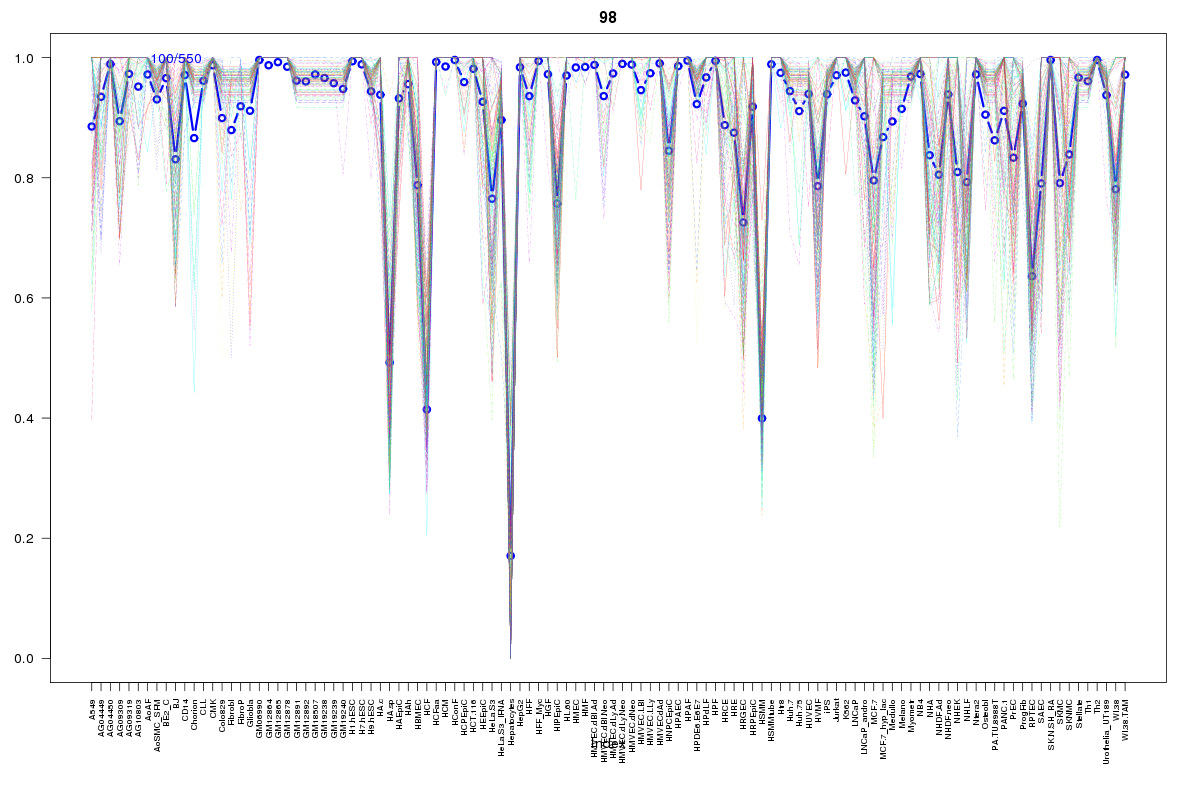 | 98 | 1 |
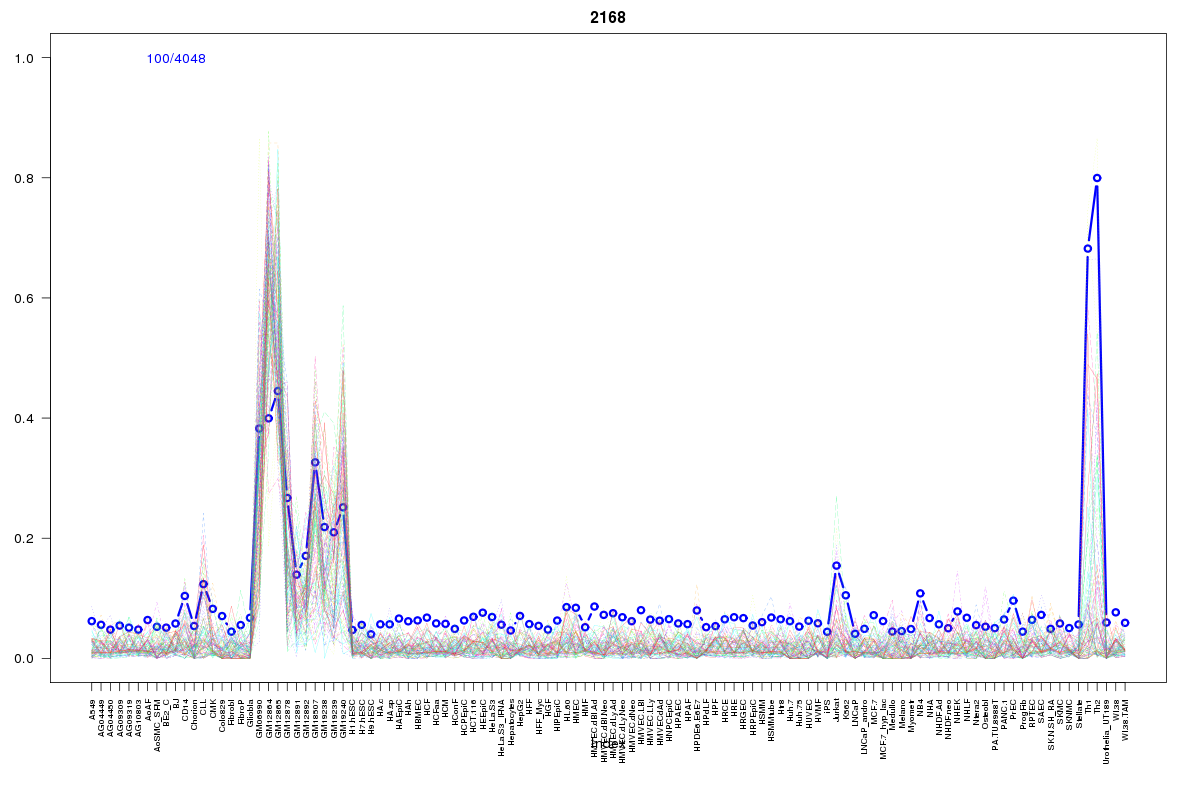 | 2168 | 1 |
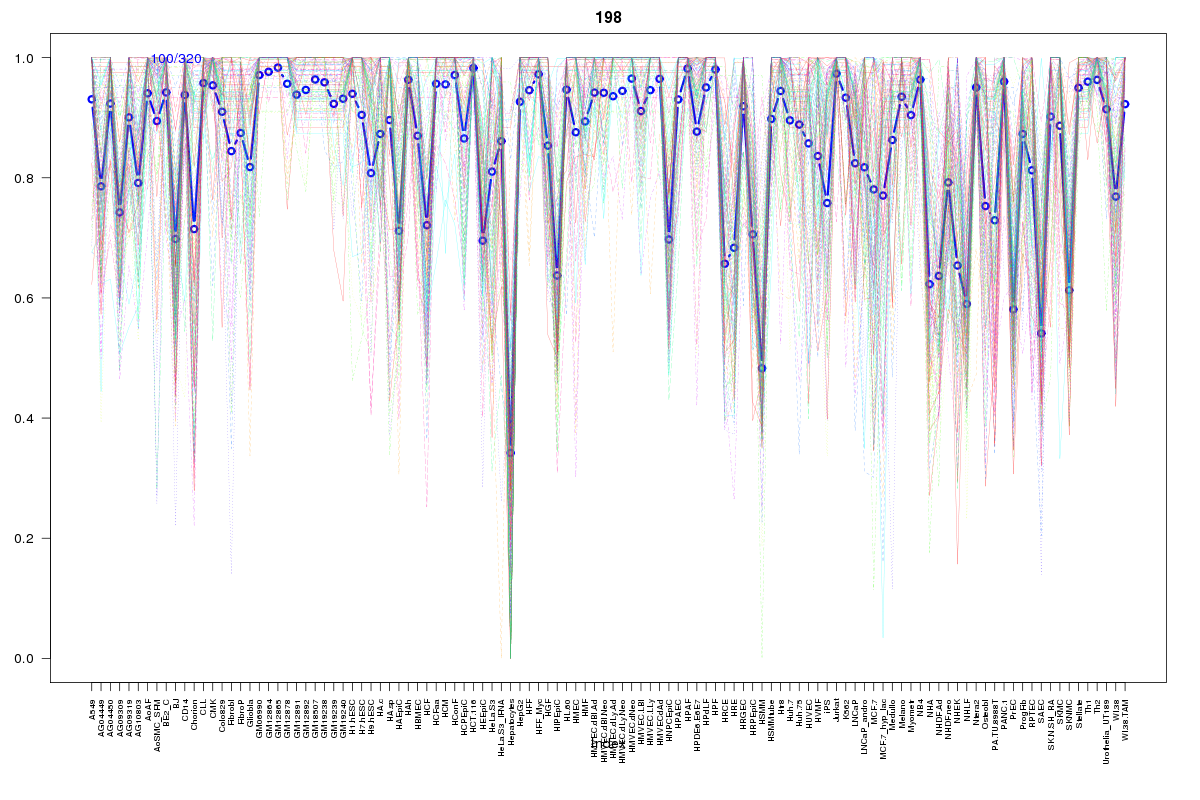 | 198 | 1 |
Resources
BED file downloads
Connects to 15 DHS sitesTop 10 Correlated DHS Sites
p-values indiciate significant higher or lower correlation| Location | Cluster | P-value |
|---|---|---|
| chr3:112724640-112724790 | 2166 | 0 |
| chr3:112724460-112724610 | 2068 | 0 |
| chr3:112788365-112788515 | 1754 | 0.003 |
| chr3:112704725-112704875 | 1754 | 0.009 |
| chr3:112725300-112725450 | 2159 | 0.013 |
| chr3:112721600-112721750 | 304 | 0.015 |
| chr3:112692220-112692370 | 2168 | 0.018 |
| chr3:112677740-112677890 | 2171 | 0.021 |
| chr3:112693860-112694010 | 2171 | 0.022 |
| chr3:112709700-112709850 | 198 | 0.023 |
| chr3:112738520-112738670 | 98 | 0.024 |
External Databases
UCSCEnsembl (ENSG00000163607)