Gene: AGPAT1
chr6: 32135988-32145873Expression Profile
(log scale)
Graphical Connections
Distribution of linked clusters:
You may find it interesting if many of the connected DHS sites belong to the same cluster.| Cluster Profile | Cluster ID | Number of DHS sites in this cluster |
|---|---|---|
 | 2059 | 2 |
 | 626 | 2 |
 | 1724 | 1 |
 | 149 | 1 |
 | 2055 | 1 |
 | 919 | 1 |
 | 881 | 1 |
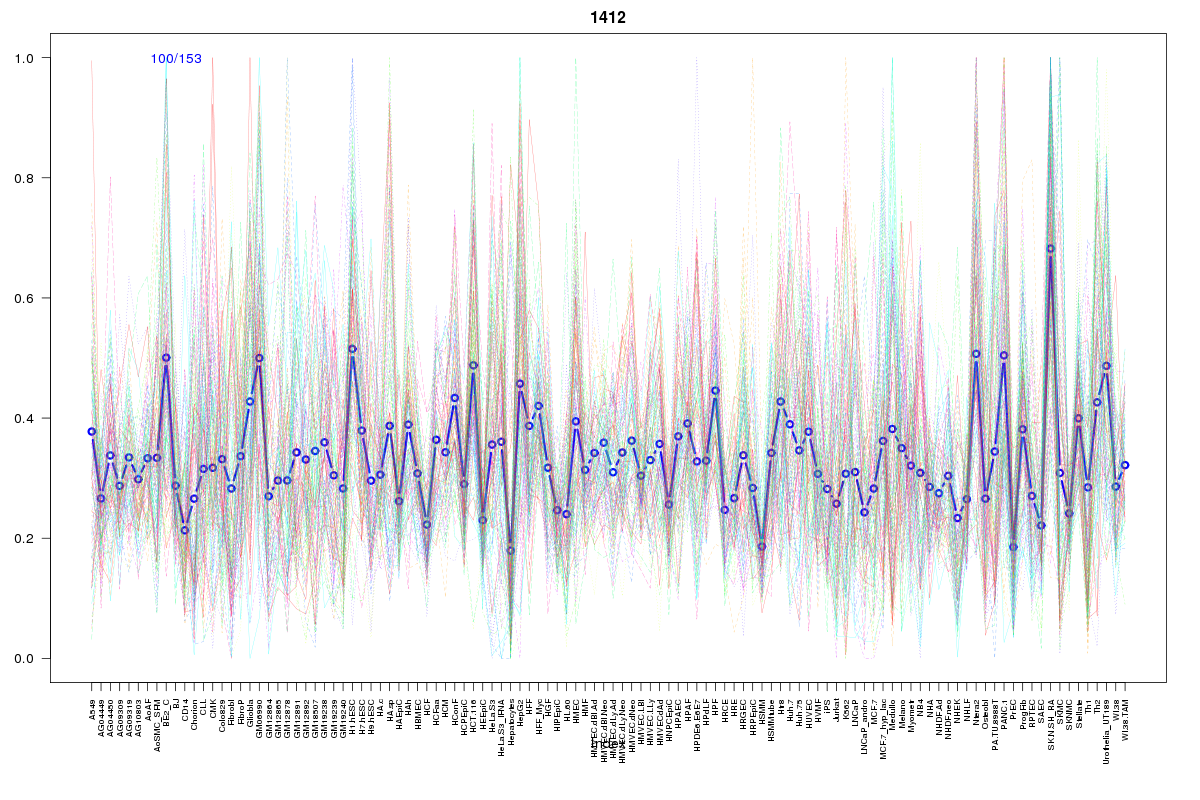 | 1412 | 1 |
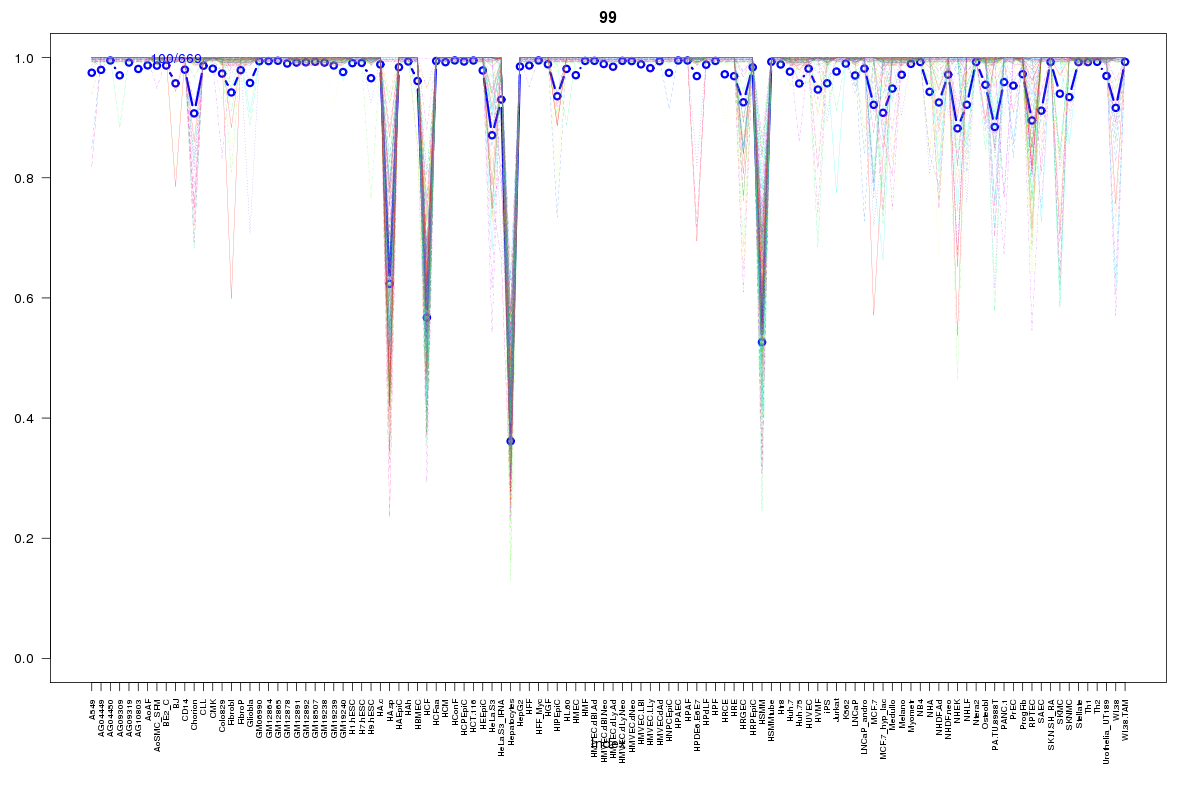 | 99 | 1 |
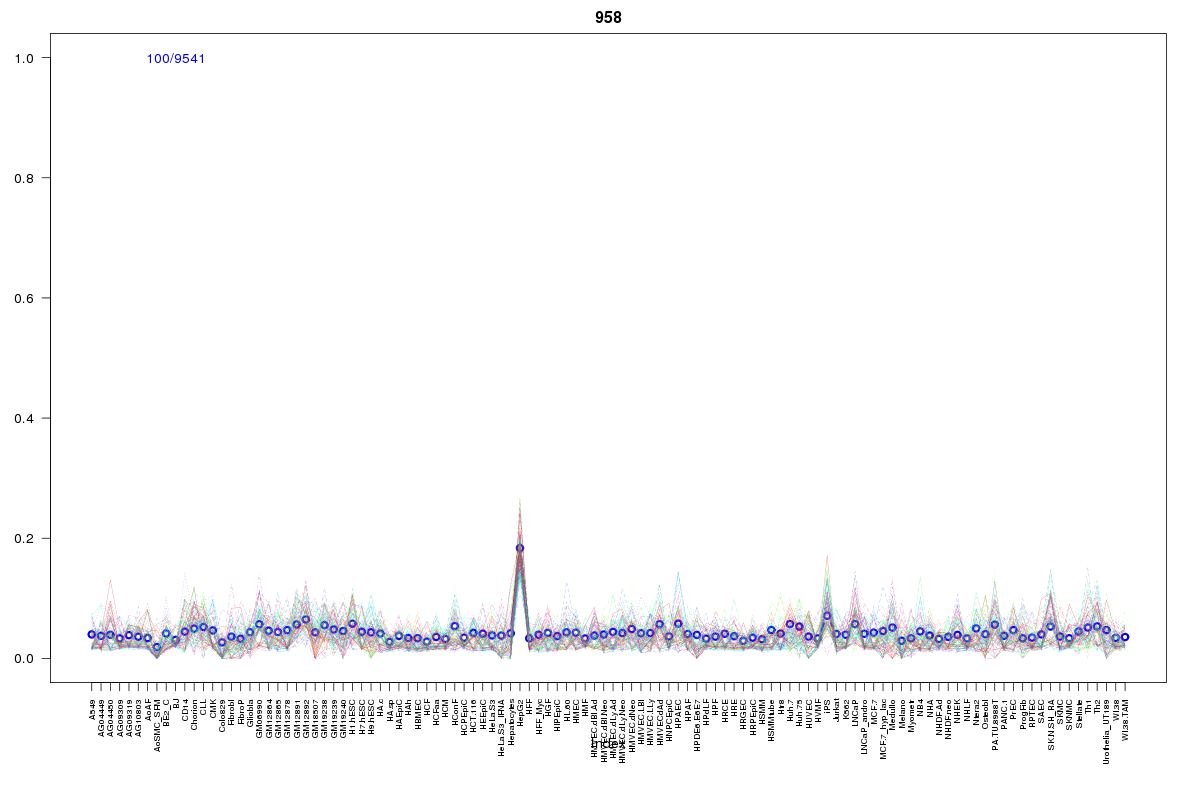 | 958 | 1 |
Resources
BED file downloads
Connects to 12 DHS sitesTop 10 Correlated DHS Sites
p-values indiciate significant higher or lower correlation| Location | Cluster | P-value |
|---|---|---|
| chr6:32121760-32121910 | 99 | 0 |
| chr6:32120940-32121090 | 2059 | 0.004 |
| chr6:32142820-32142970 | 1724 | 0.01 |
| chr6:32136945-32137095 | 958 | 0.01 |
| chr6:32121500-32121650 | 1412 | 0.016 |
| chr6:32086905-32087055 | 2059 | 0.016 |
| chr6:32145465-32145615 | 149 | 0.022 |
| chr6:32161960-32162110 | 2055 | 0.024 |
| chr6:32090920-32091070 | 626 | 0.019 |
| chr6:32089560-32089710 | 626 | 0.011 |
| chr6:32078405-32078555 | 881 | 0.008 |
External Databases
UCSCEnsembl (ENSG00000204310)