Gene: TUBB8P1
chr9: 21811619-21812346Expression Profile
(log scale)
Graphical Connections
Distribution of linked clusters:
You may find it interesting if many of the connected DHS sites belong to the same cluster.| Cluster Profile | Cluster ID | Number of DHS sites in this cluster |
|---|---|---|
 | 860 | 7 |
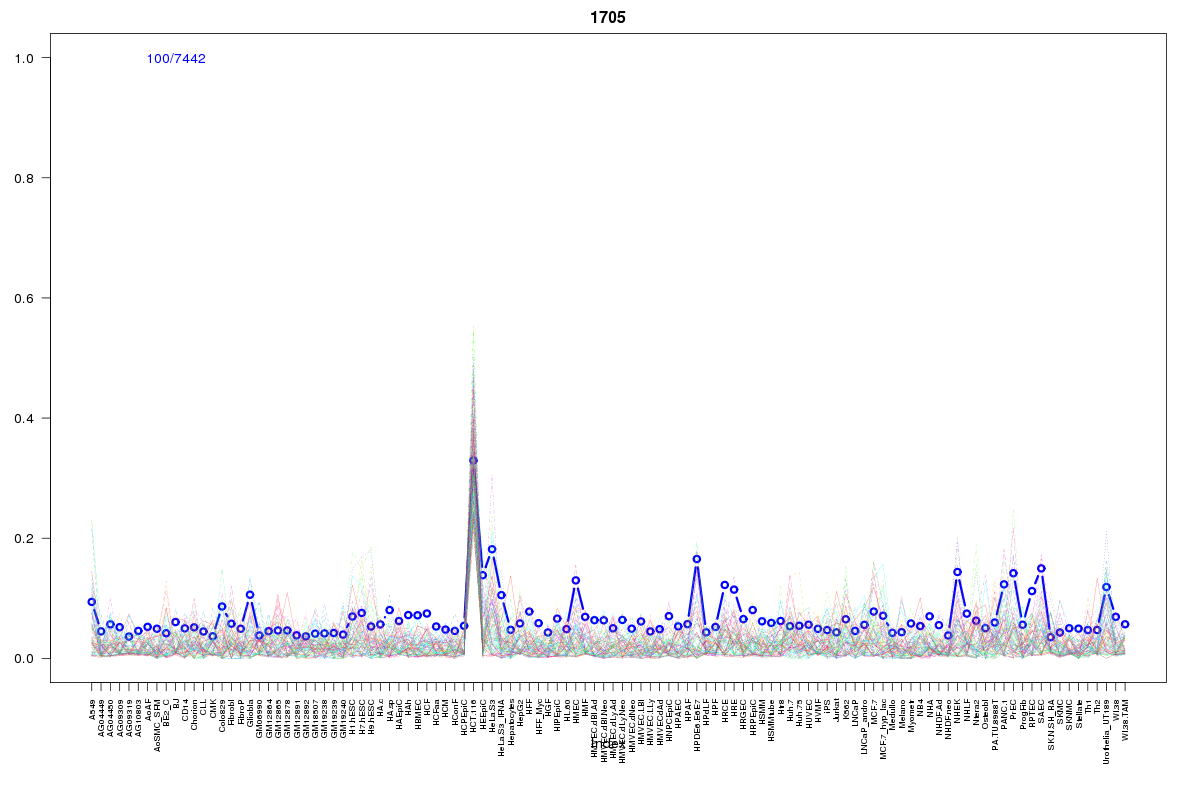 | 1705 | 4 |
 | 1659 | 2 |
 | 934 | 2 |
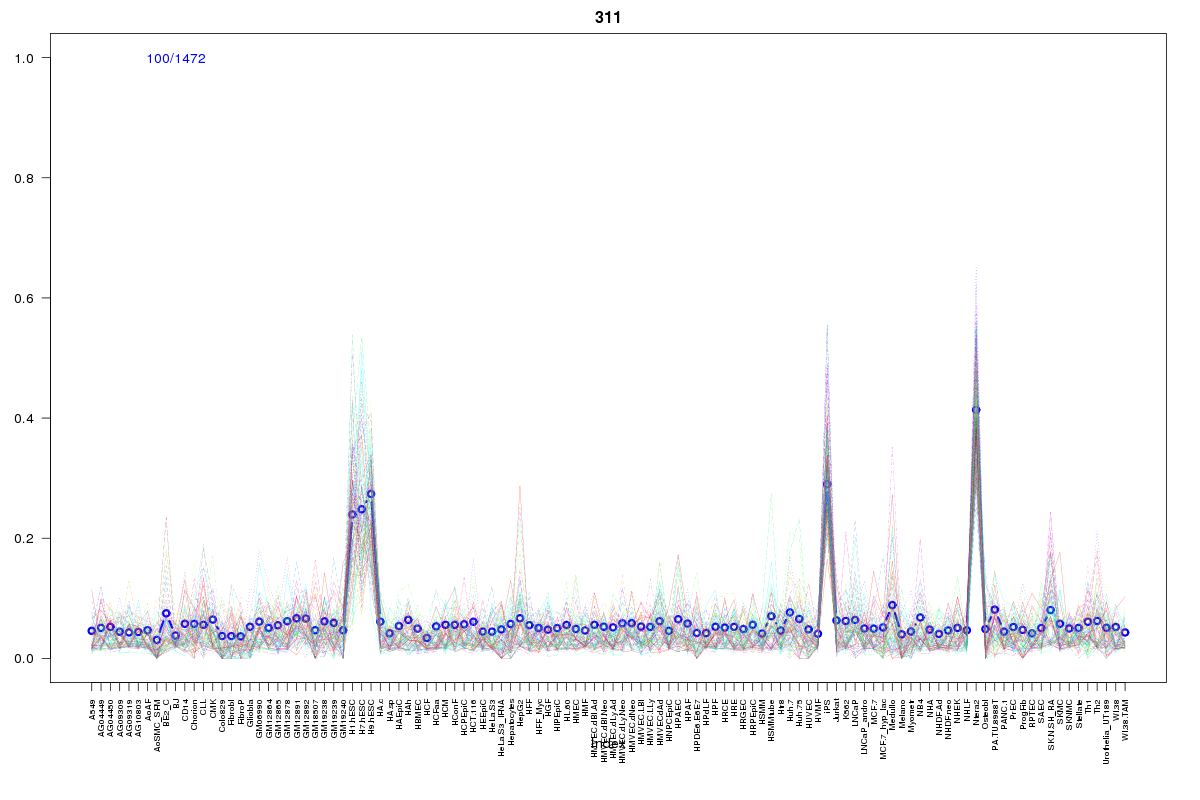 | 311 | 1 |
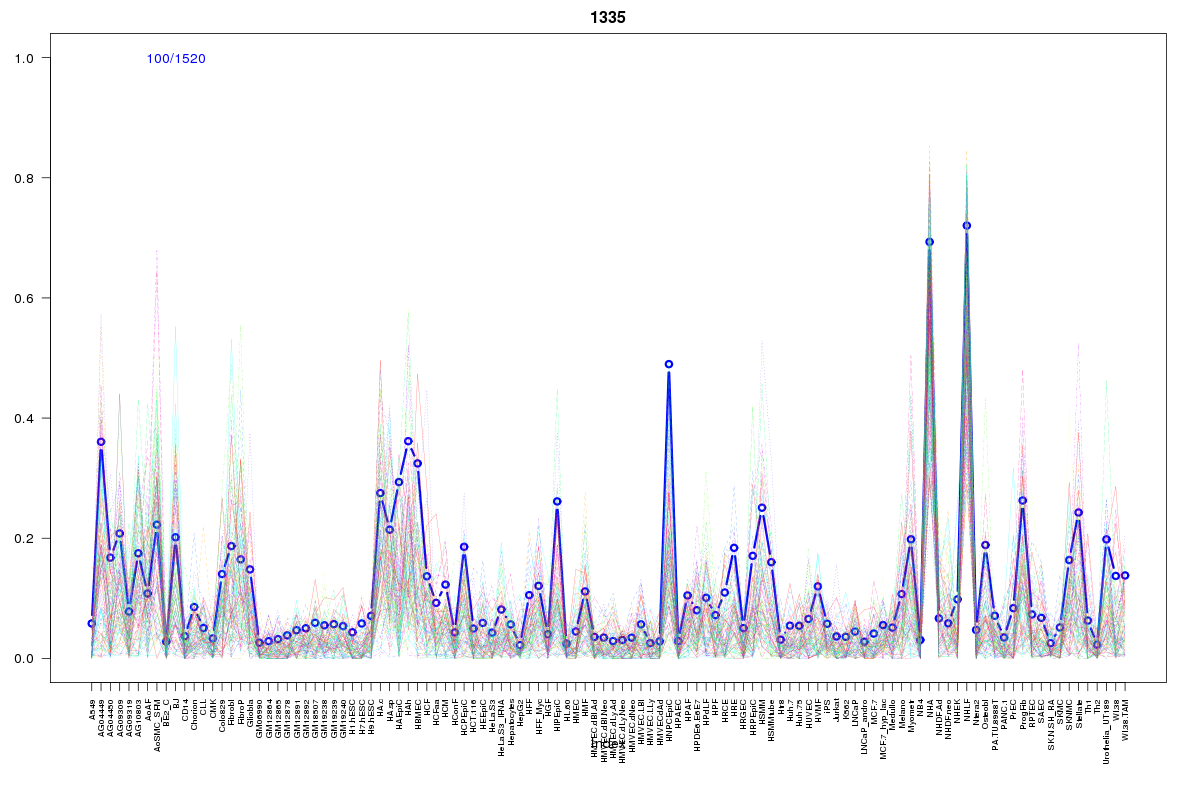 | 1335 | 1 |
 | 2455 | 1 |
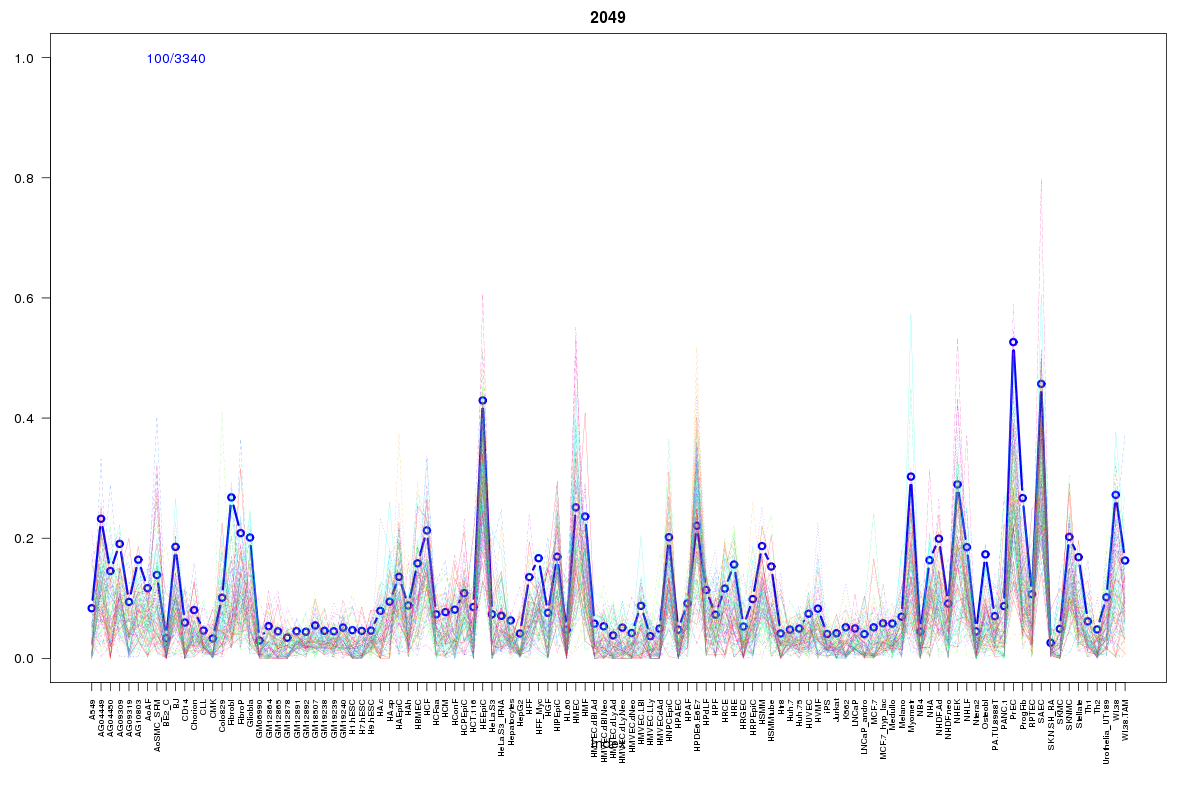 | 2049 | 1 |
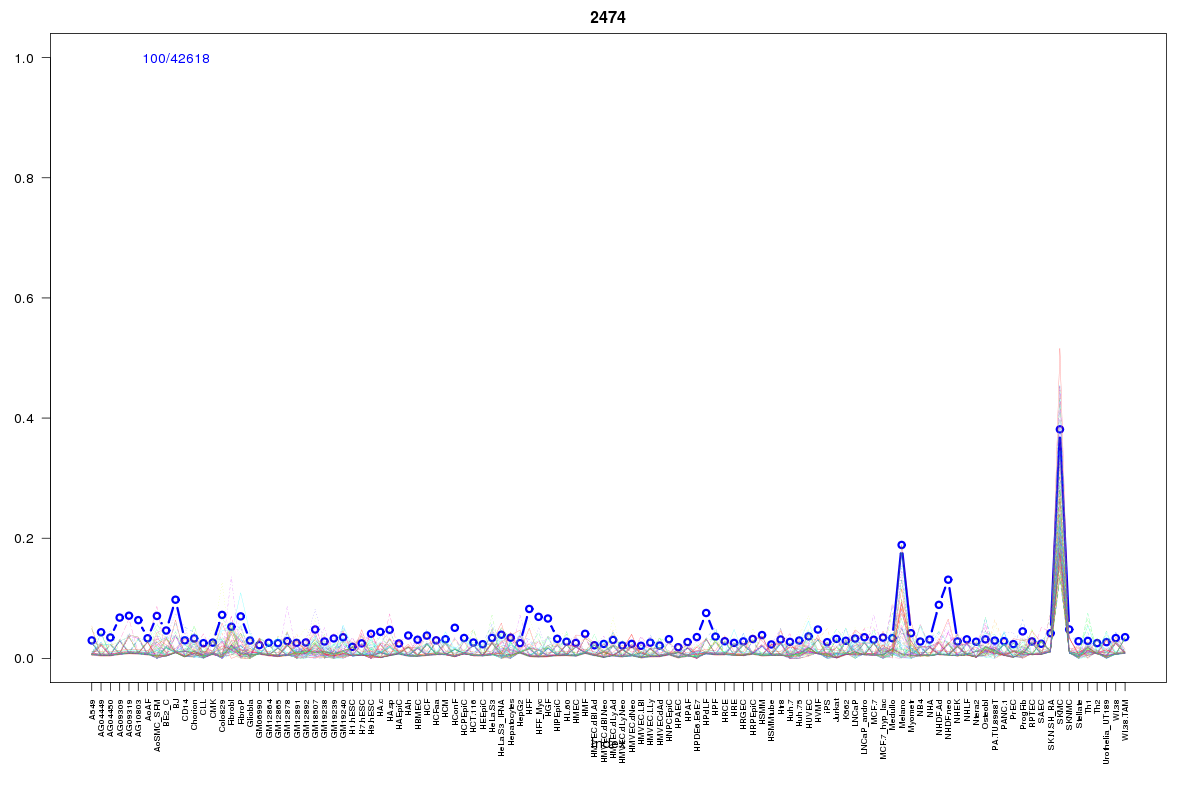 | 2474 | 1 |
 | 1974 | 1 |
 | 1970 | 1 |
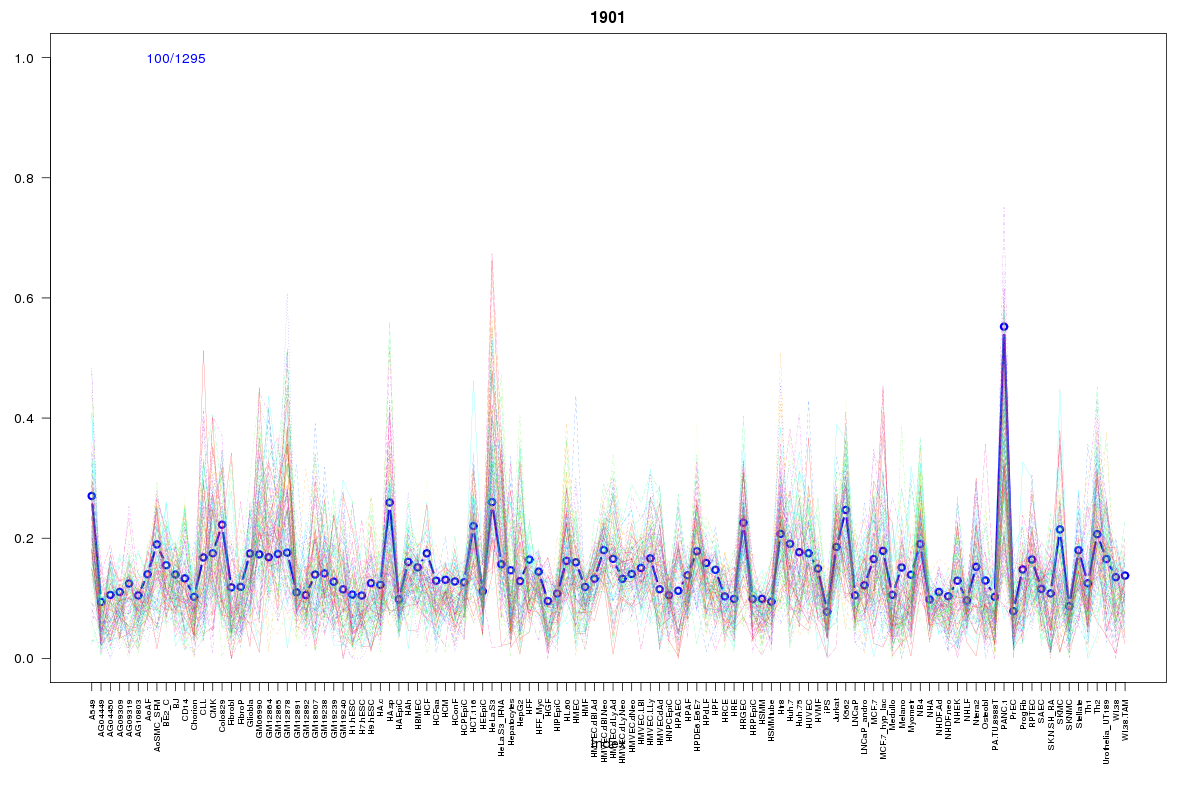 | 1901 | 1 |
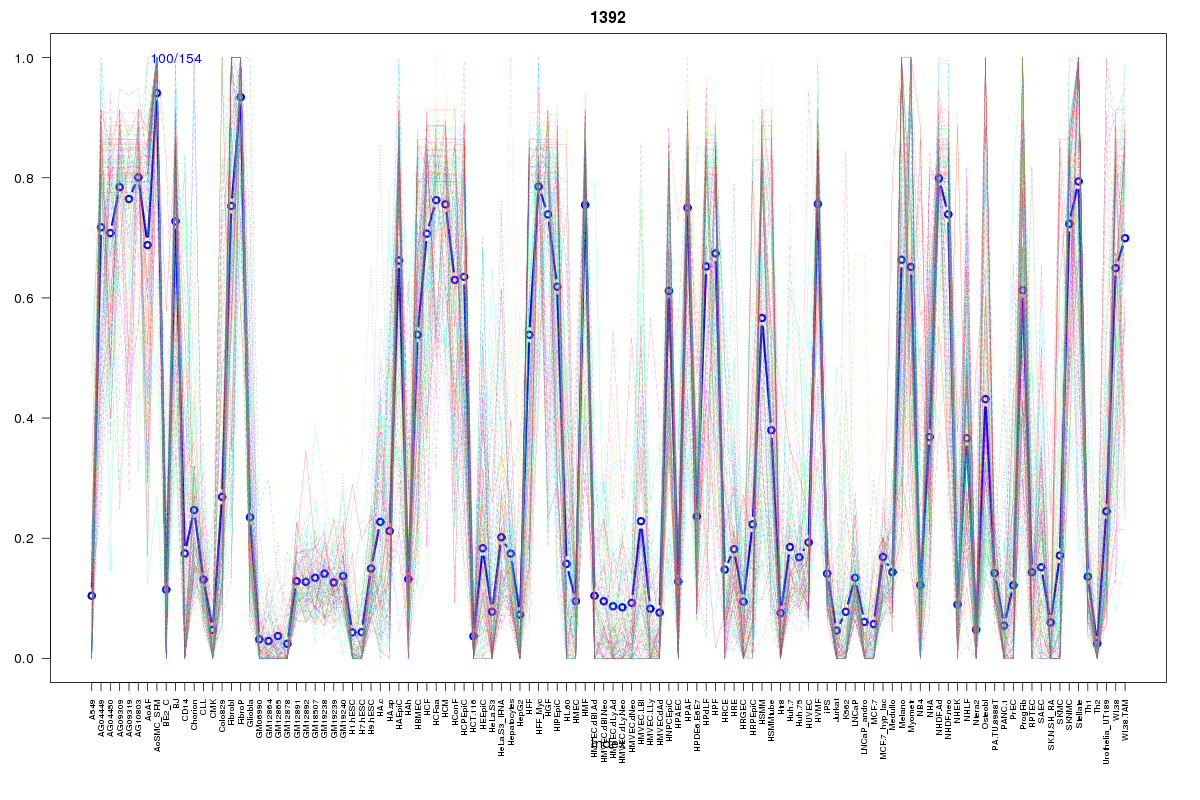 | 1392 | 1 |
 | 1241 | 1 |
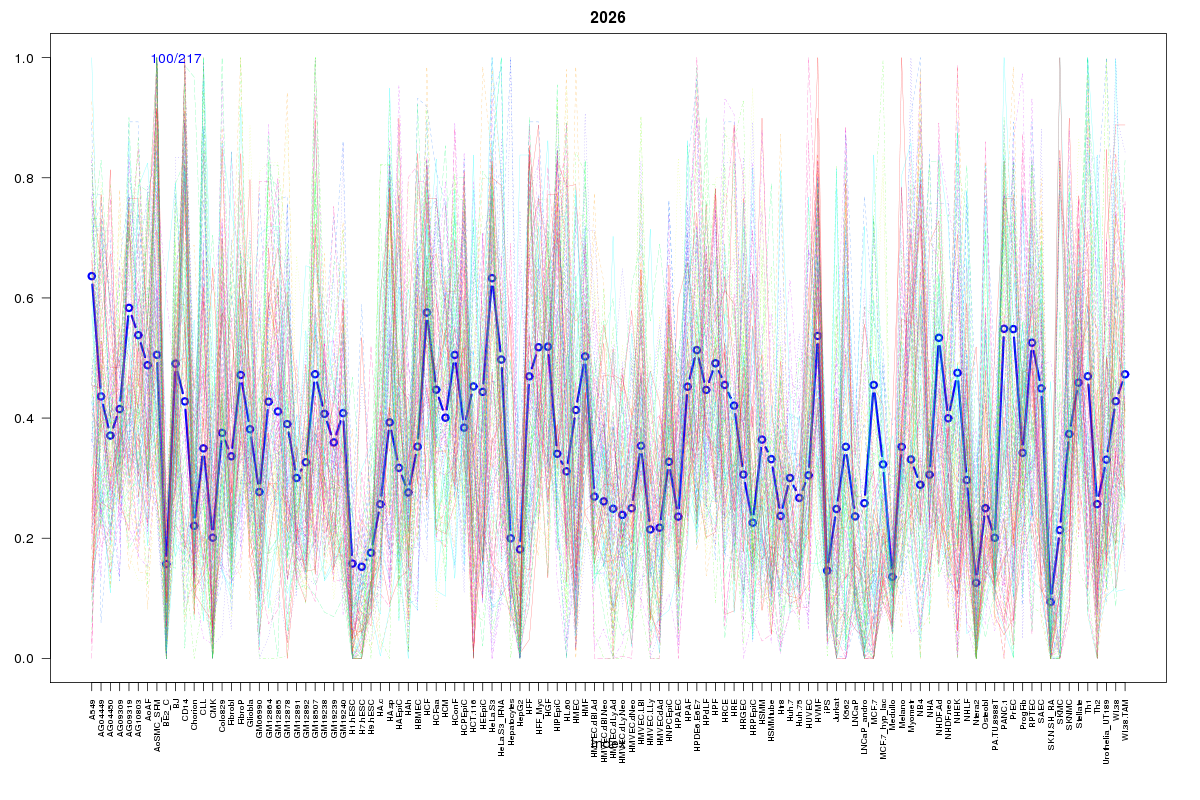 | 2026 | 1 |
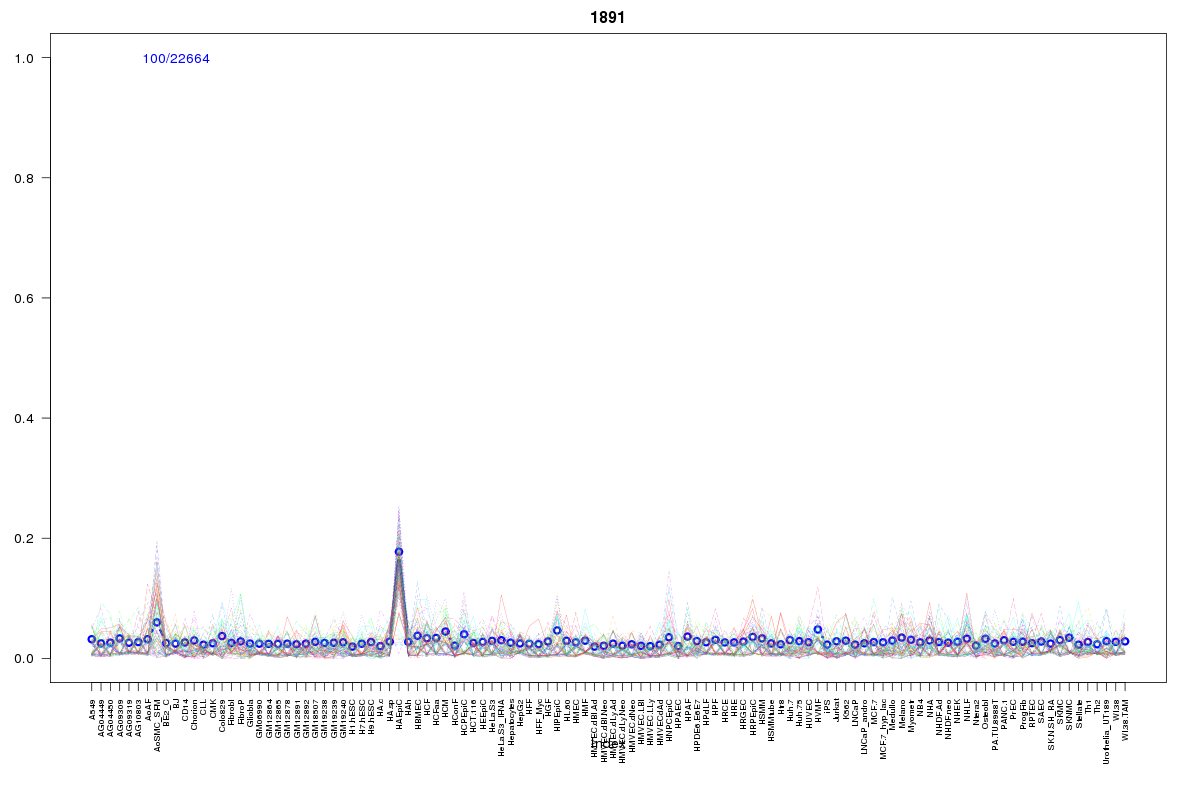 | 1891 | 1 |
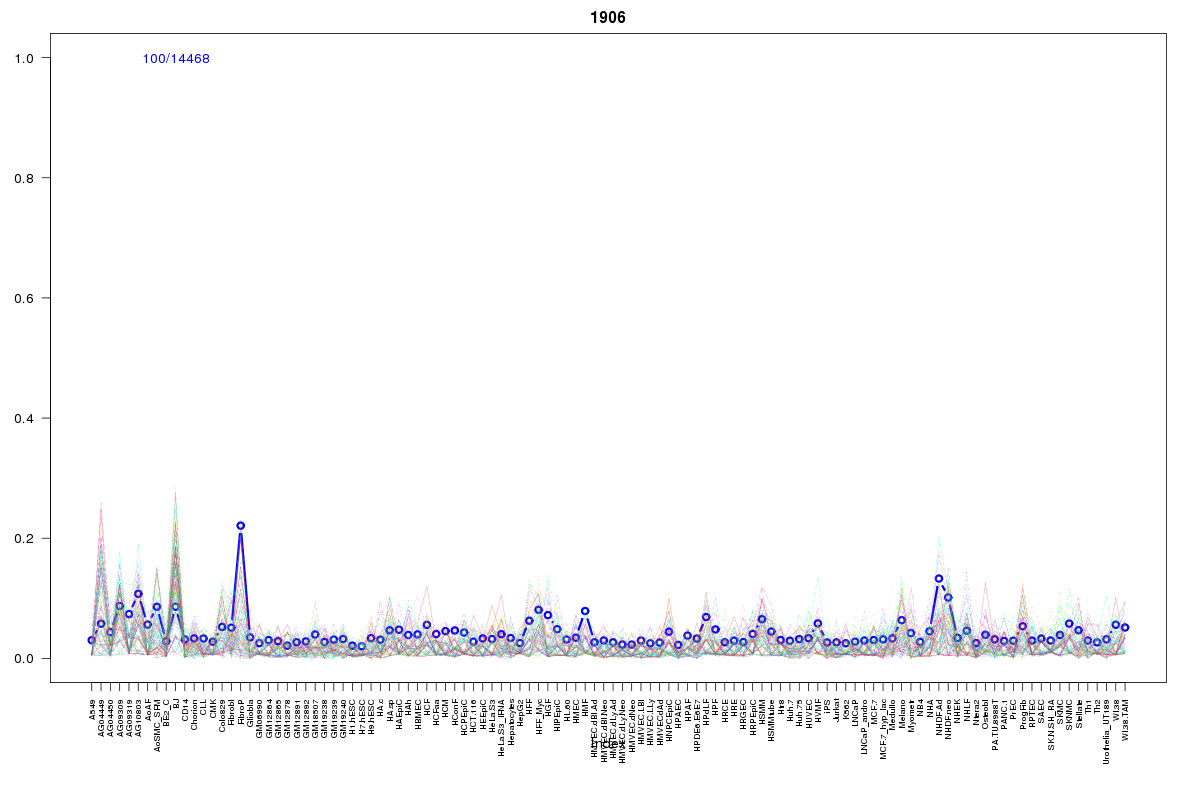 | 1906 | 1 |
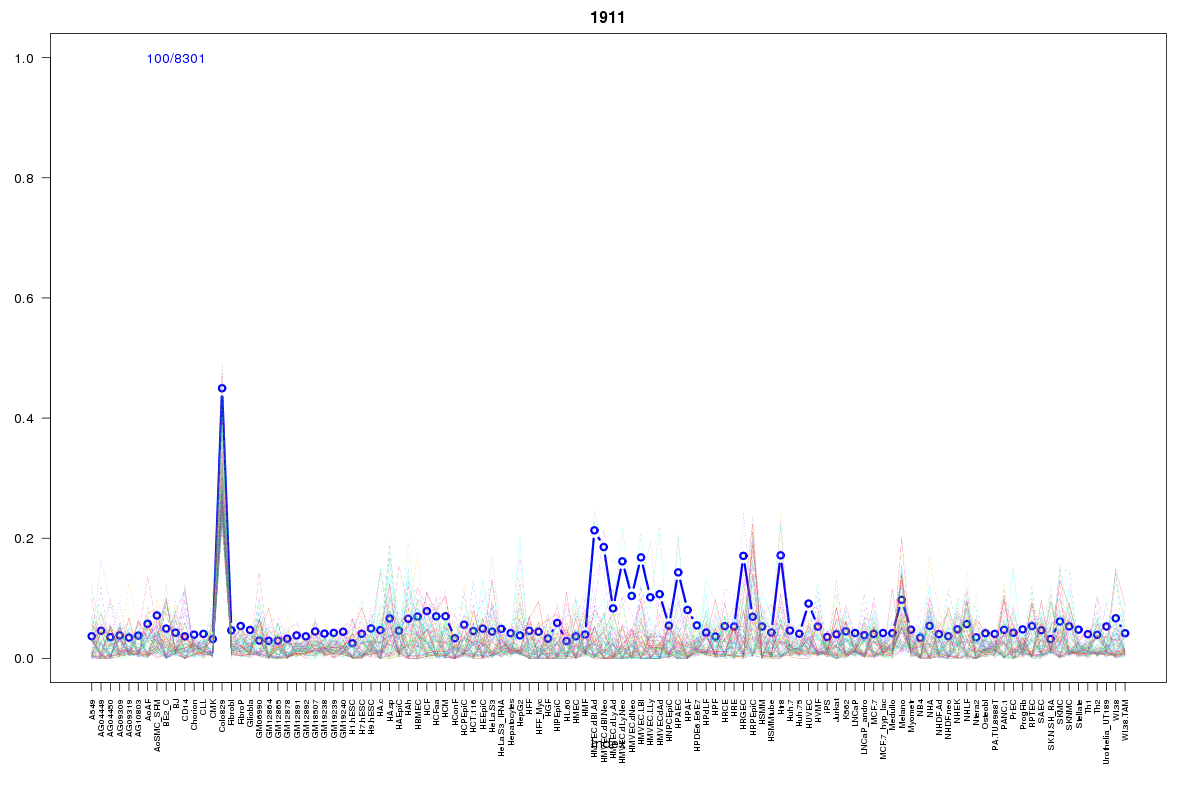 | 1911 | 1 |
 | 430 | 1 |
Resources
BED file downloads
Connects to 30 DHS sitesTop 10 Correlated DHS Sites
p-values indiciate significant higher or lower correlation| Location | Cluster | P-value |
|---|---|---|
| chr9:21800665-21800815 | 860 | 0 |
| chr9:21835060-21835210 | 1891 | 0 |
| chr9:21834620-21834770 | 860 | 0.001 |
| chr9:21772620-21772770 | 860 | 0.001 |
| chr9:21809665-21809815 | 860 | 0.003 |
| chr9:21781820-21781970 | 1705 | 0.003 |
| chr9:21783360-21783510 | 860 | 0.004 |
| chr9:21788580-21788730 | 1705 | 0.004 |
| chr9:21781460-21781610 | 1705 | 0.004 |
| chr9:21779325-21779475 | 860 | 0.004 |
| chr9:21788800-21788950 | 1659 | 0.005 |
External Databases
UCSCEnsembl (ENSG00000229298)