Gene: GLTPP1
chr11: 18210546-18211168Expression Profile
(log scale)
Graphical Connections
Distribution of linked clusters:
You may find it interesting if many of the connected DHS sites belong to the same cluster.| Cluster Profile | Cluster ID | Number of DHS sites in this cluster |
|---|---|---|
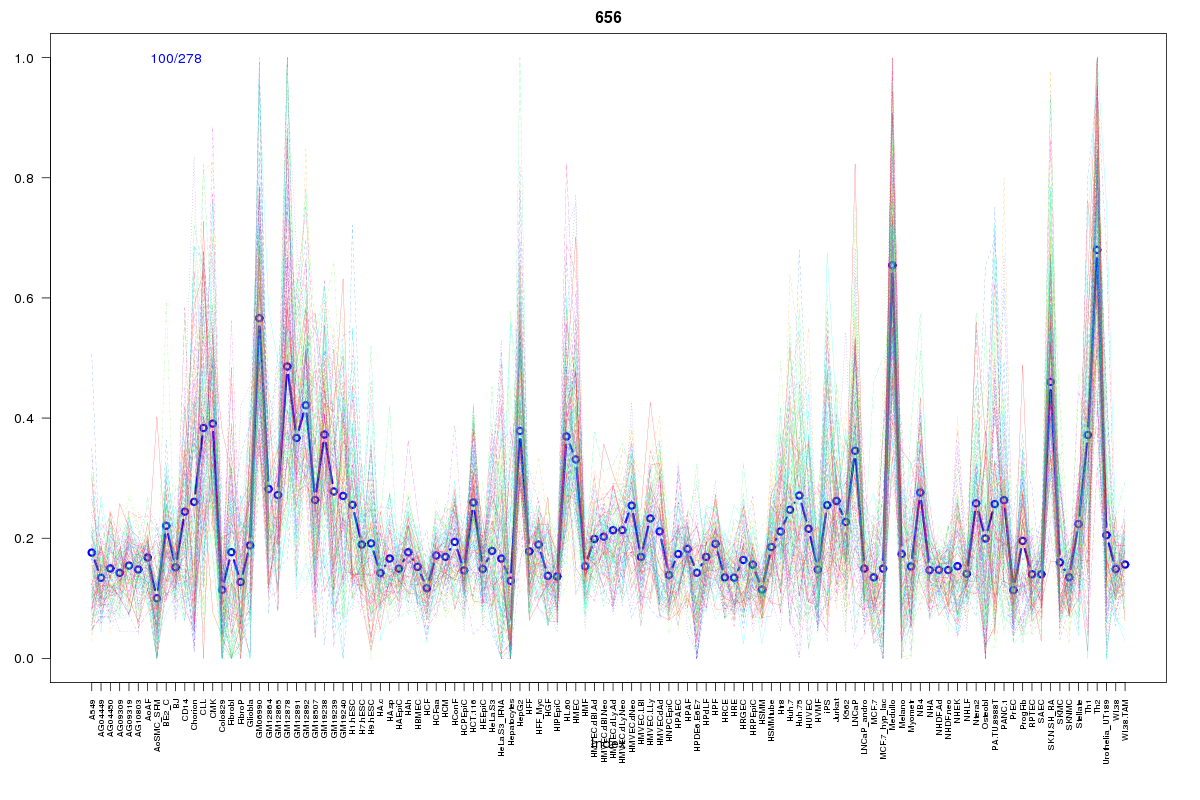 | 656 | 1 |
 | 2072 | 1 |
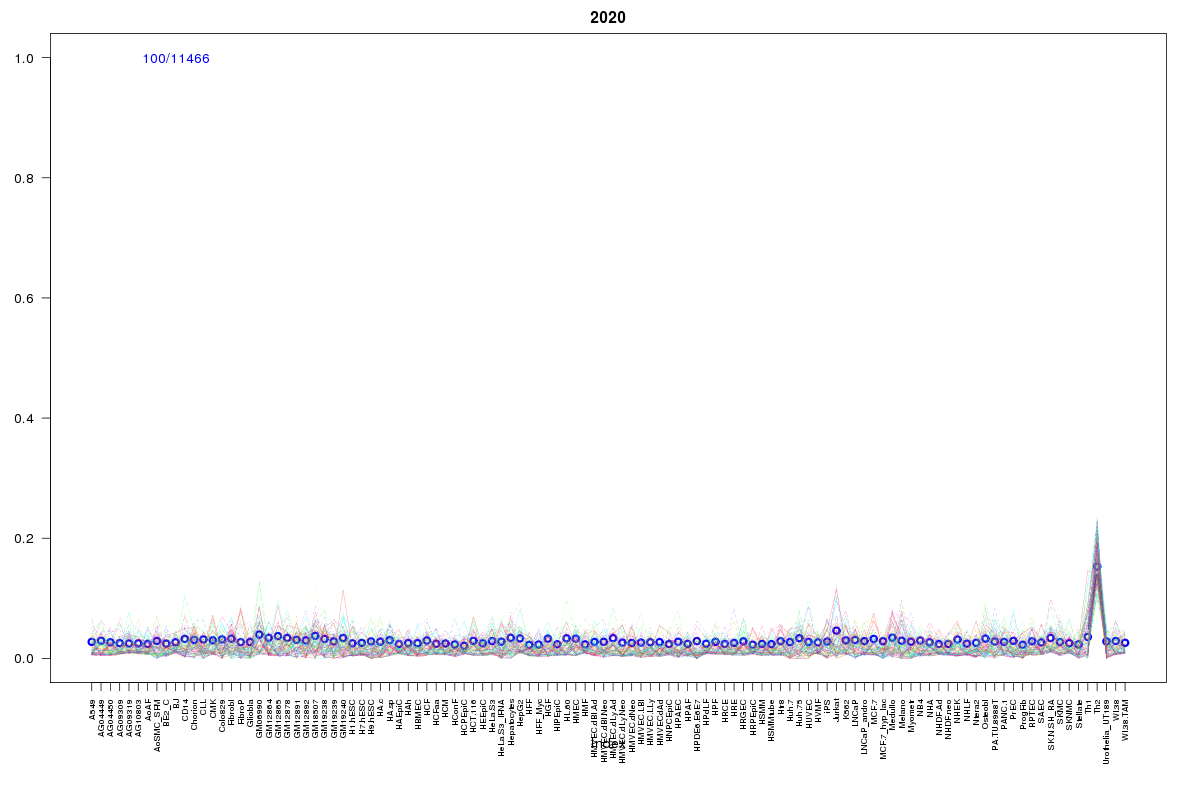 | 2020 | 1 |
 | 15 | 1 |
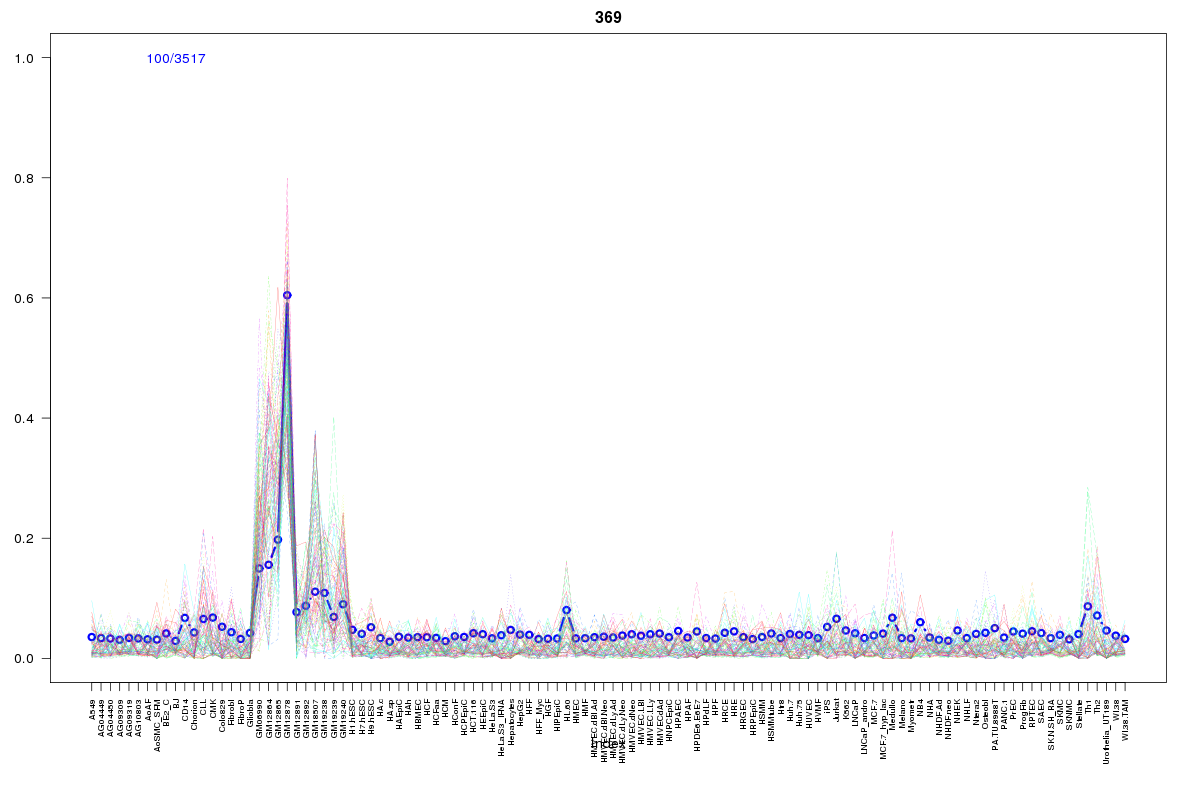 | 369 | 1 |
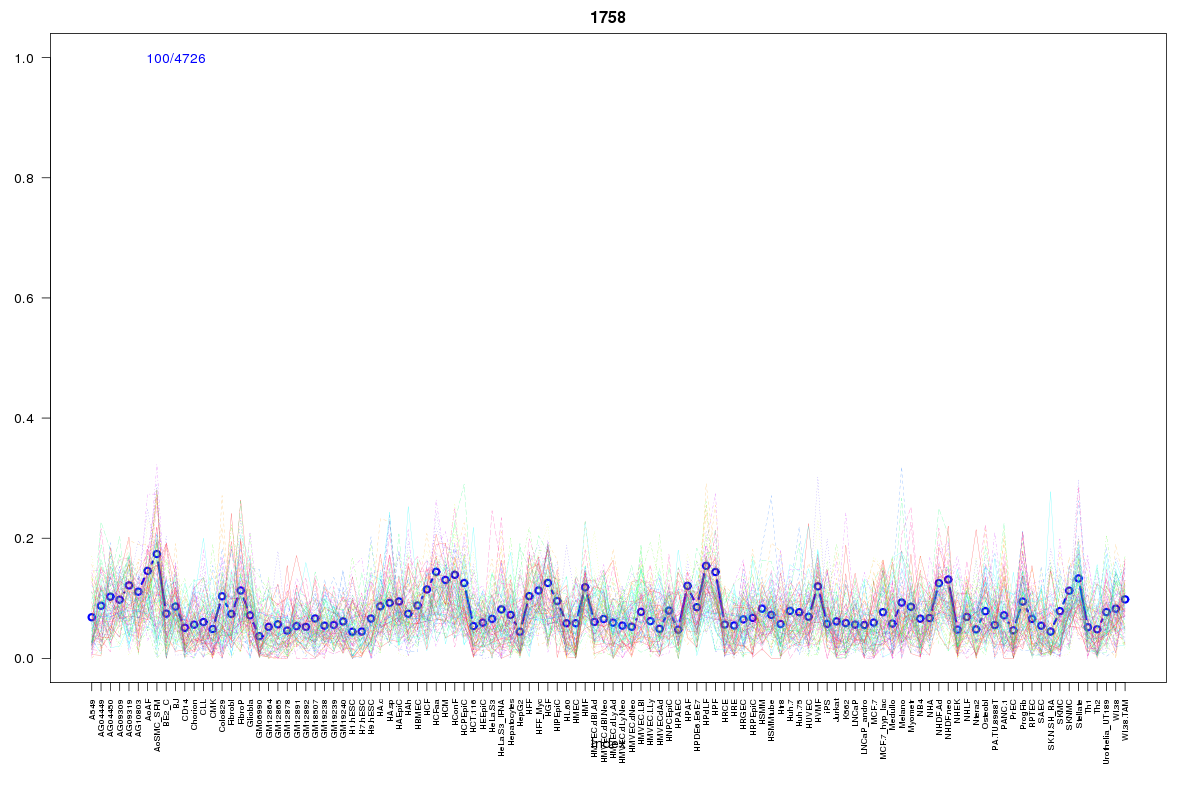 | 1758 | 1 |
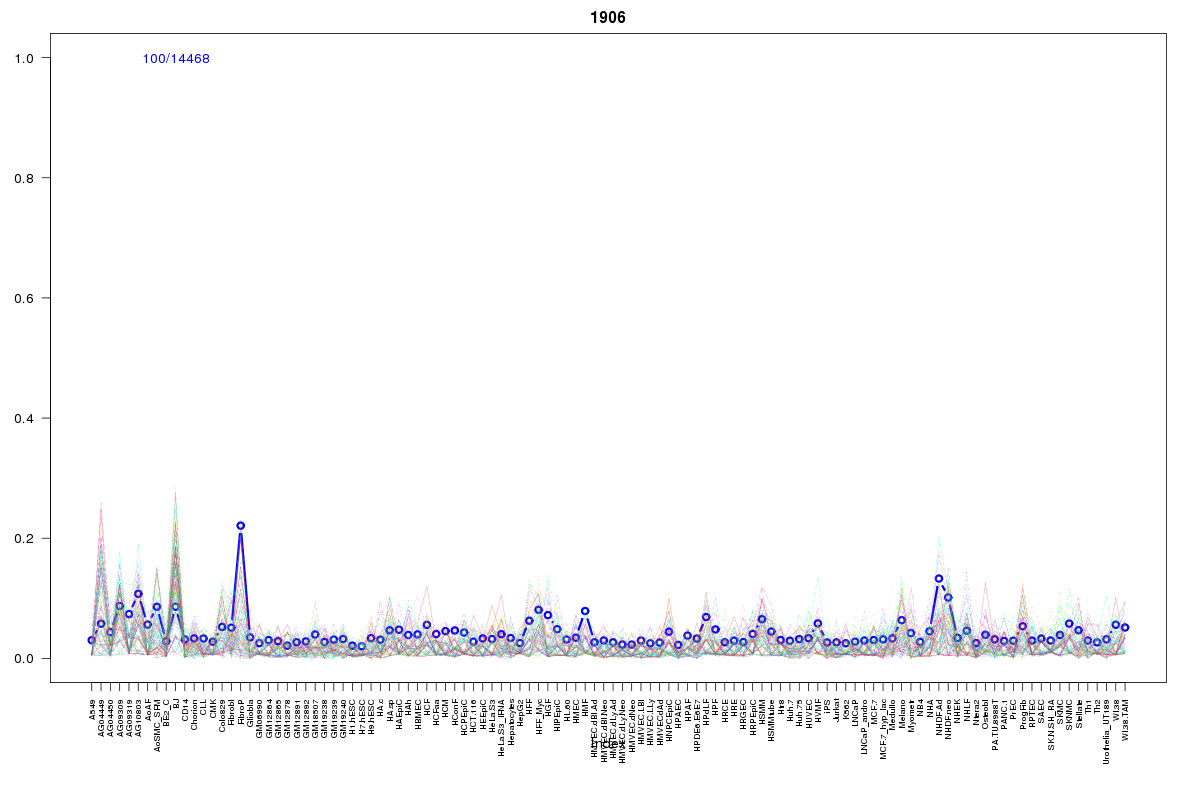 | 1906 | 1 |
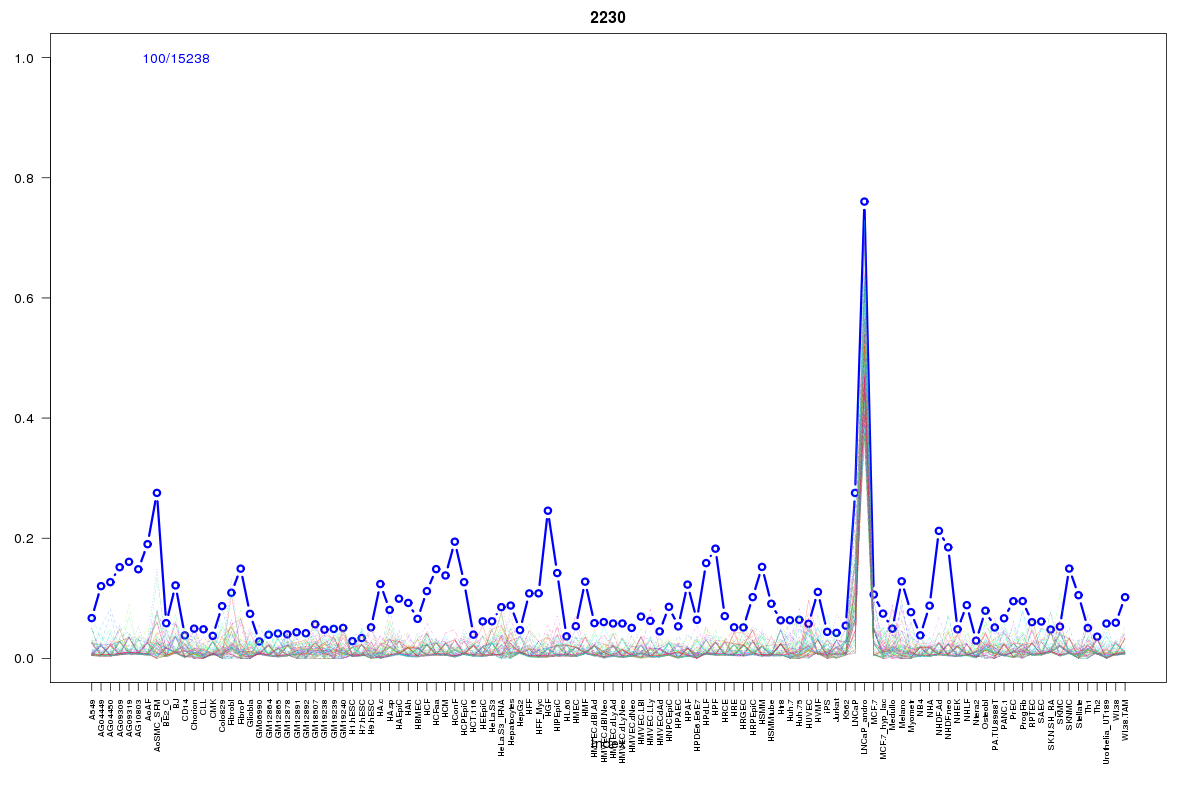 | 2230 | 1 |
 | 2186 | 1 |
Resources
BED file downloads
Connects to 9 DHS sitesTop 10 Correlated DHS Sites
p-values indiciate significant higher or lower correlation| Location | Cluster | P-value |
|---|---|---|
| chr11:18229945-18230095 | 2020 | 0.004 |
| chr11:18229300-18229450 | 2072 | 0.006 |
| chr11:18127345-18127495 | 656 | 0.008 |
| chr11:18291765-18291915 | 1758 | 0.009 |
| chr11:18289760-18289910 | 369 | 0.016 |
| chr11:18268885-18269035 | 15 | 0.022 |
| chr11:18307560-18307710 | 1906 | 0.02 |
| chr11:18115600-18115750 | 2230 | 0.005 |
| chr11:18117260-18117410 | 2186 | 0.004 |
External Databases
UCSCEnsembl (ENSG00000255138)