Gene: THPO
chr3: 184089722-184095932Expression Profile
(log scale)
Graphical Connections
Distribution of linked clusters:
You may find it interesting if many of the connected DHS sites belong to the same cluster.| Cluster Profile | Cluster ID | Number of DHS sites in this cluster |
|---|---|---|
 | 1355 | 2 |
 | 927 | 2 |
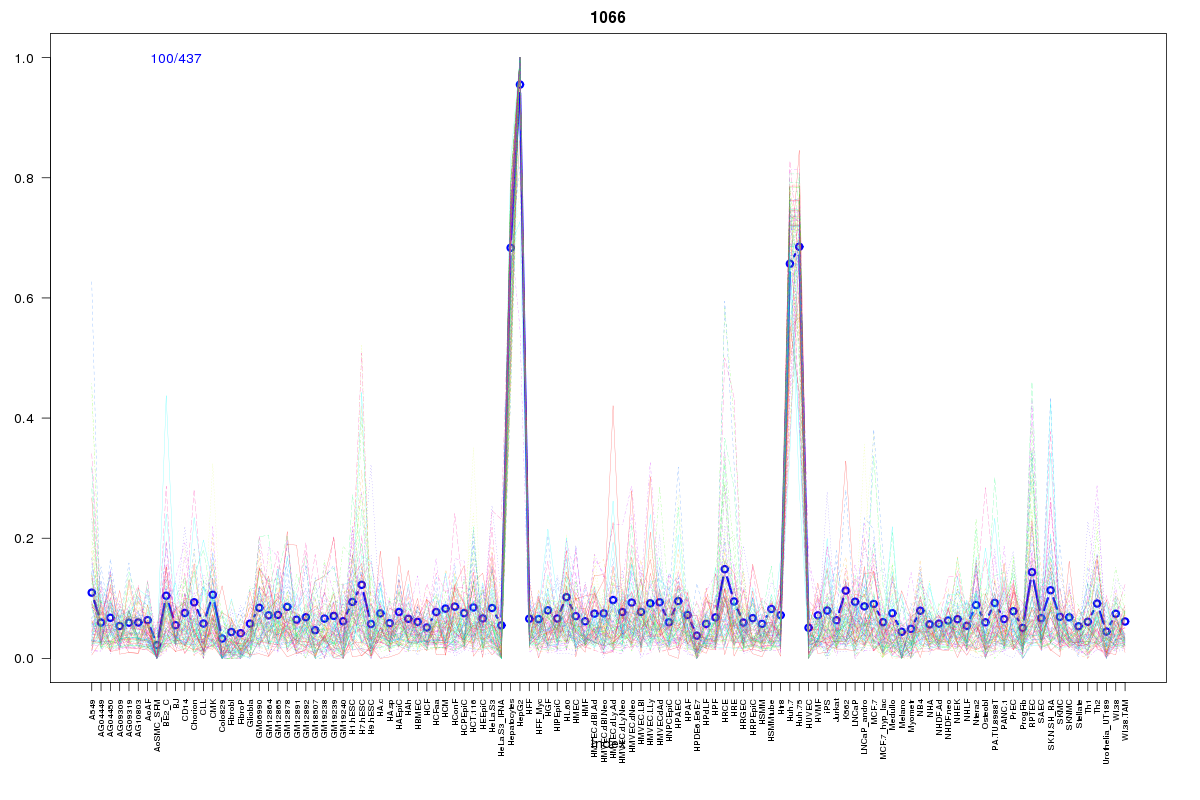 | 1066 | 2 |
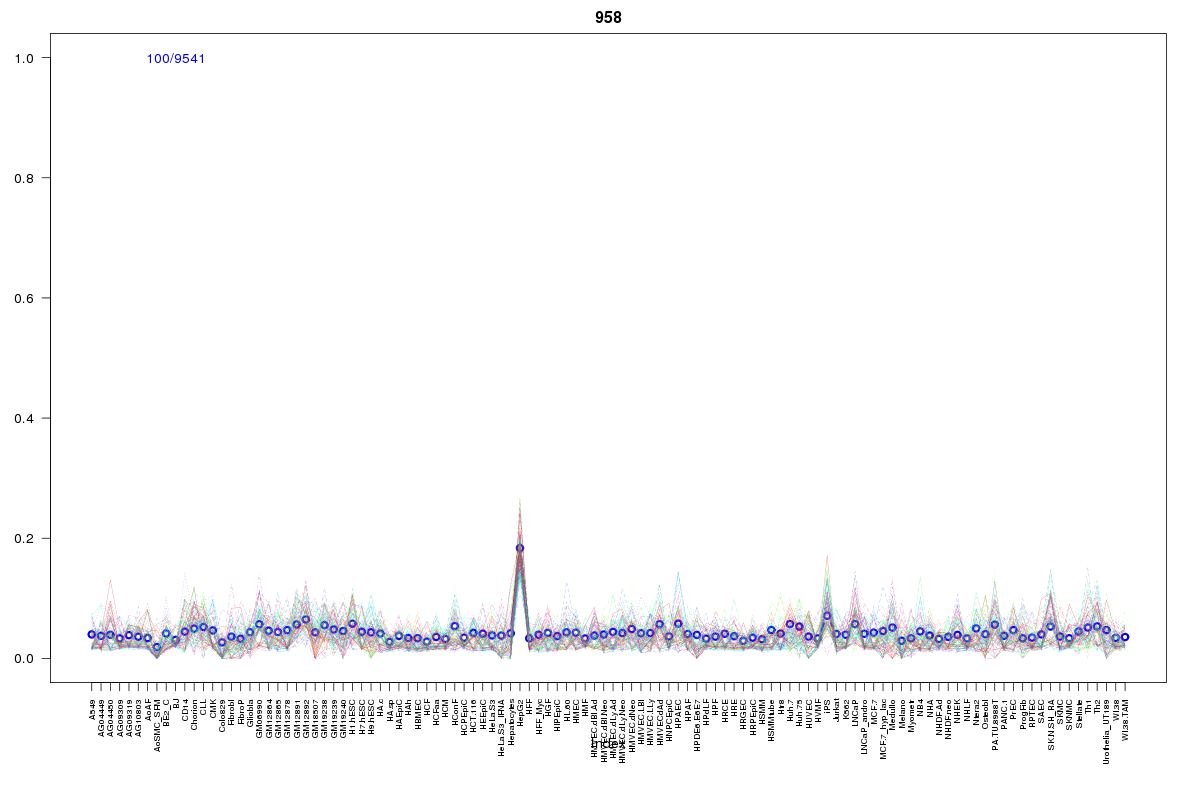 | 958 | 2 |
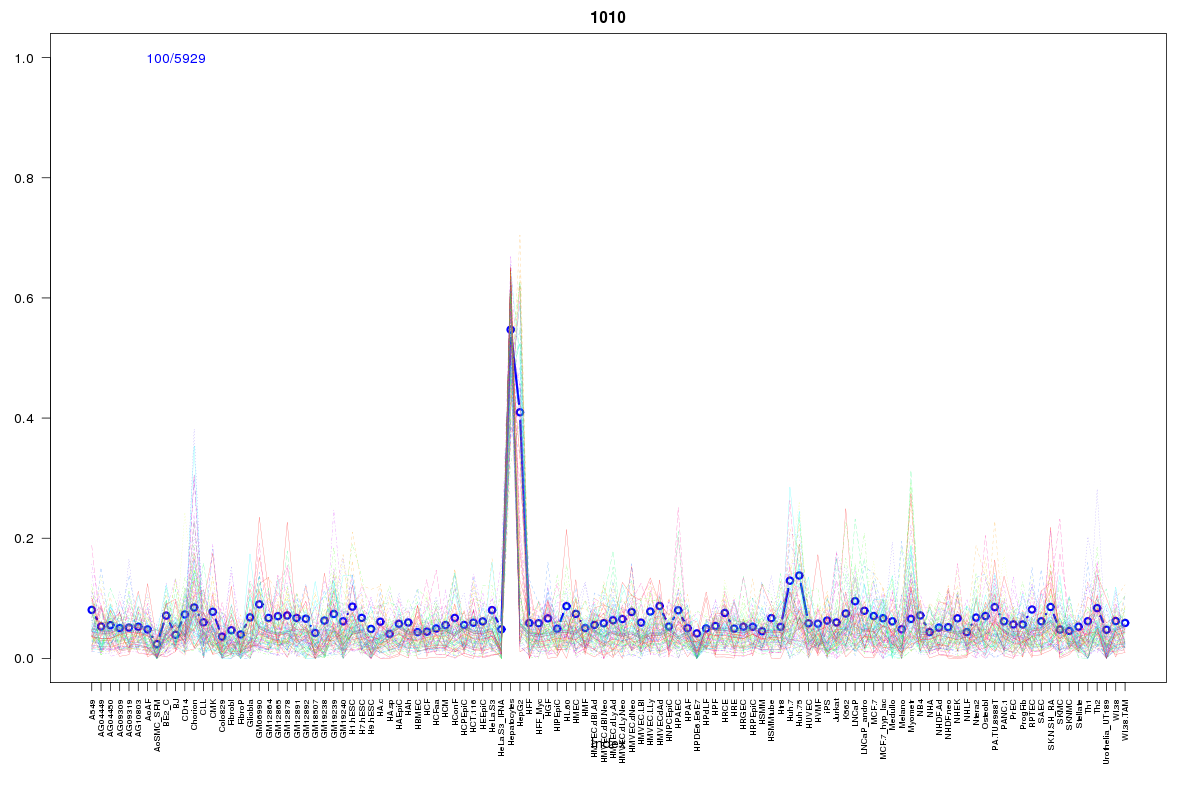 | 1010 | 1 |
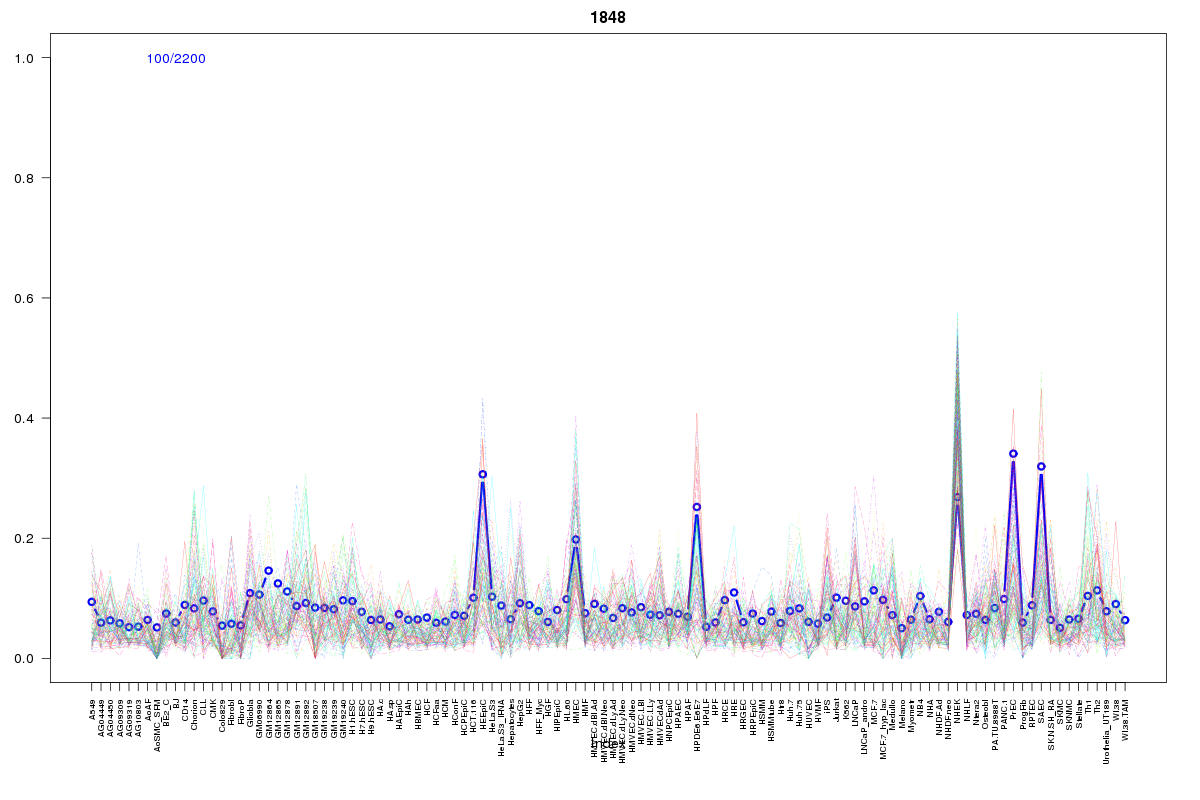 | 1848 | 1 |
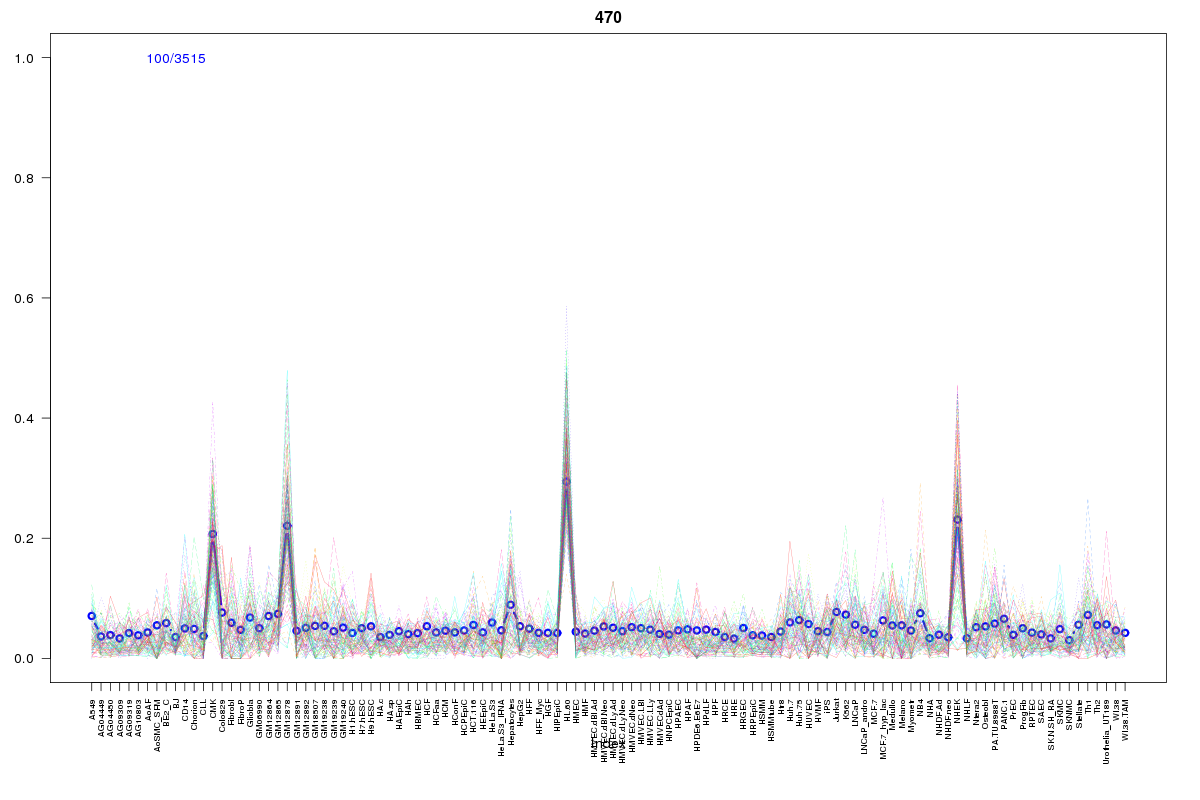 | 470 | 1 |
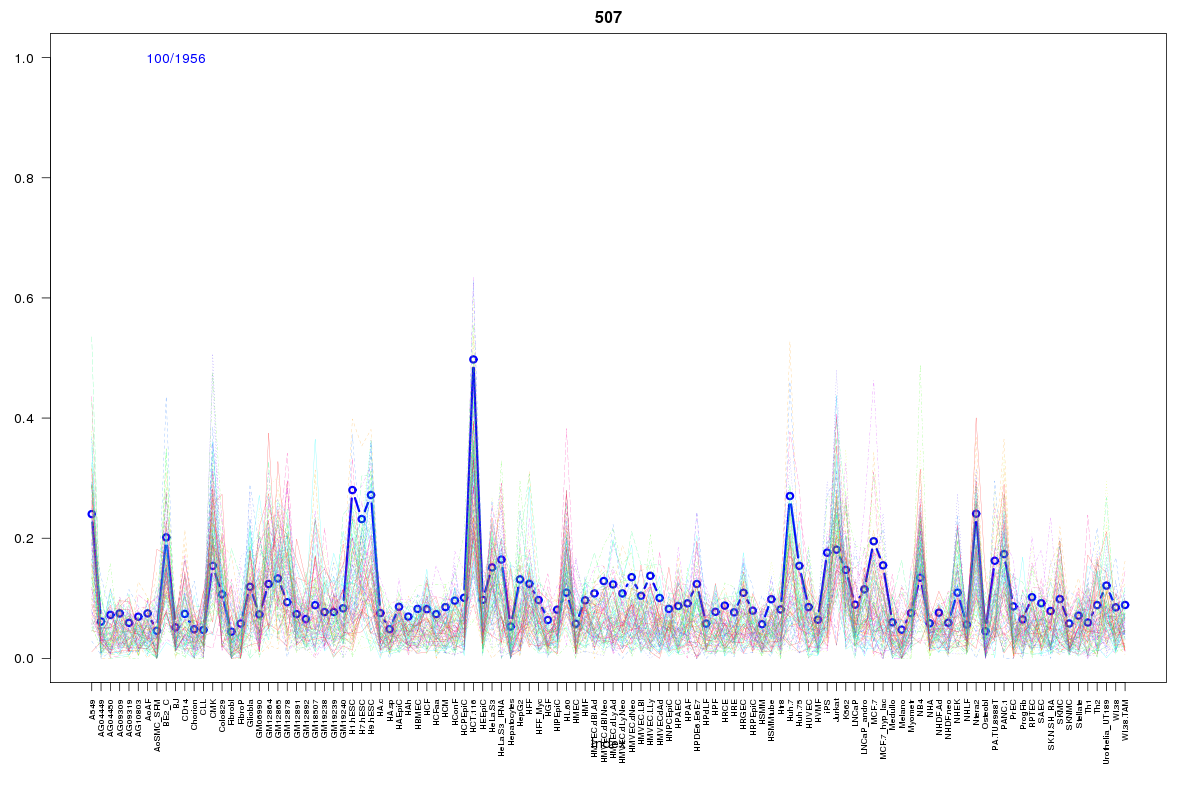 | 507 | 1 |
 | 1115 | 1 |
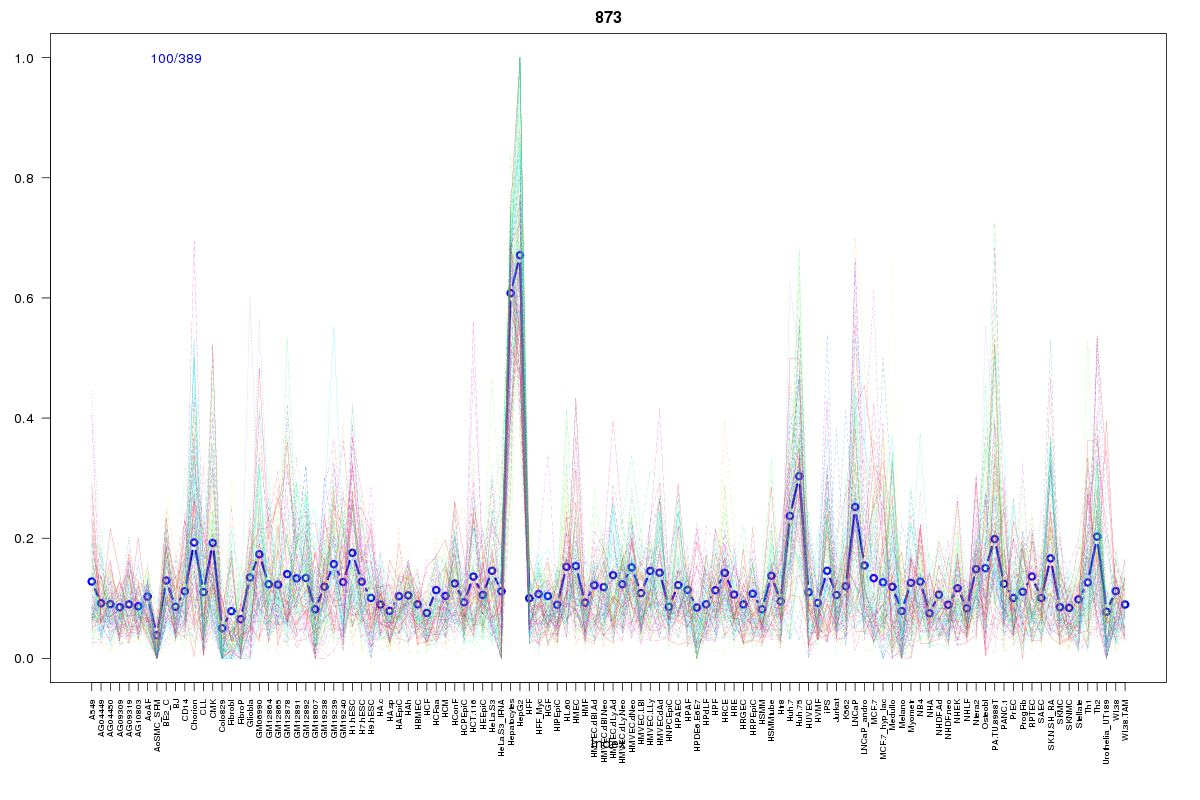 | 873 | 1 |
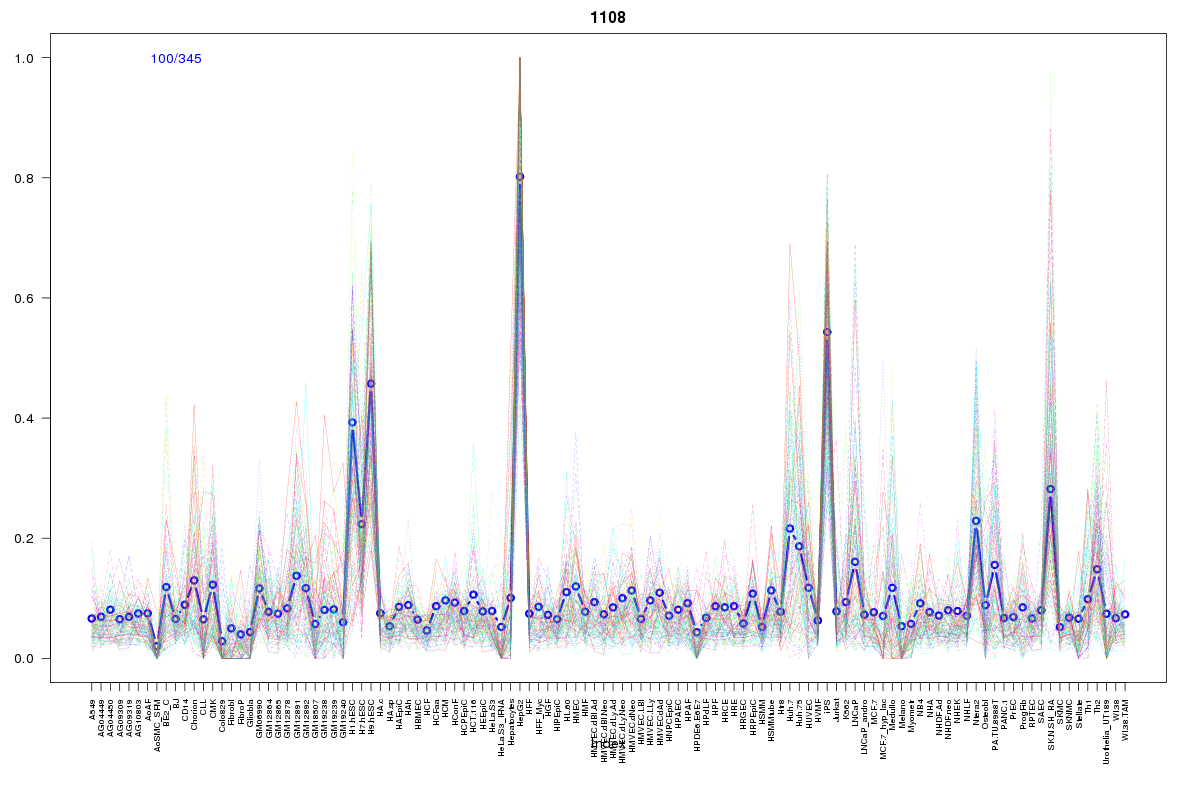 | 1108 | 1 |
 | 1113 | 1 |
 | 293 | 1 |
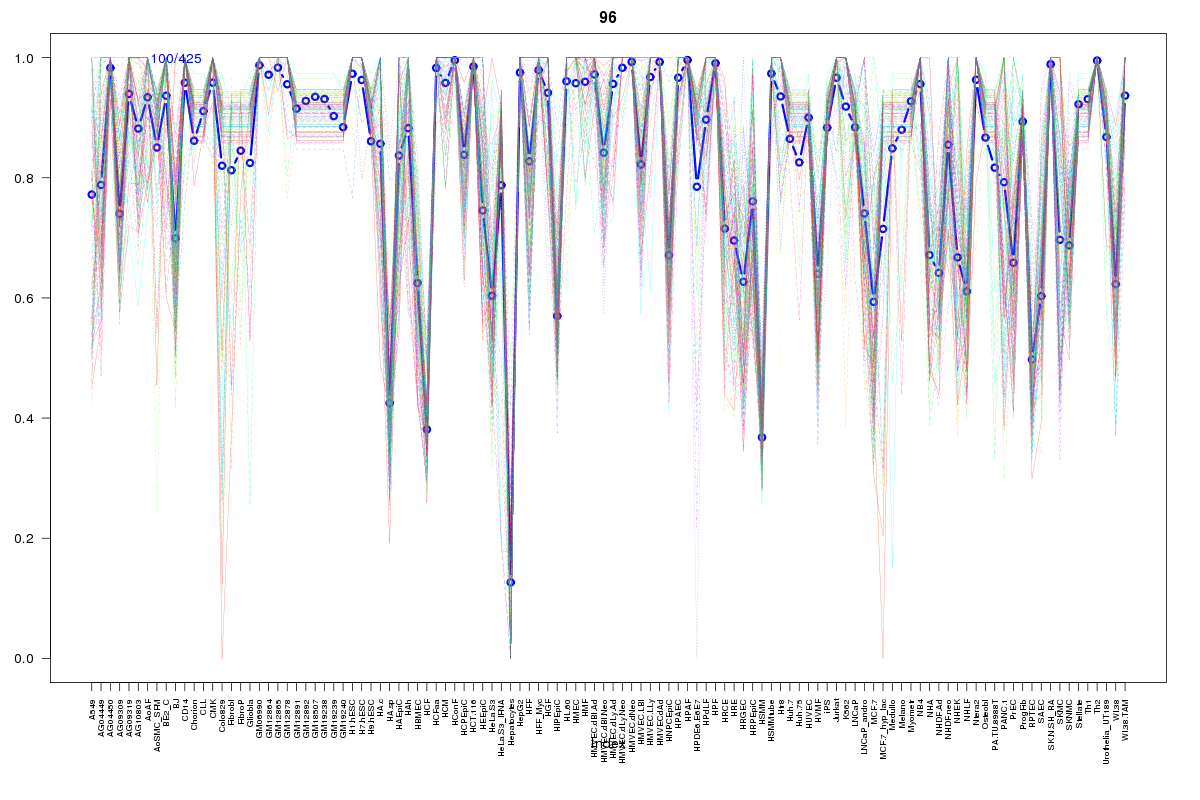 | 96 | 1 |
Resources
BED file downloads
Connects to 18 DHS sitesTop 10 Correlated DHS Sites
p-values indiciate significant higher or lower correlation| Location | Cluster | P-value |
|---|---|---|
| chr3:184095840-184095990 | 1066 | 0 |
| chr3:184096025-184096175 | 1066 | 0 |
| chr3:184069905-184070055 | 1355 | 0 |
| chr3:184095625-184095775 | 1115 | 0.001 |
| chr3:184012645-184012795 | 958 | 0.002 |
| chr3:184134620-184134770 | 1355 | 0.006 |
| chr3:184008005-184008155 | 958 | 0.011 |
| chr3:184097645-184097795 | 1108 | 0.013 |
| chr3:184095045-184095195 | 927 | 0.015 |
| chr3:184097385-184097535 | 873 | 0.016 |
| chr3:184098225-184098375 | 1113 | 0.019 |
External Databases
UCSCEnsembl (ENSG00000090534)