Gene: PTCD1
chr7: 99014361-99036539Expression Profile
(log scale)
Graphical Connections
Distribution of linked clusters:
You may find it interesting if many of the connected DHS sites belong to the same cluster.| Cluster Profile | Cluster ID | Number of DHS sites in this cluster |
|---|---|---|
 | 881 | 2 |
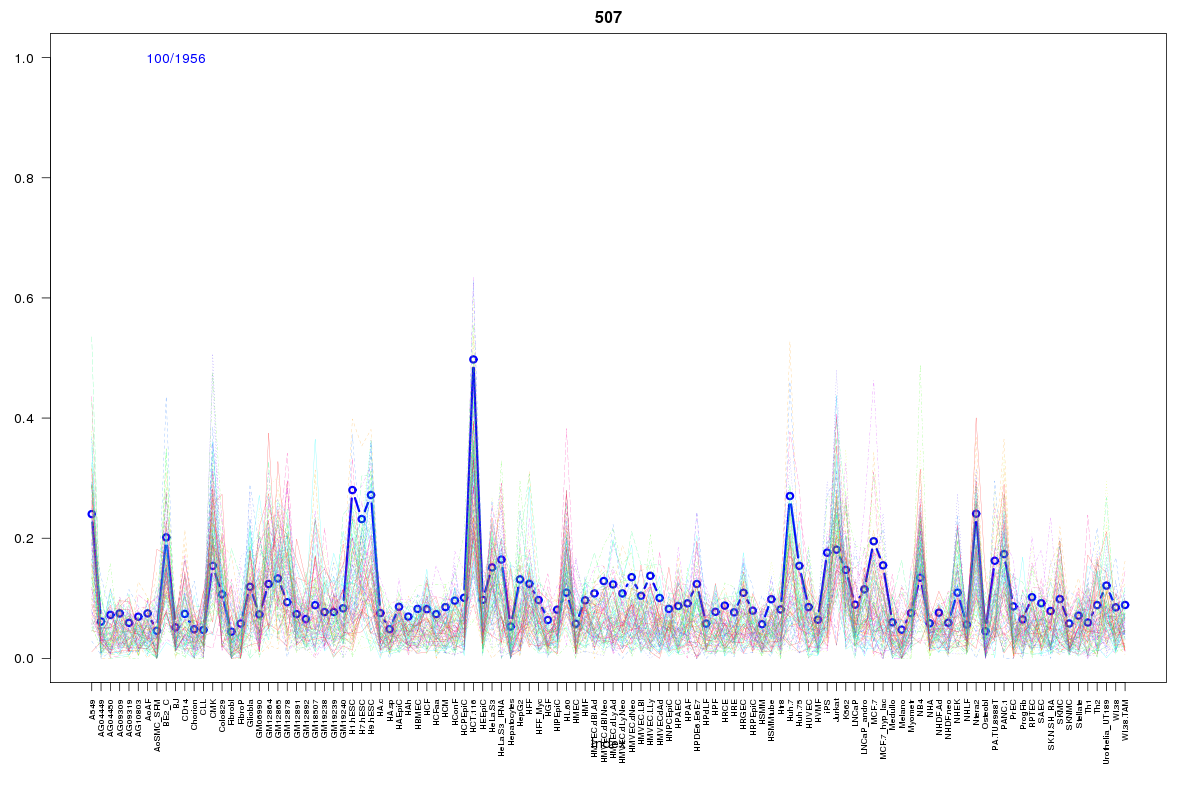 | 507 | 2 |
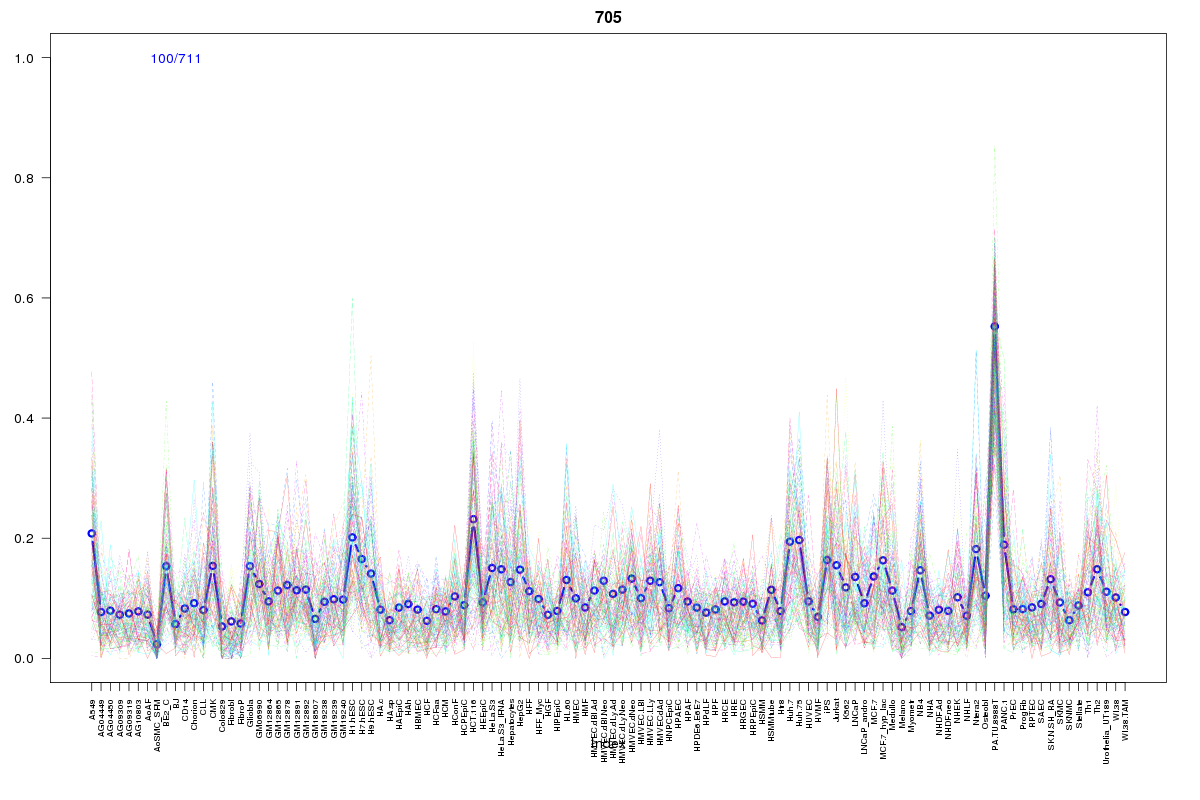 | 705 | 1 |
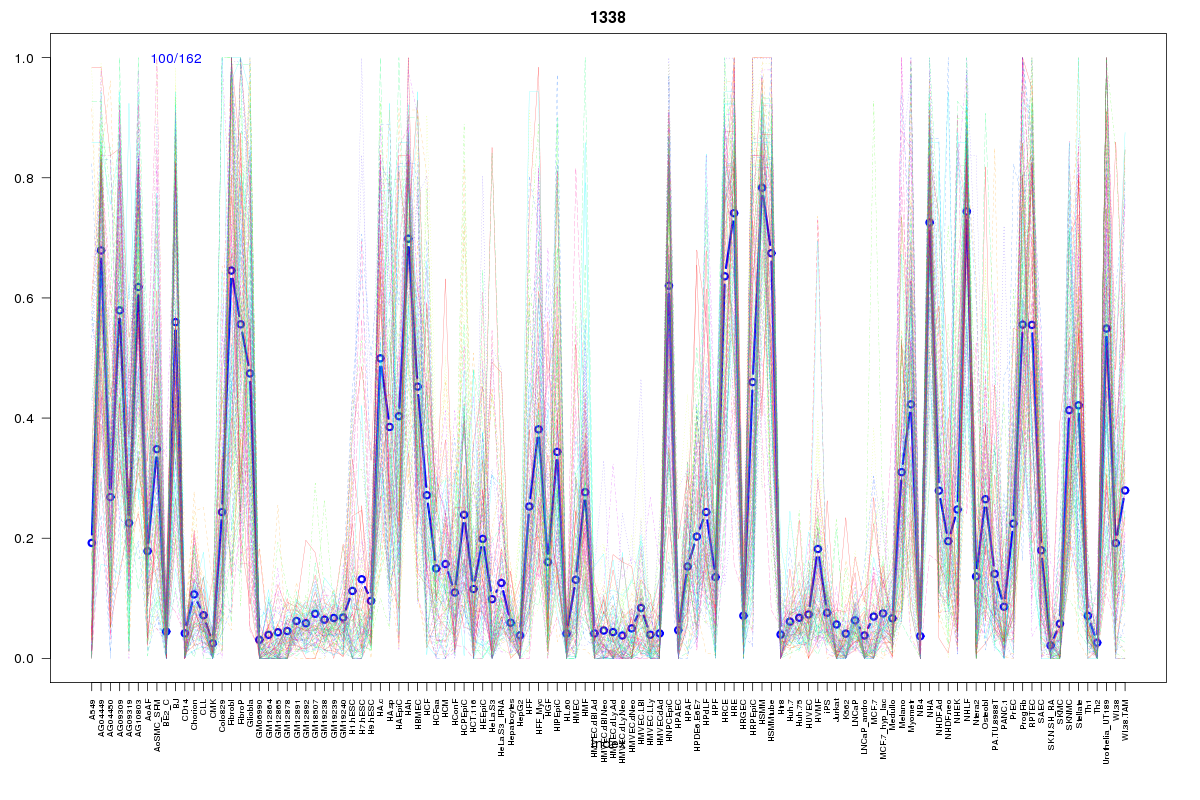 | 1338 | 1 |
 | 2063 | 1 |
 | 1070 | 1 |
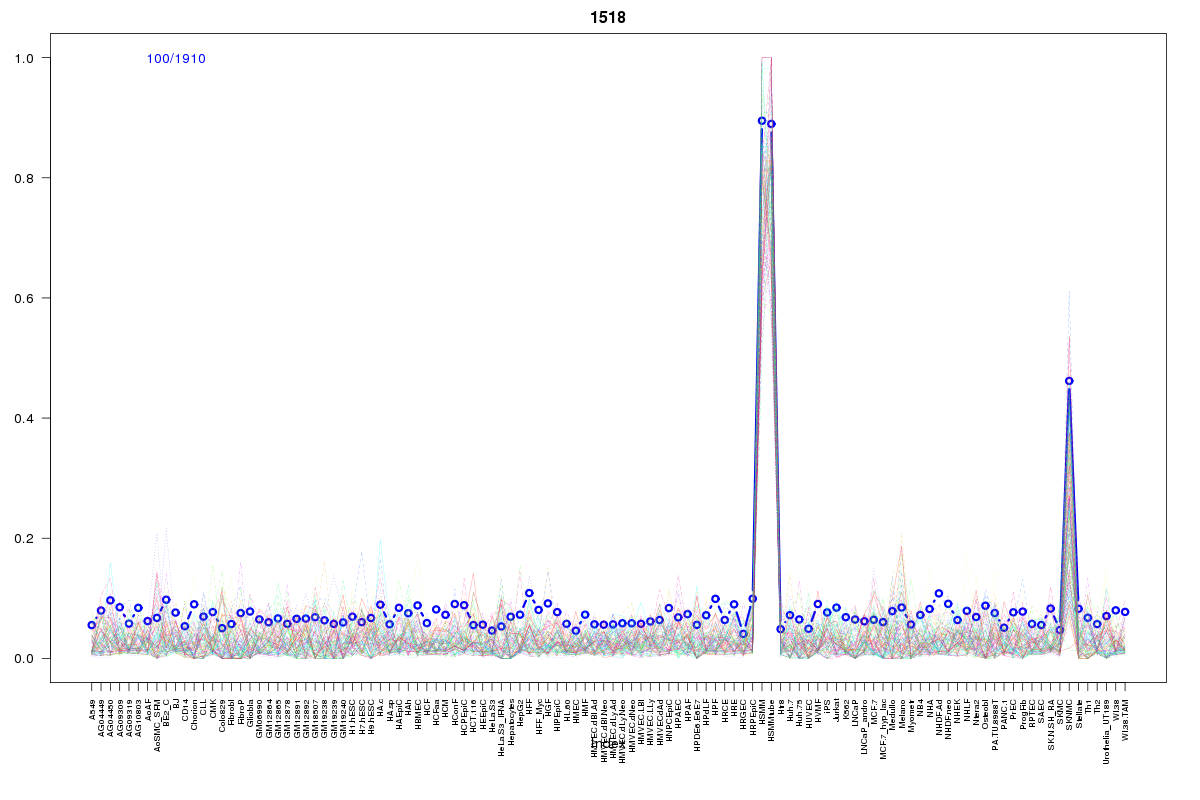 | 1518 | 1 |
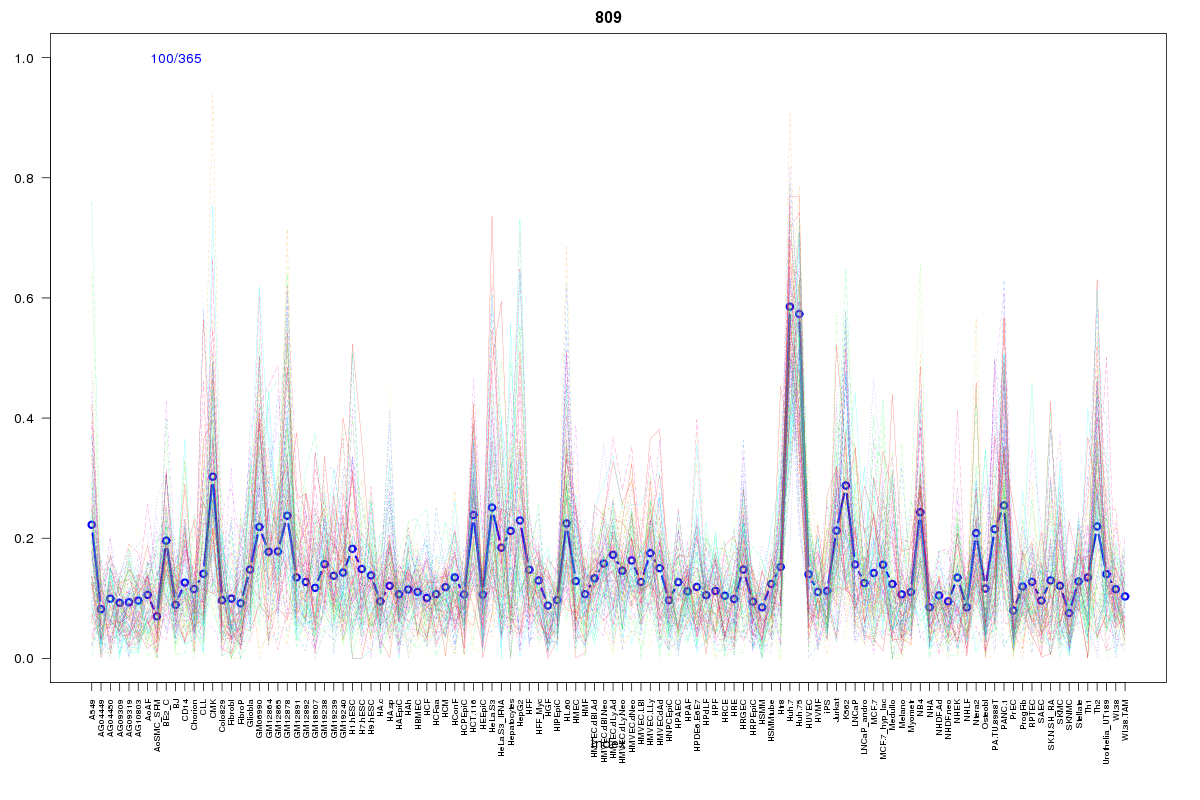 | 809 | 1 |
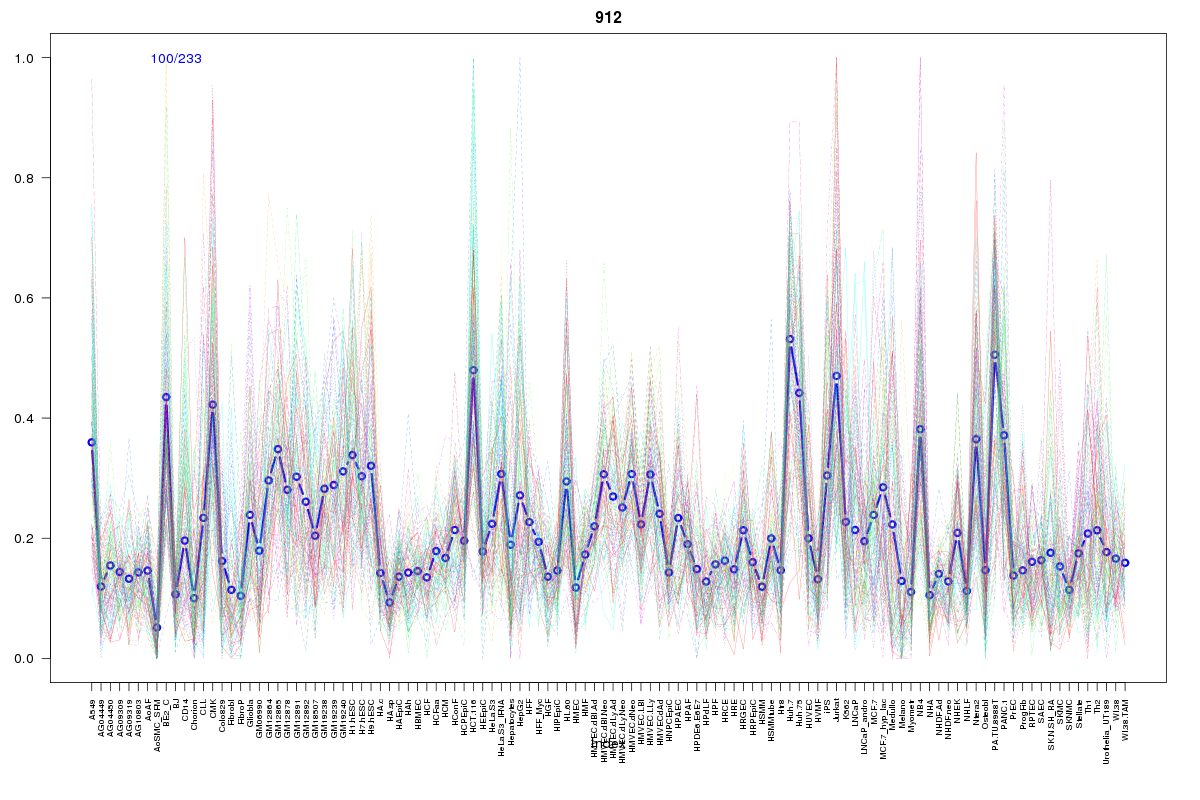 | 912 | 1 |
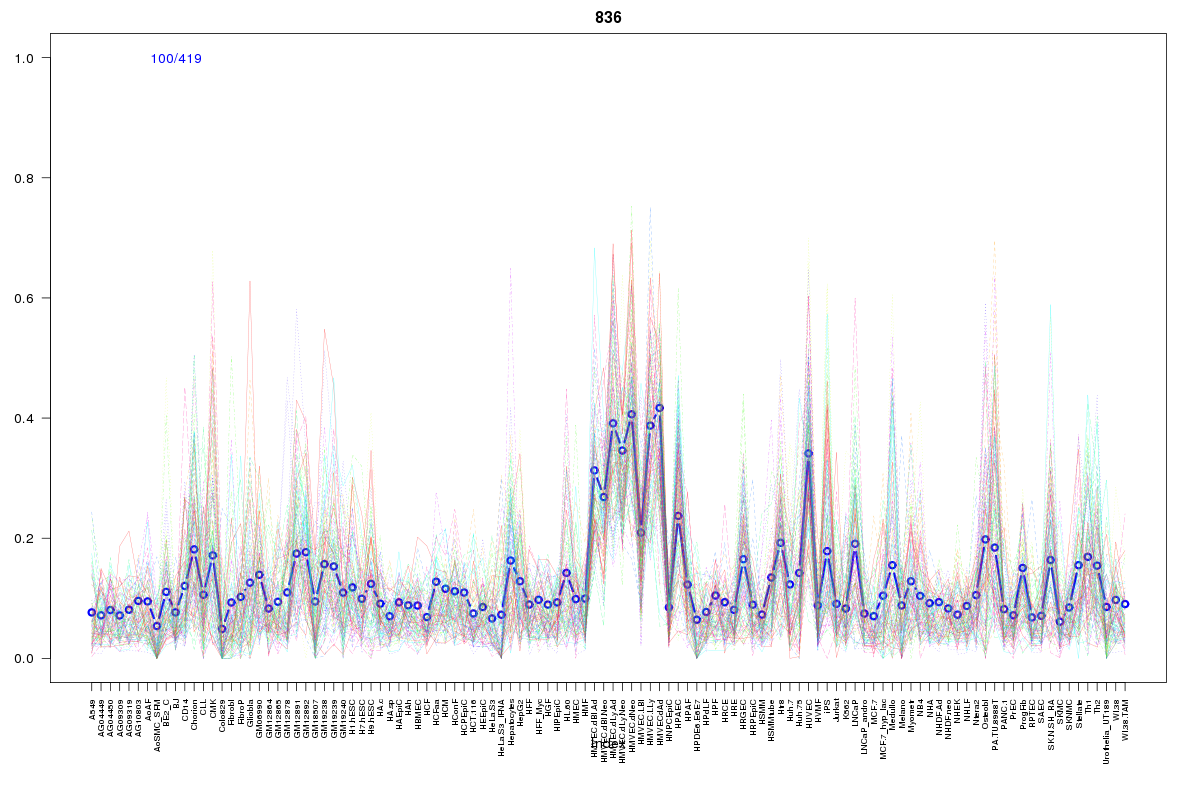 | 836 | 1 |
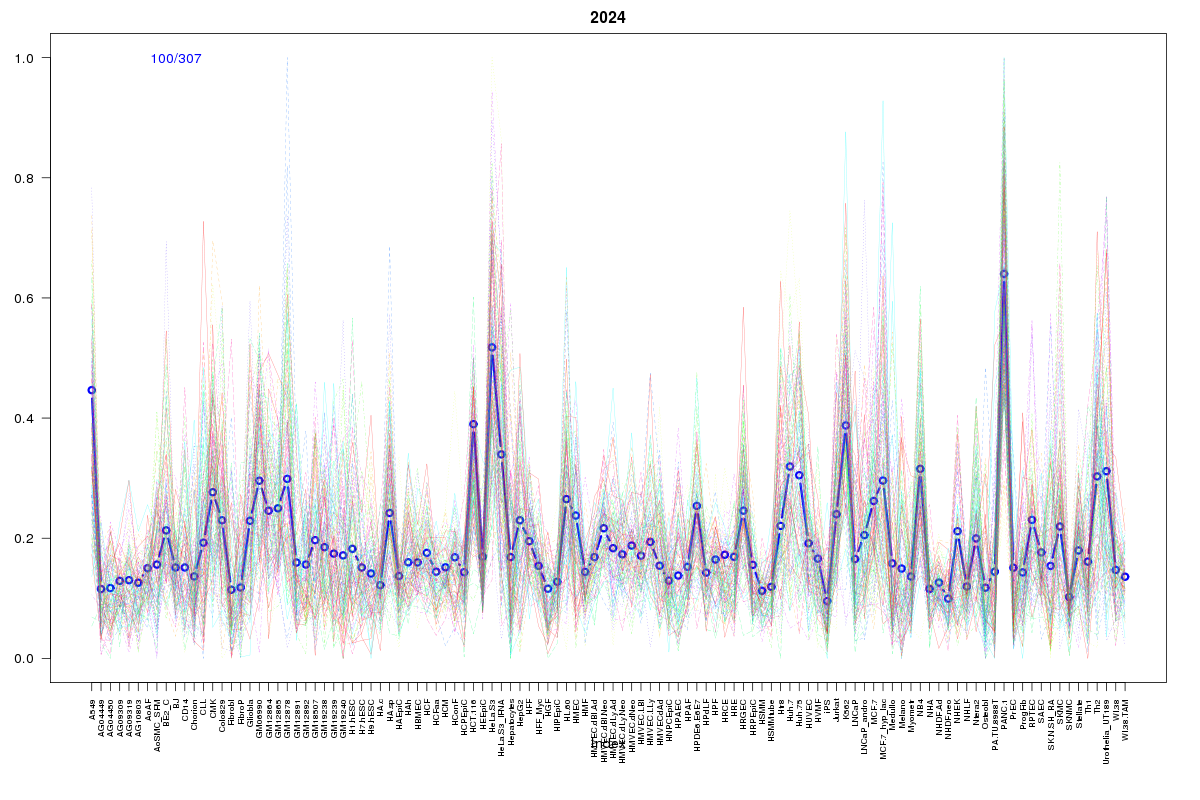 | 2024 | 1 |
 | 569 | 1 |
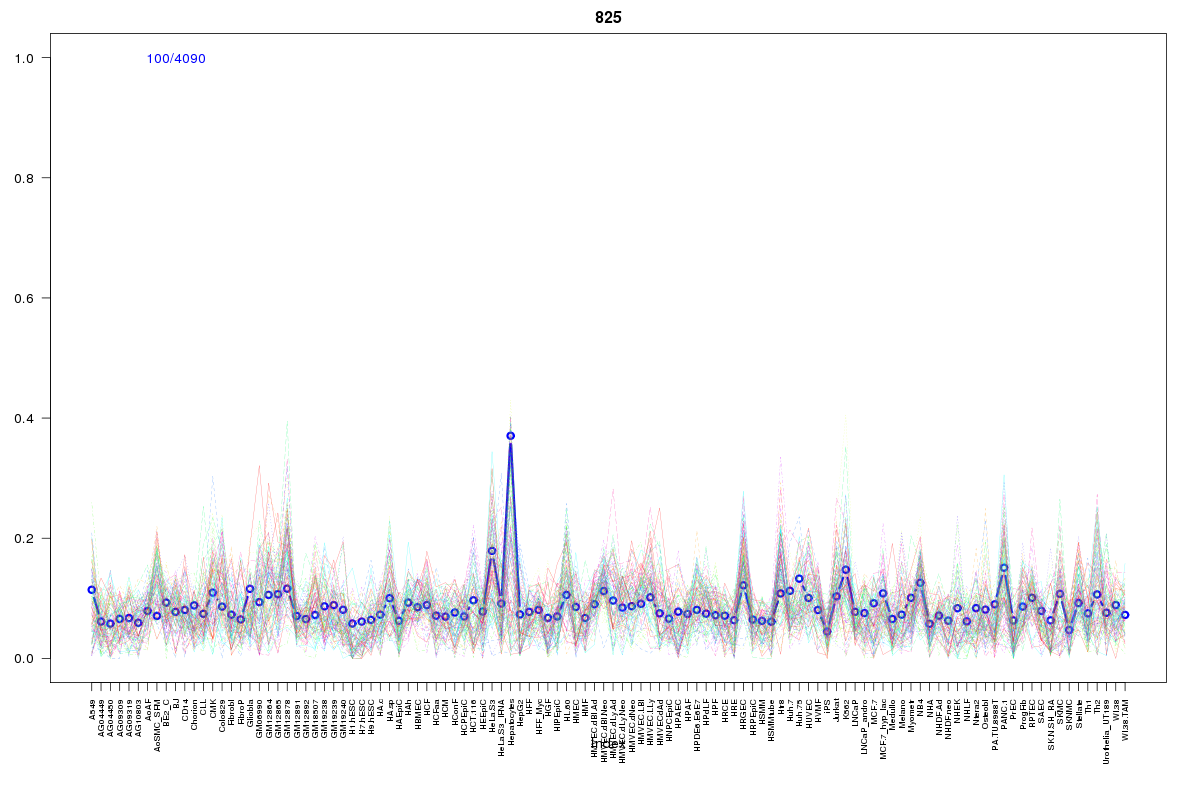 | 825 | 1 |
 | 1011 | 1 |
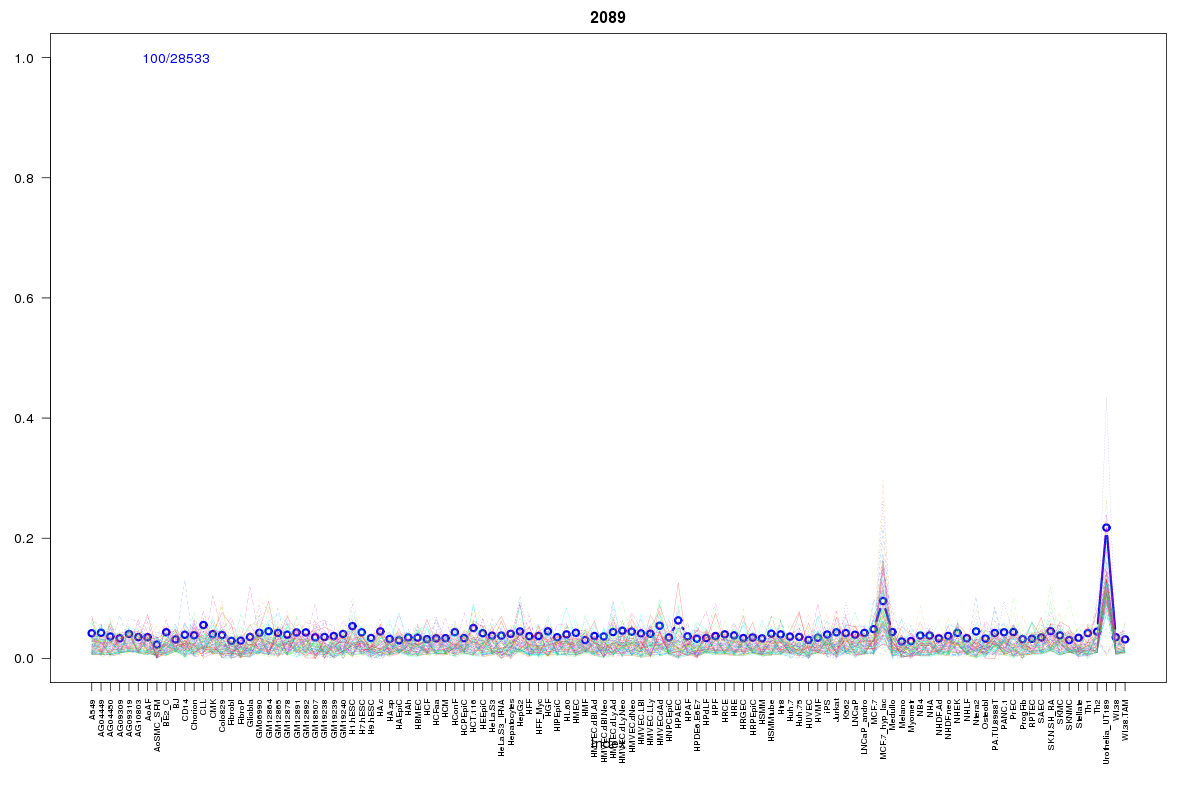 | 2089 | 1 |
 | 615 | 1 |
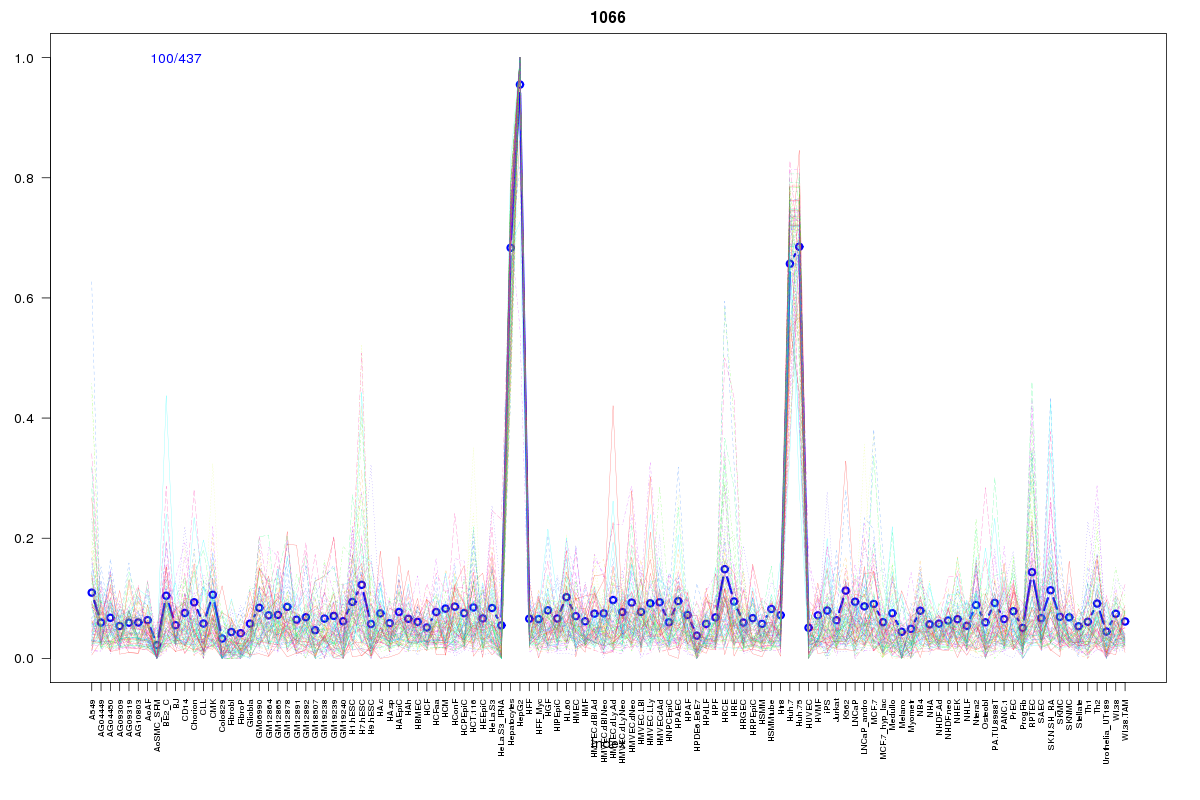 | 1066 | 1 |
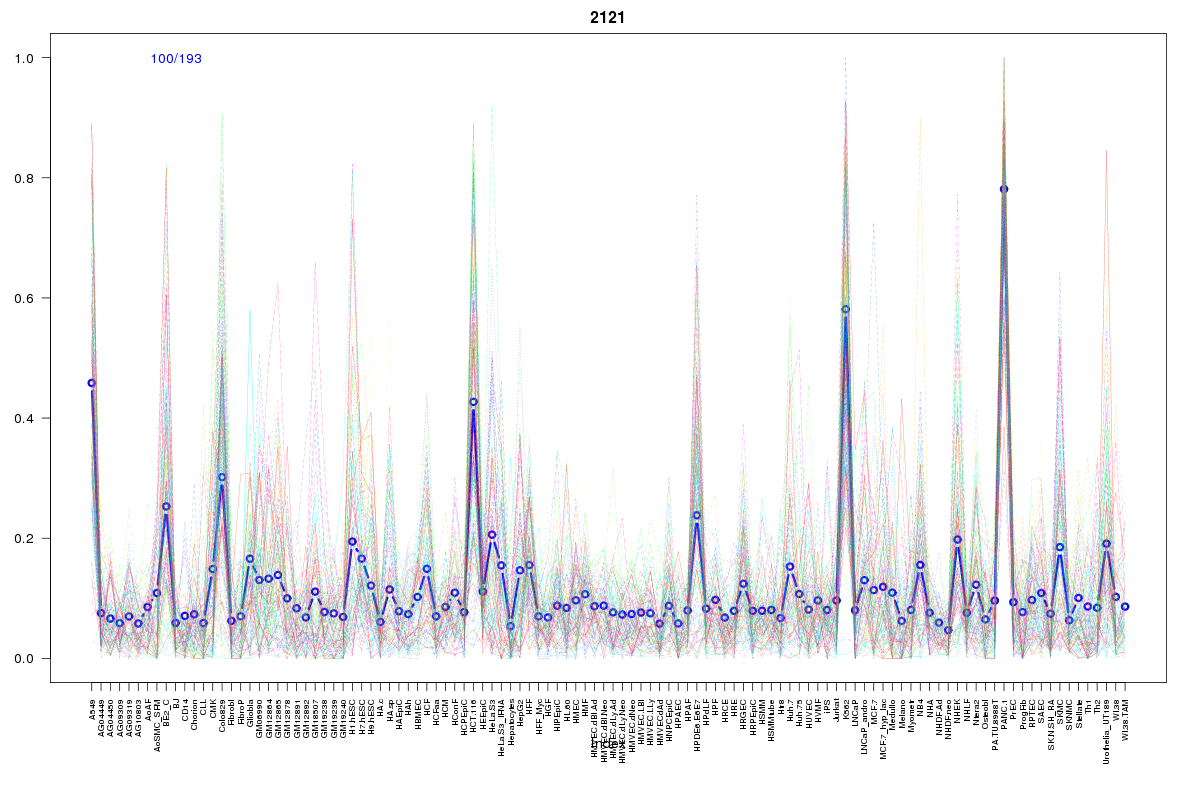 | 2121 | 1 |
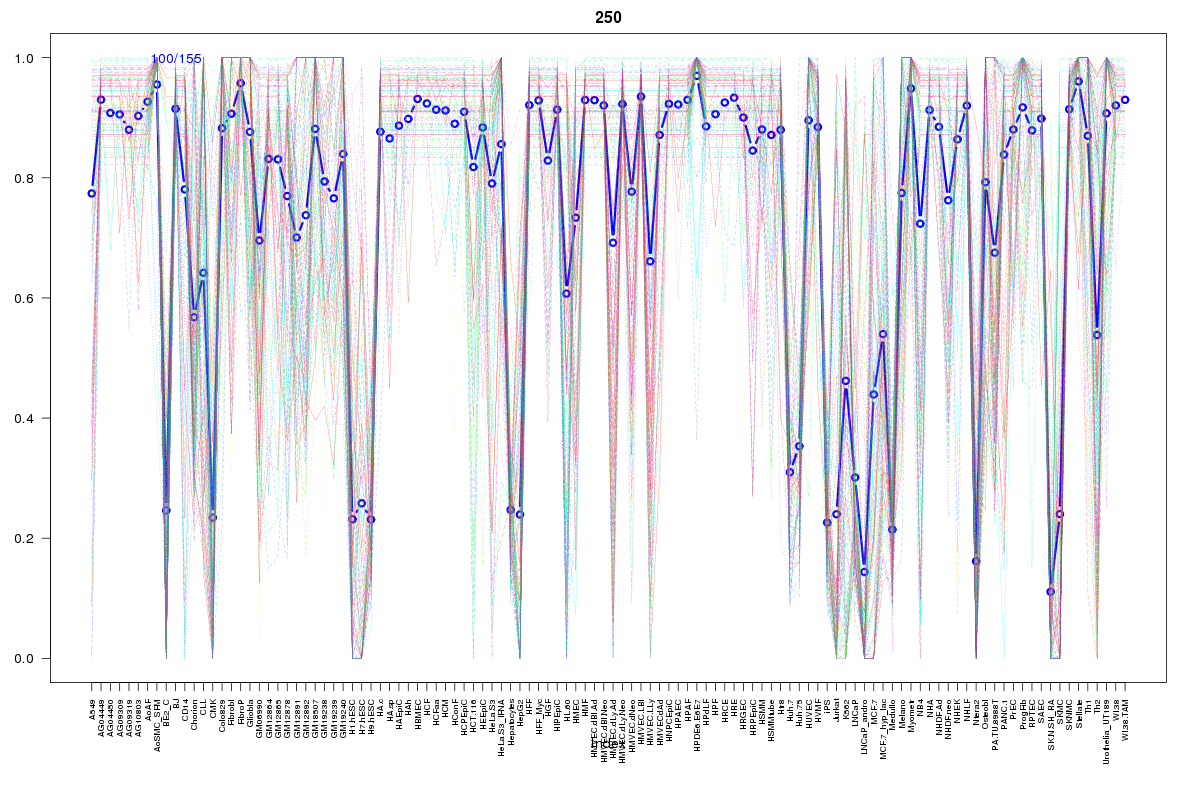 | 250 | 1 |
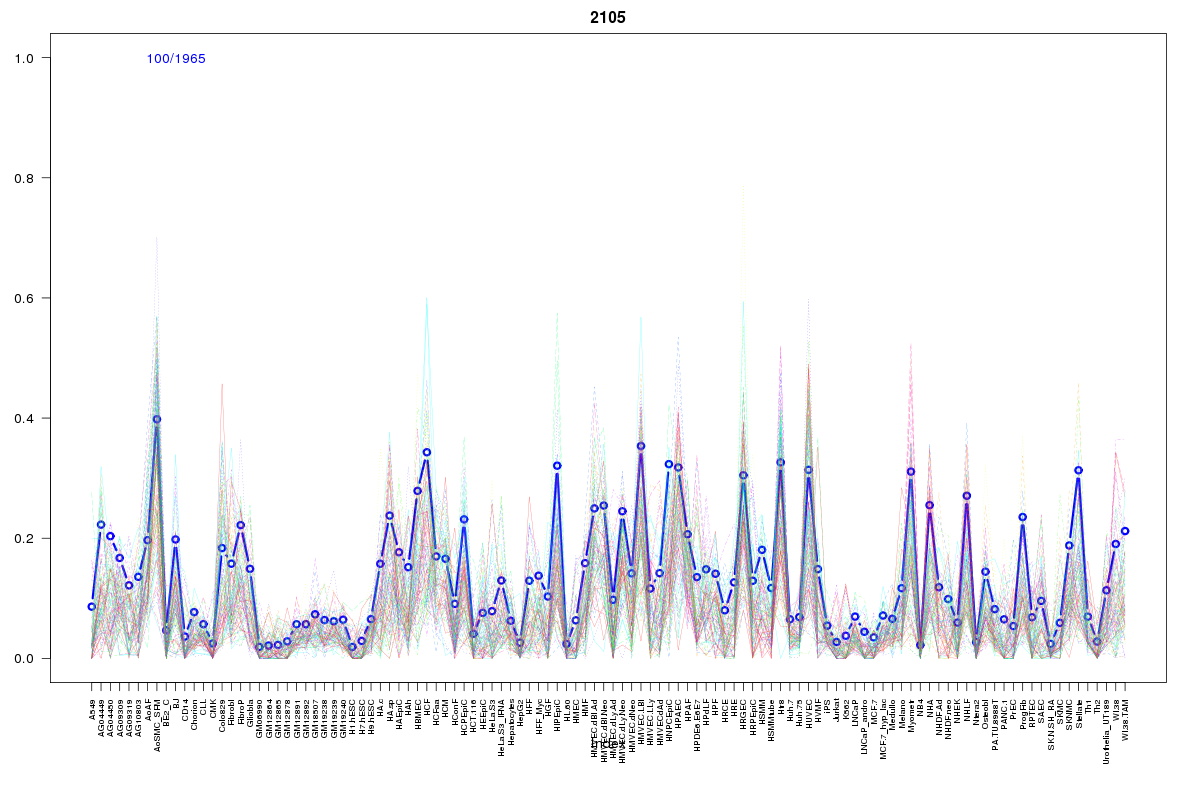 | 2105 | 1 |
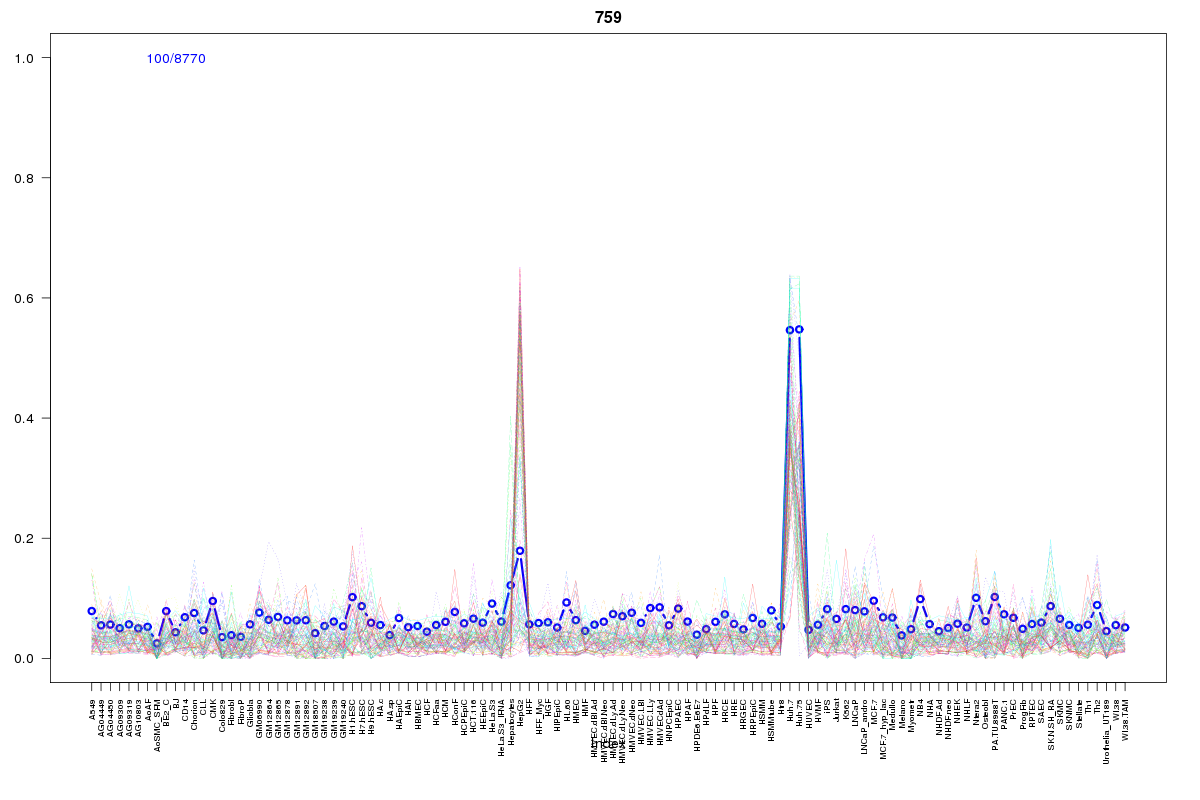 | 759 | 1 |
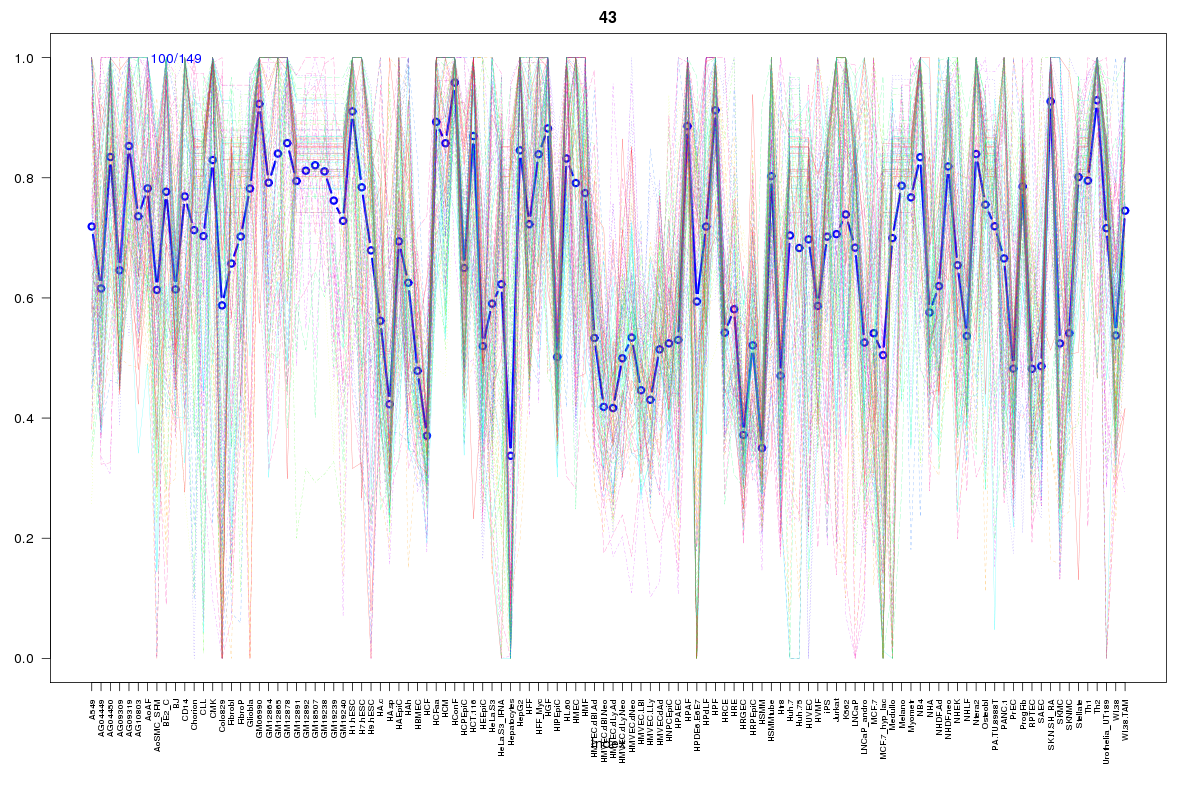 | 43 | 1 |
Resources
BED file downloads
Connects to 24 DHS sitesTop 10 Correlated DHS Sites
p-values indiciate significant higher or lower correlation| Location | Cluster | P-value |
|---|---|---|
| chr7:99056820-99056970 | 912 | 0 |
| chr7:99069180-99069330 | 507 | 0.001 |
| chr7:99086980-99087130 | 1011 | 0.001 |
| chr7:99035585-99035735 | 881 | 0.001 |
| chr7:99104120-99104270 | 2121 | 0.003 |
| chr7:99098920-99099070 | 507 | 0.003 |
| chr7:99004320-99004470 | 2063 | 0.003 |
| chr7:99045685-99045835 | 809 | 0.004 |
| chr7:99103805-99103955 | 615 | 0.004 |
| chr7:99069440-99069590 | 2024 | 0.009 |
| chr7:98998685-98998835 | 881 | 0.012 |
External Databases
UCSCEnsembl (ENSG00000106246)