Gene: GNPDA1
chr5: 141371313-141392592Expression Profile
(log scale)
Graphical Connections
Distribution of linked clusters:
You may find it interesting if many of the connected DHS sites belong to the same cluster.| Cluster Profile | Cluster ID | Number of DHS sites in this cluster |
|---|---|---|
 | 2110 | 2 |
 | 1311 | 1 |
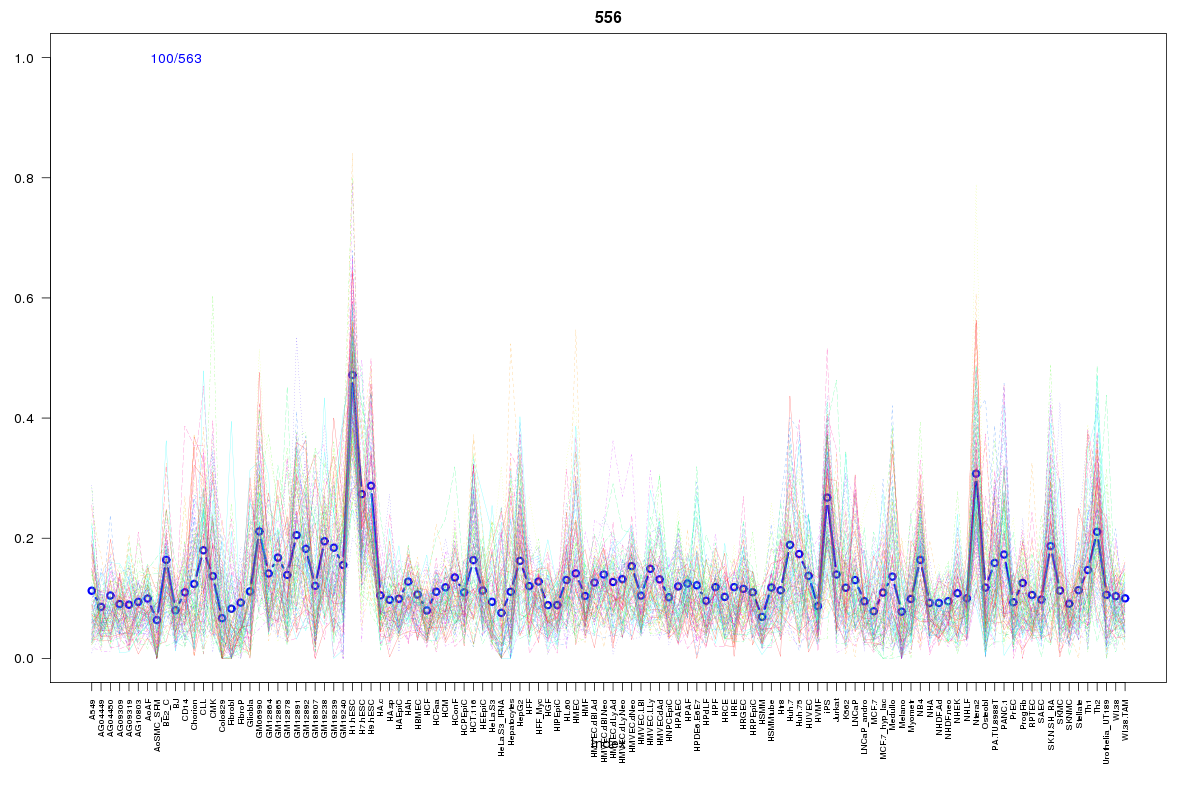 | 556 | 1 |
 | 2017 | 1 |
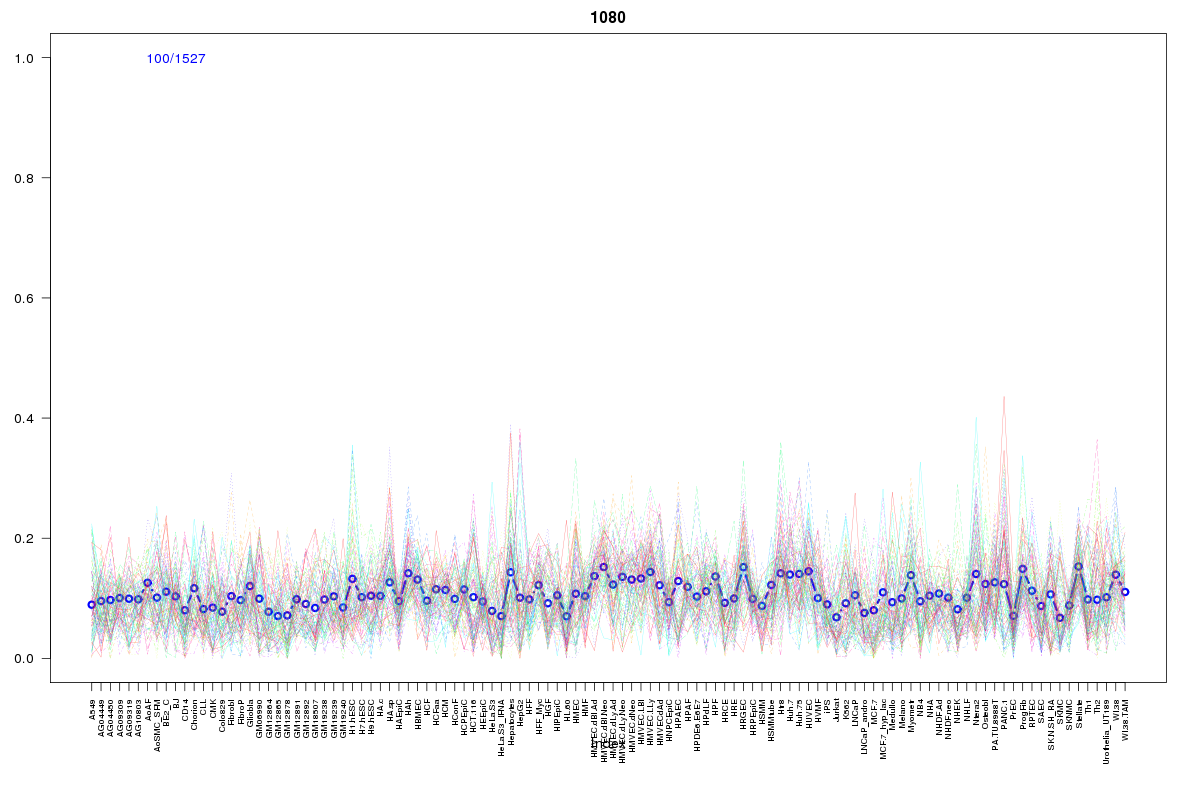 | 1080 | 1 |
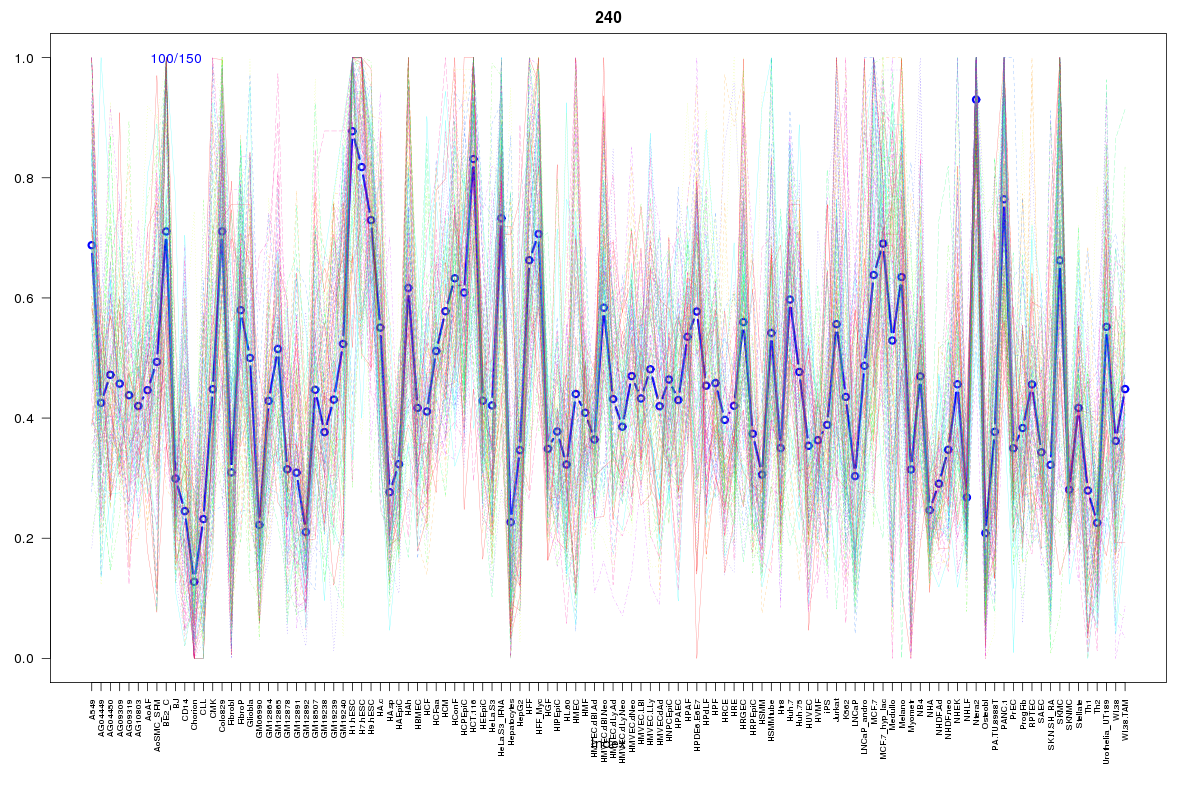 | 240 | 1 |
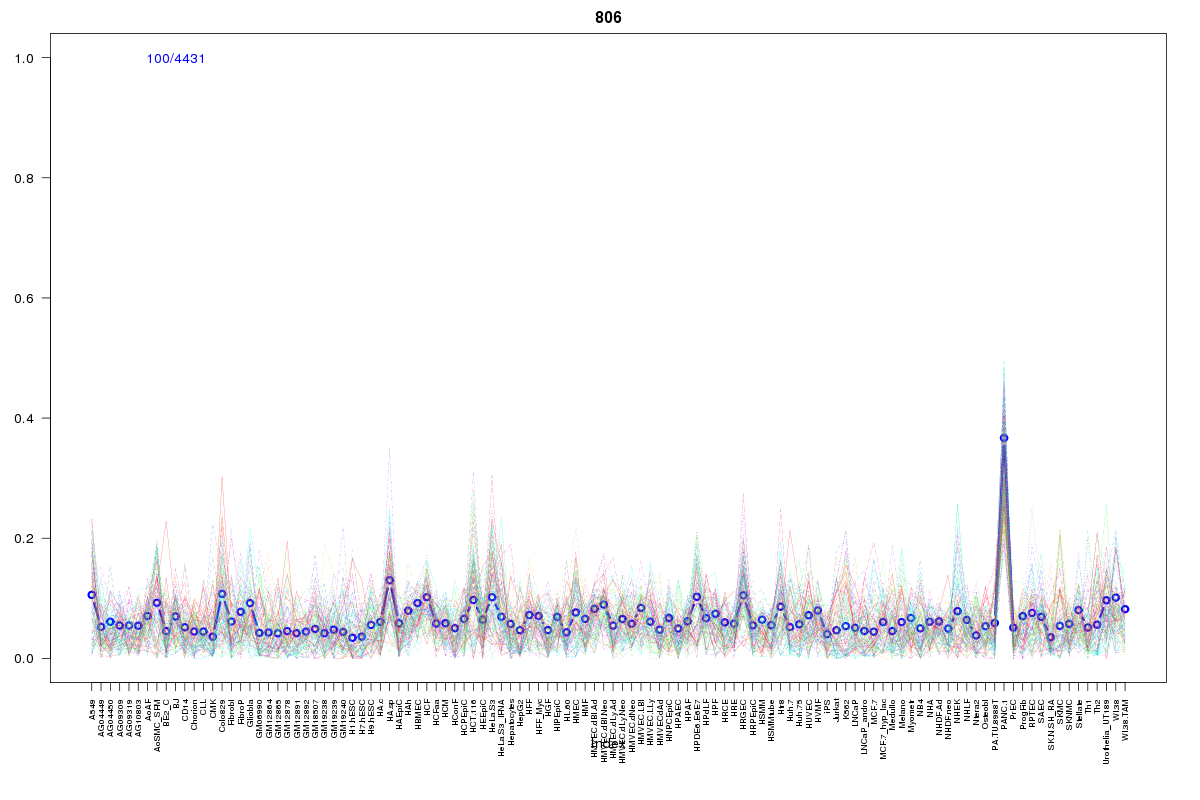 | 806 | 1 |
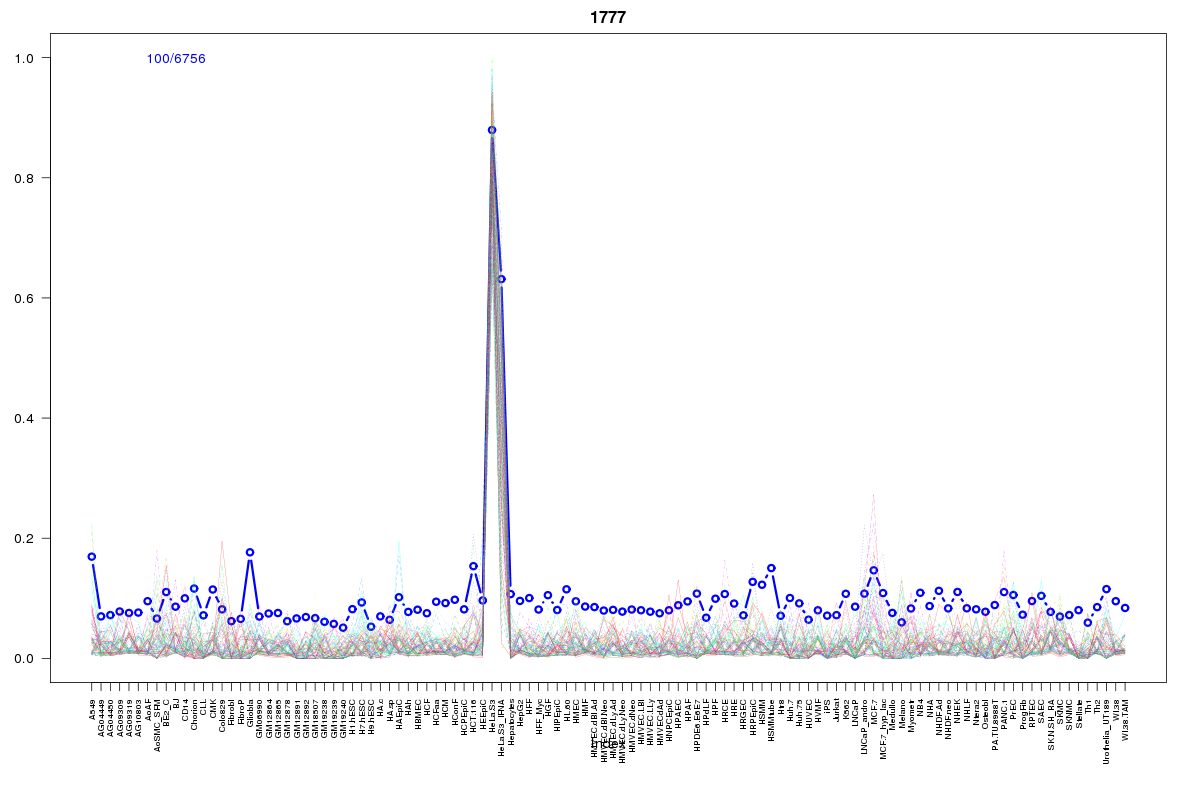 | 1777 | 1 |
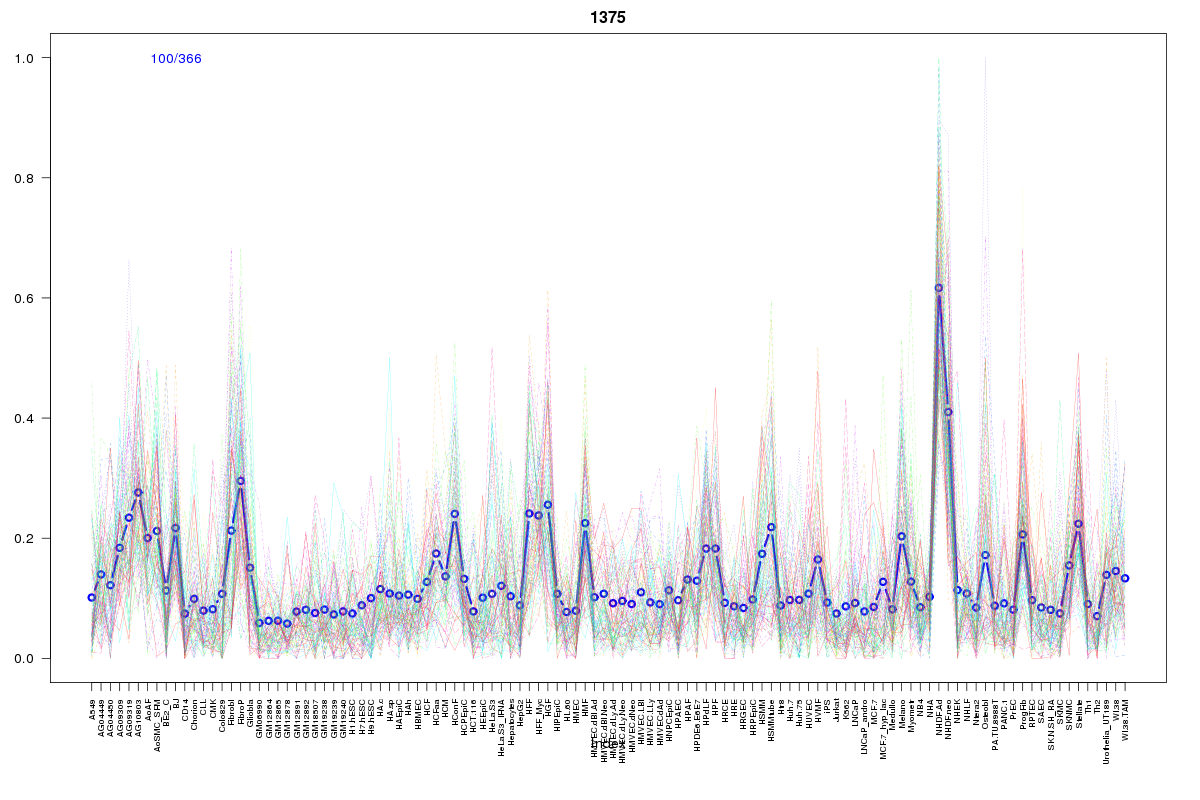 | 1375 | 1 |
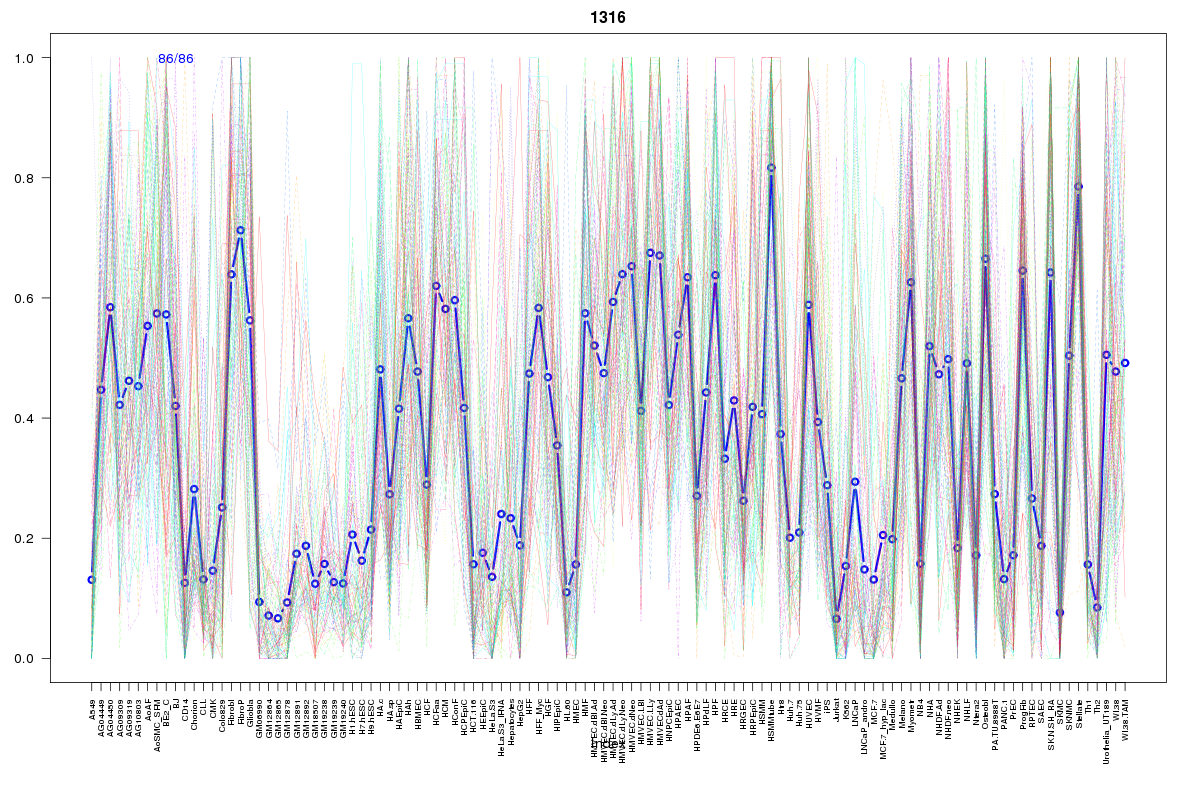 | 1316 | 1 |
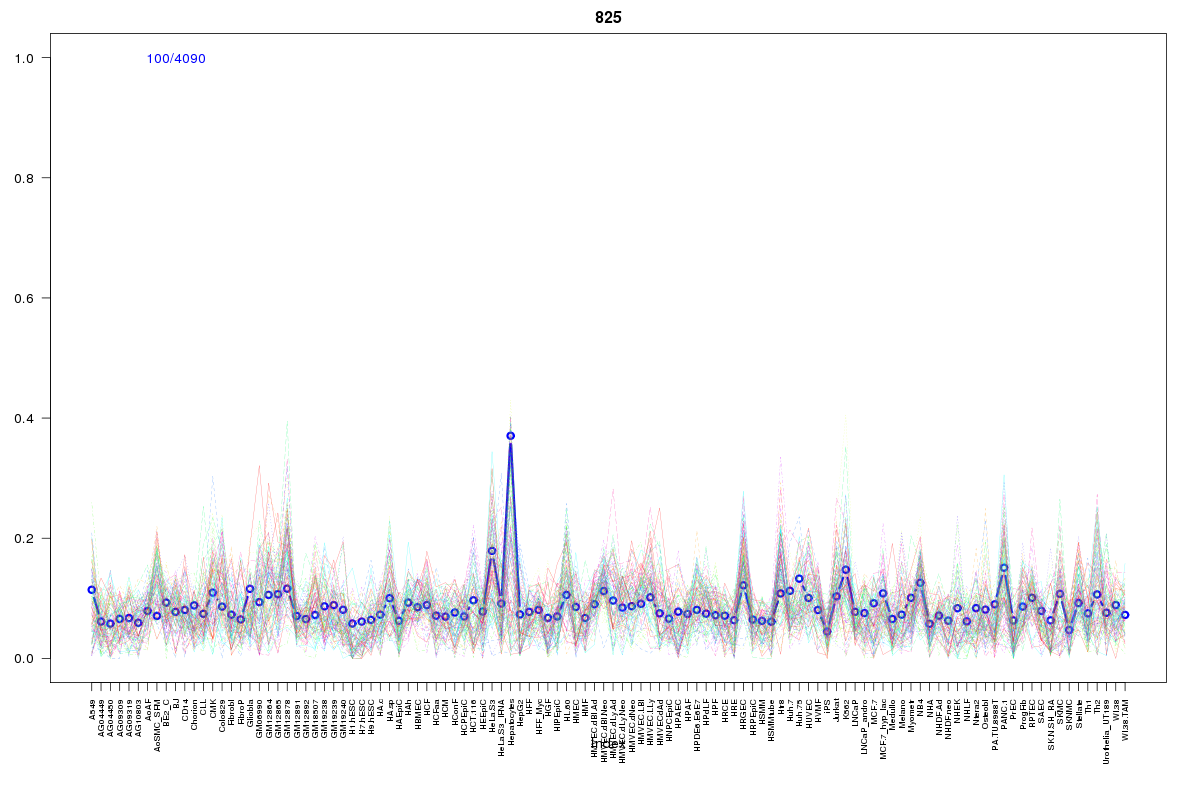 | 825 | 1 |
 | 15 | 1 |
 | 66 | 1 |
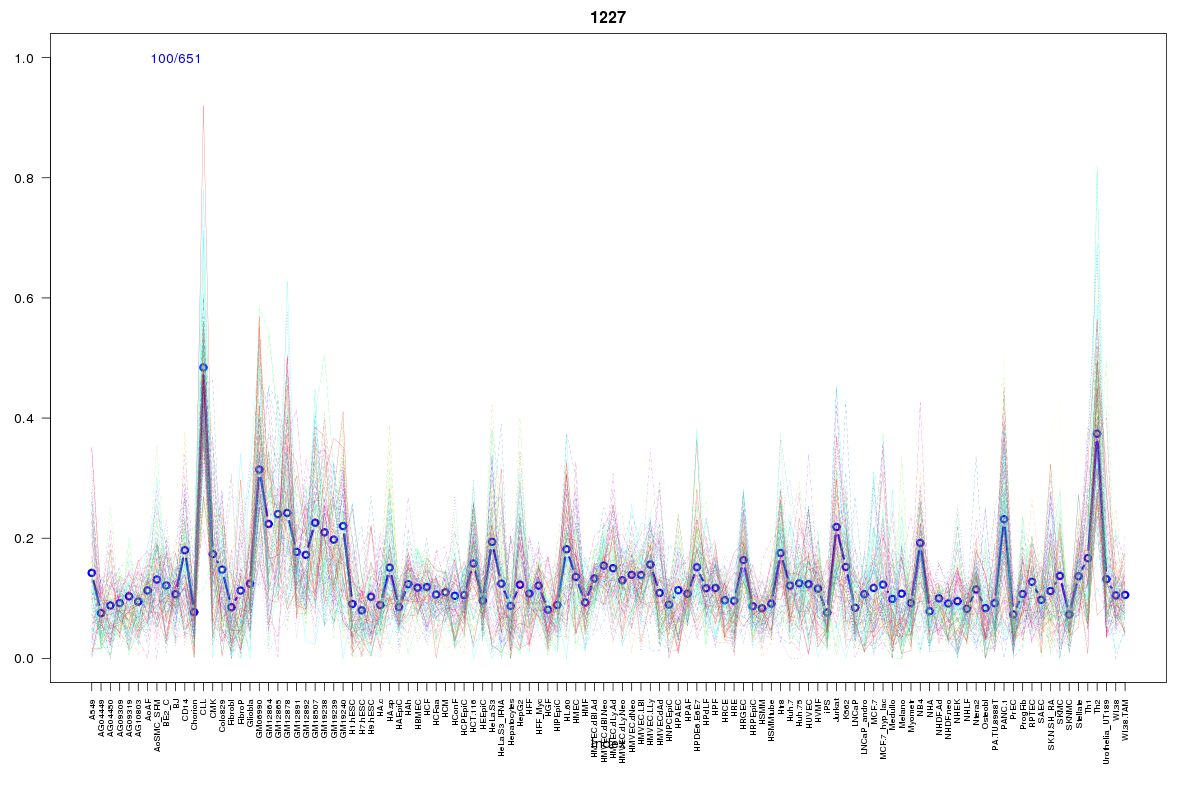 | 1227 | 1 |
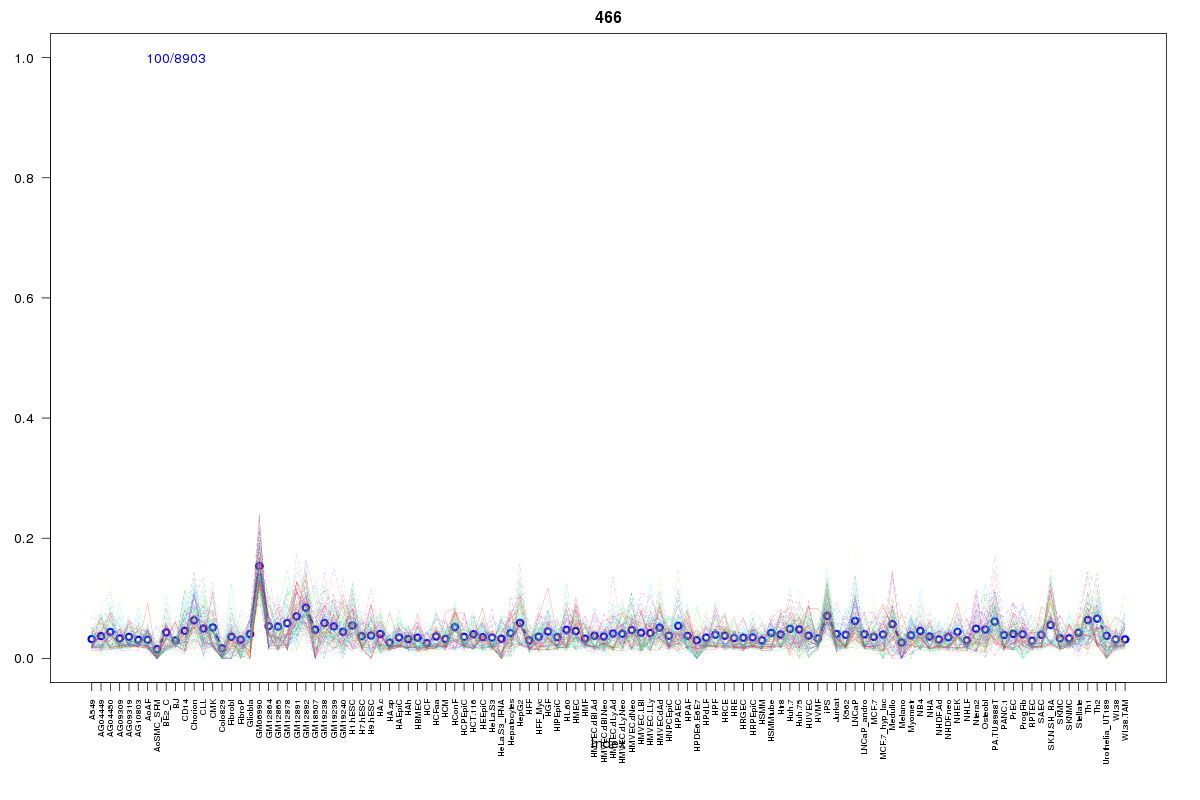 | 466 | 1 |
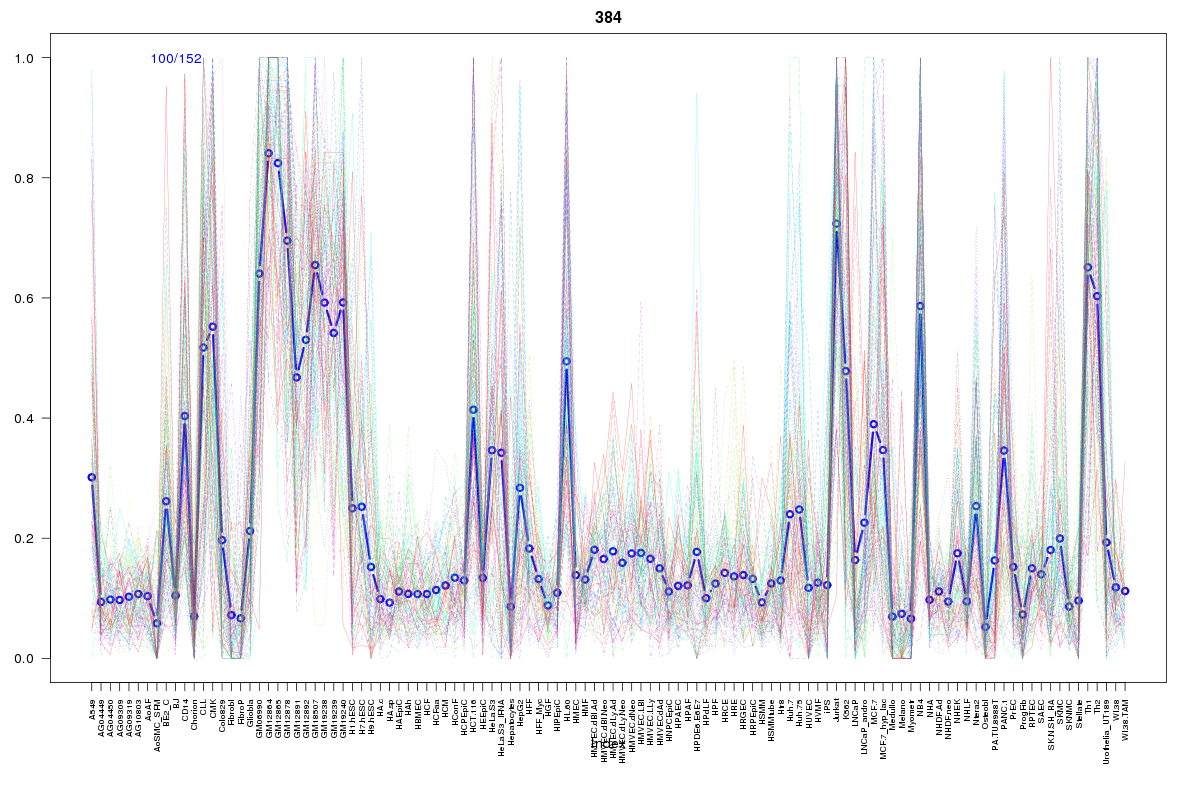 | 384 | 1 |
Resources
BED file downloads
Connects to 17 DHS sitesTop 10 Correlated DHS Sites
p-values indiciate significant higher or lower correlation| Location | Cluster | P-value |
|---|---|---|
| chr5:141391725-141391875 | 1311 | 0.001 |
| chr5:141393965-141394115 | 1080 | 0.004 |
| chr5:141393200-141393350 | 2017 | 0.004 |
| chr5:141407000-141407150 | 1777 | 0.007 |
| chr5:141404460-141404610 | 240 | 0.008 |
| chr5:141391940-141392090 | 556 | 0.01 |
| chr5:141489400-141489550 | 825 | 0.013 |
| chr5:141387285-141387435 | 2110 | 0.014 |
| chr5:141439180-141439330 | 1375 | 0.014 |
| chr5:141300445-141300595 | 2110 | 0.014 |
| chr5:141443505-141443655 | 1316 | 0.016 |
External Databases
UCSCEnsembl (ENSG00000113552)