Gene: DBT
chr1: 100652474-100715390Expression Profile
(log scale)
Graphical Connections
Distribution of linked clusters:
You may find it interesting if many of the connected DHS sites belong to the same cluster.| Cluster Profile | Cluster ID | Number of DHS sites in this cluster |
|---|---|---|
 | 2186 | 1 |
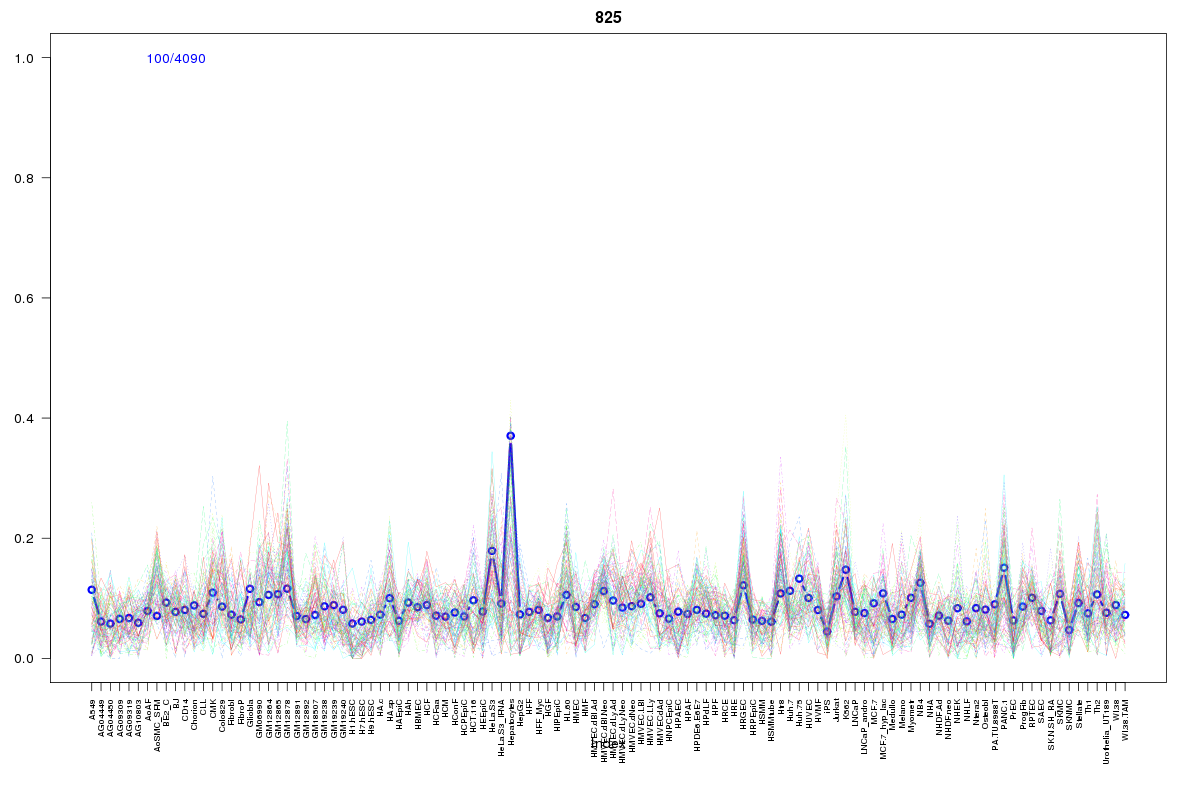 | 825 | 1 |
 | 739 | 1 |
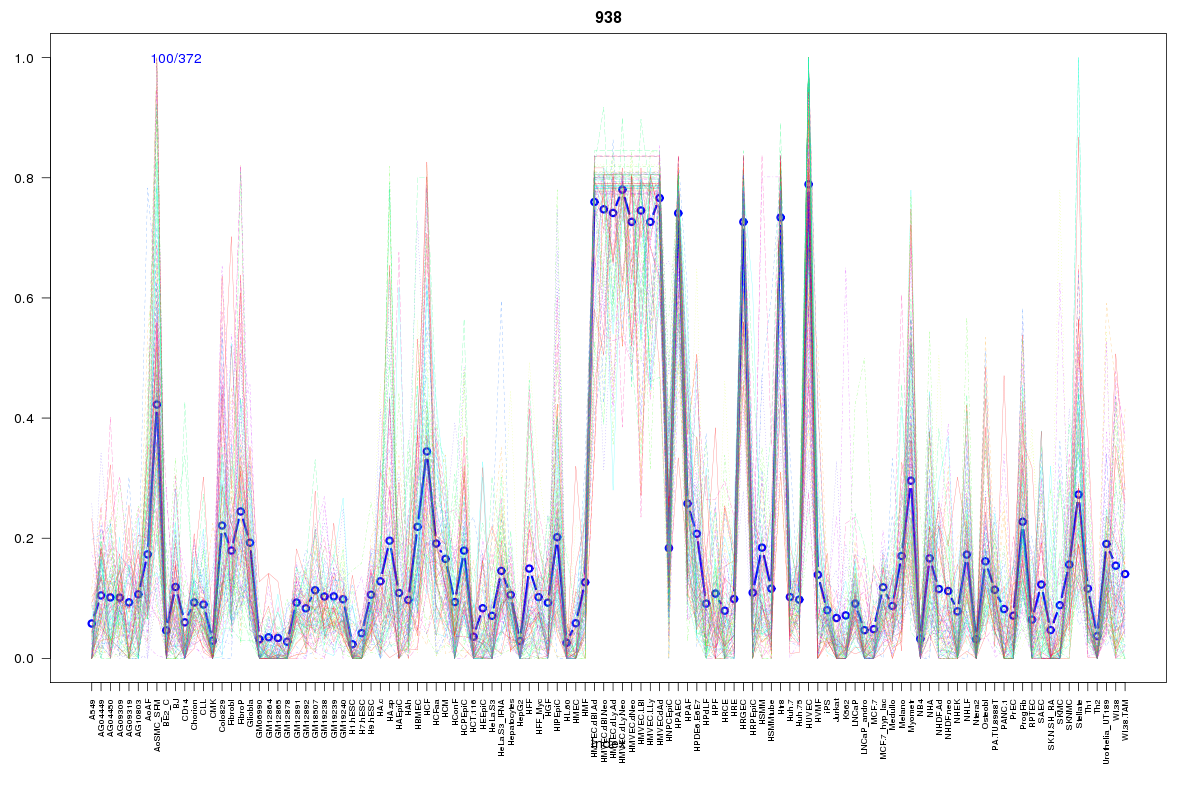 | 938 | 1 |
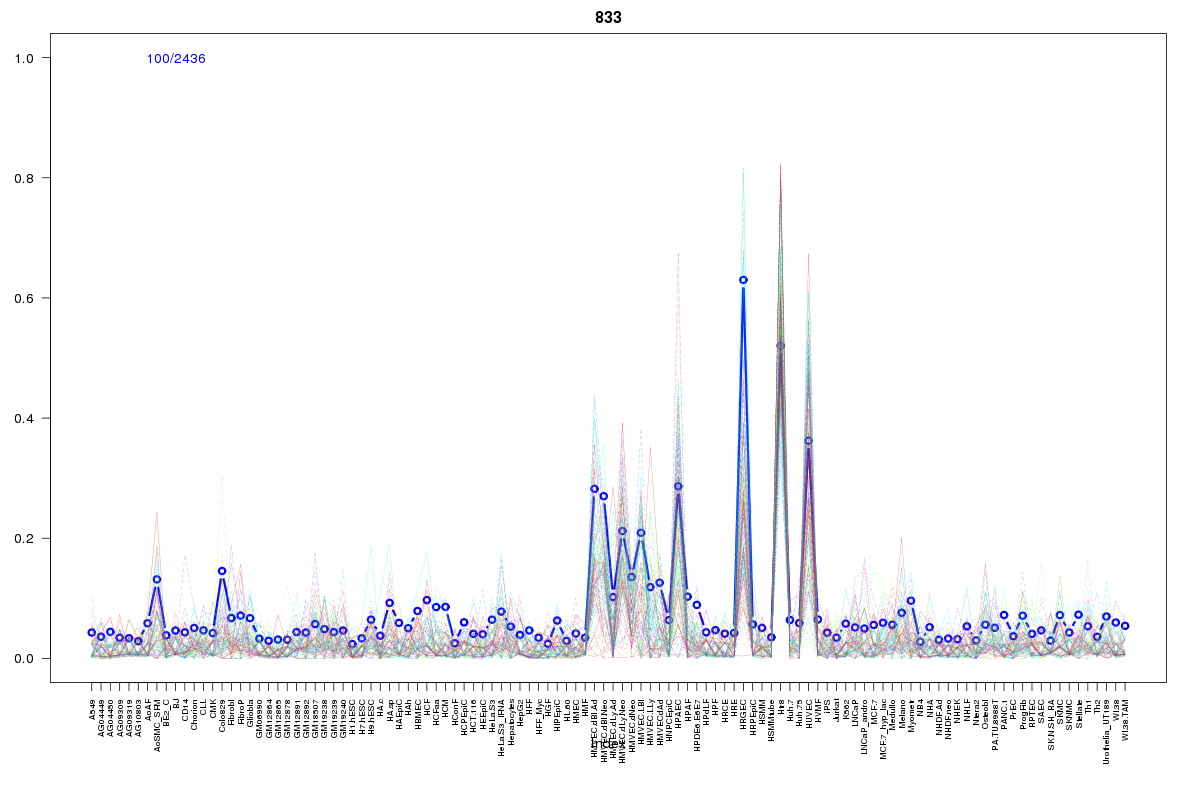 | 833 | 1 |
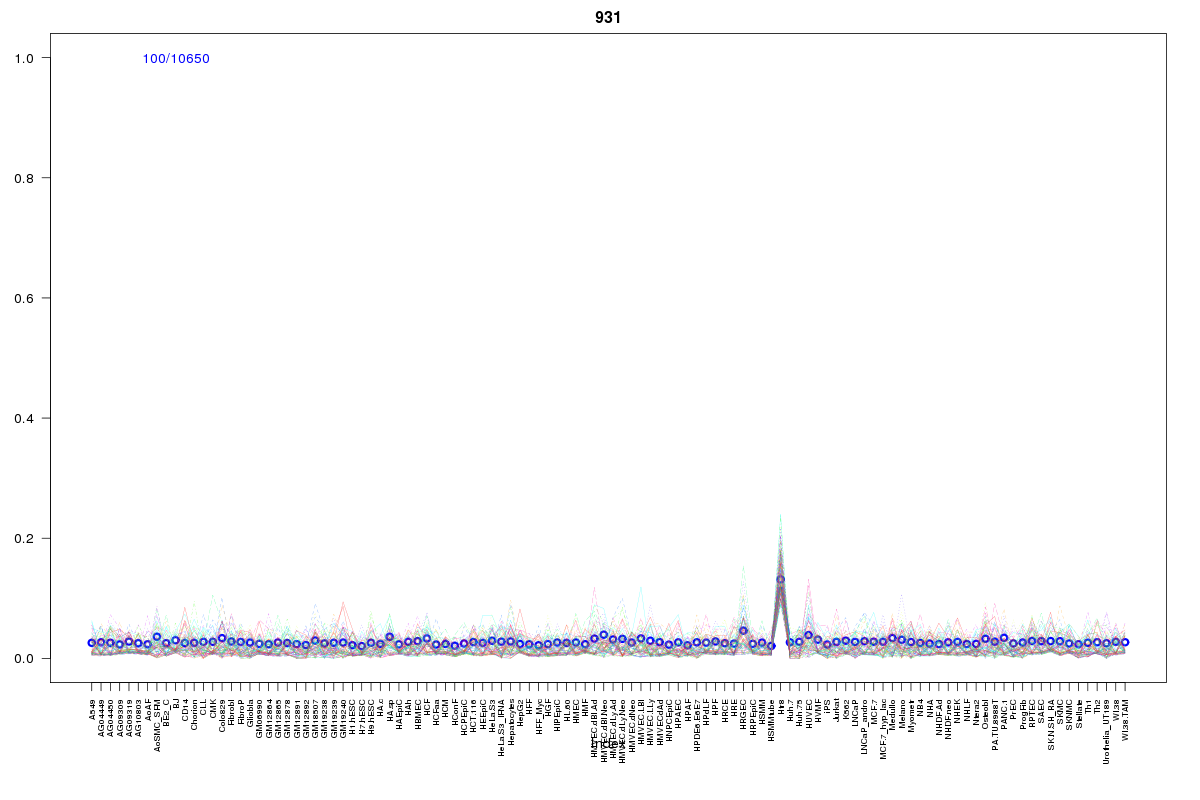 | 931 | 1 |
 | 2223 | 1 |
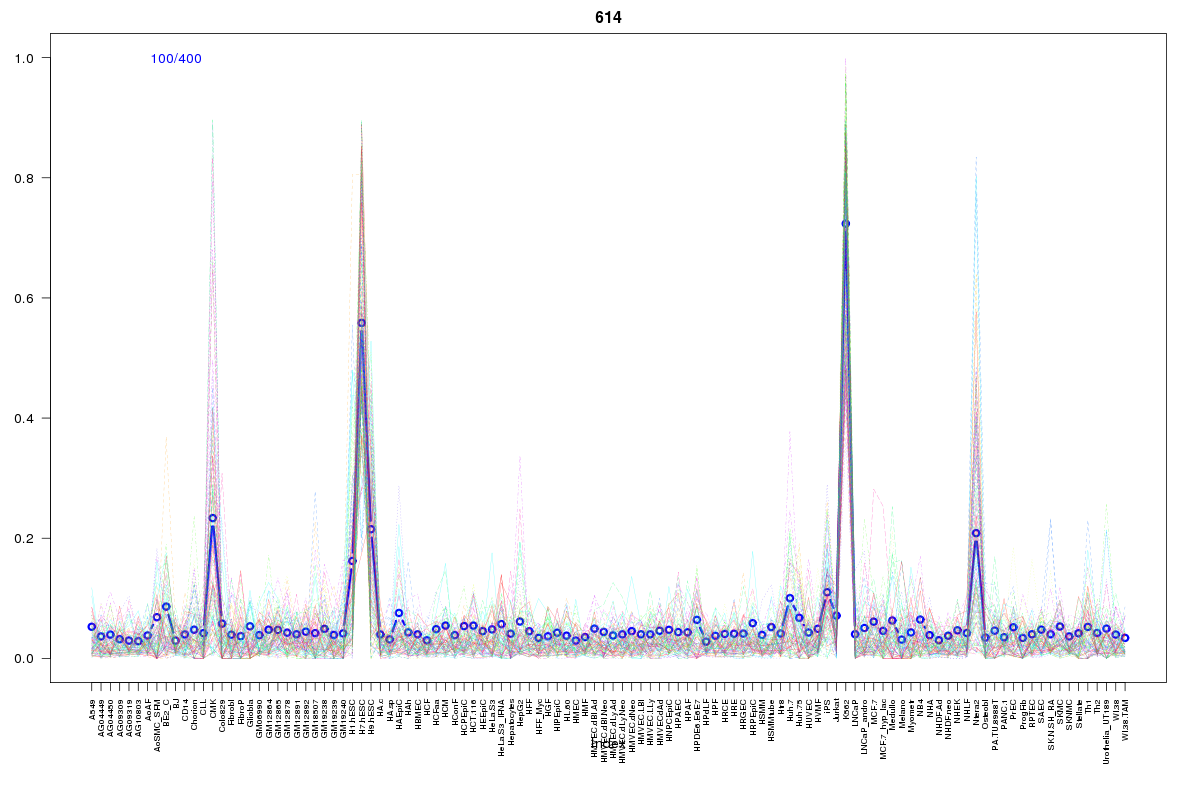 | 614 | 1 |
Resources
BED file downloads
Connects to 8 DHS sitesTop 10 Correlated DHS Sites
p-values indiciate significant higher or lower correlation| Location | Cluster | P-value |
|---|---|---|
| chr1:100791165-100791315 | 614 | 0.004 |
| chr1:100645880-100646030 | 2186 | 0.014 |
| chr1:100788340-100788490 | 2223 | 0.014 |
| chr1:100731105-100731255 | 825 | 0.024 |
| chr1:100758340-100758490 | 938 | 0.005 |
| chr1:100758585-100758735 | 833 | 0.004 |
| chr1:100759100-100759250 | 931 | 0.004 |
| chr1:100755980-100756130 | 739 | 0.002 |
External Databases
UCSCEnsembl (ENSG00000137992)