Gene: CASQ1
chr1: 160160284-160171674Expression Profile
(log scale)
Graphical Connections
Distribution of linked clusters:
You may find it interesting if many of the connected DHS sites belong to the same cluster.| Cluster Profile | Cluster ID | Number of DHS sites in this cluster |
|---|---|---|
 | 2211 | 3 |
 | 15 | 3 |
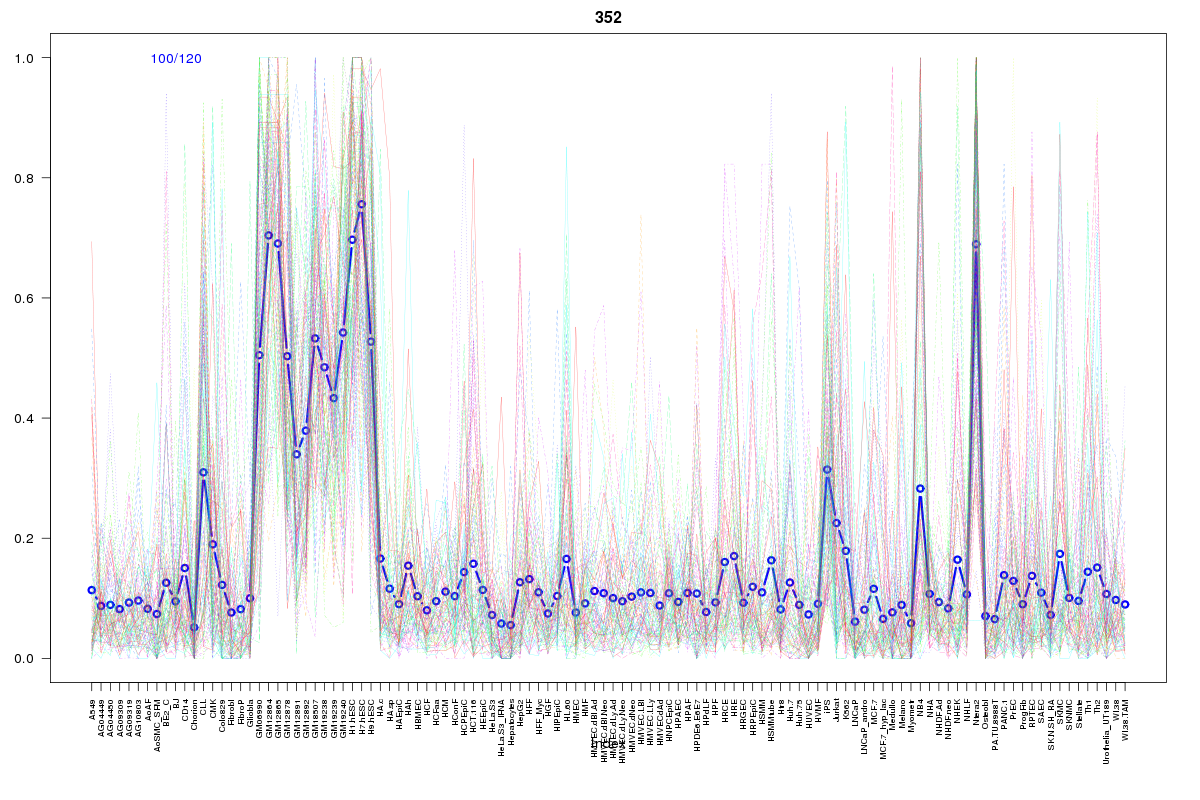 | 352 | 1 |
 | 103 | 1 |
 | 10 | 1 |
 | 416 | 1 |
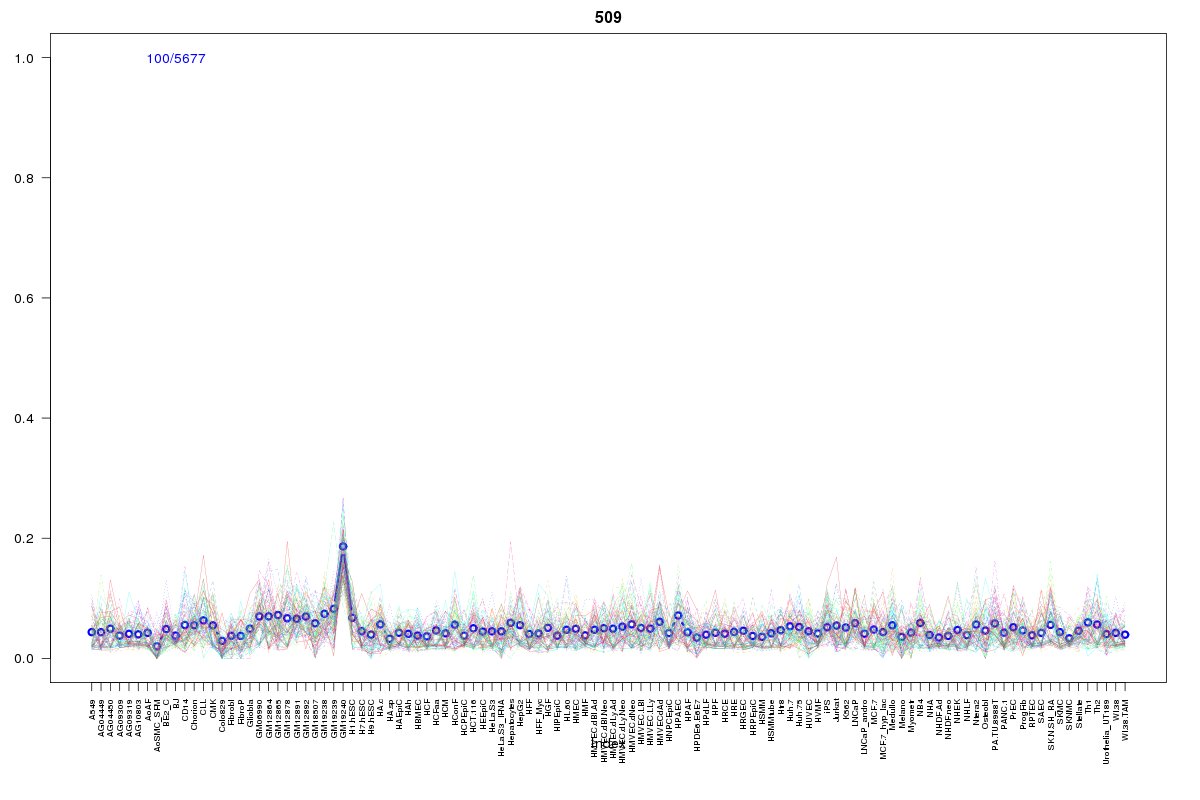 | 509 | 1 |
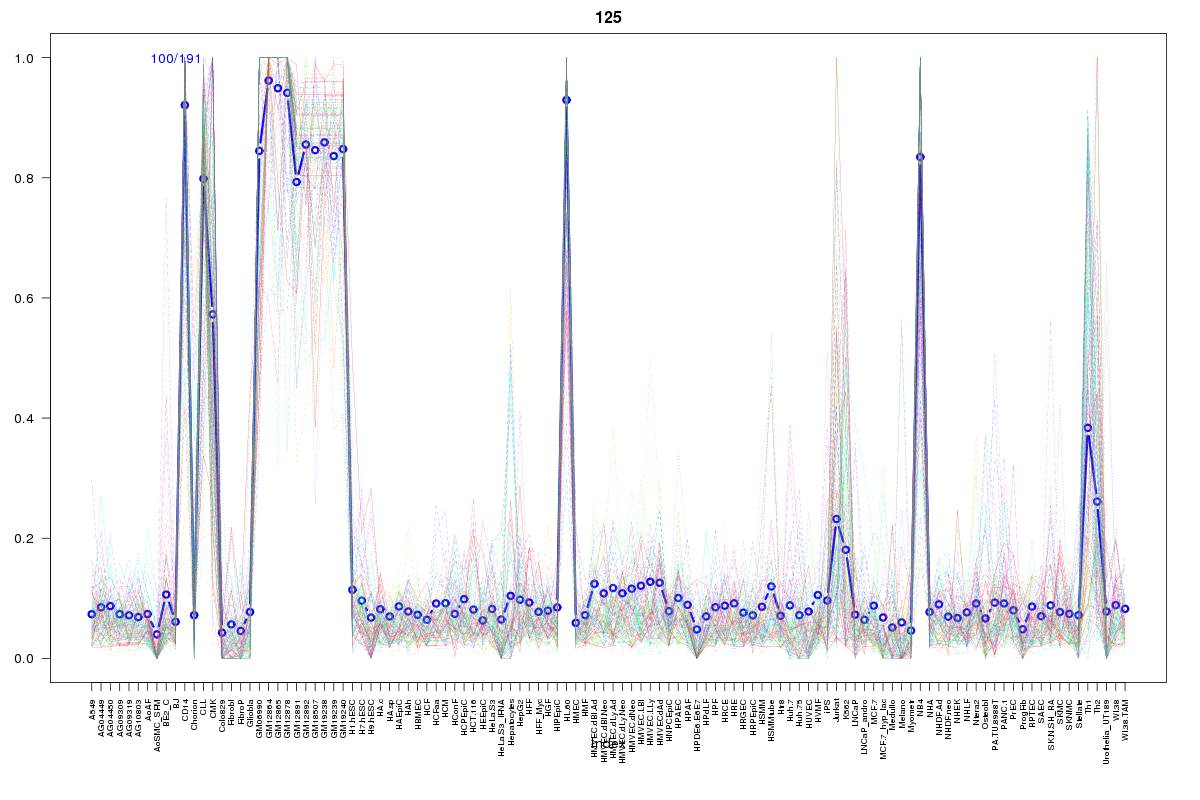 | 125 | 1 |
 | 2205 | 1 |
 | 1605 | 1 |
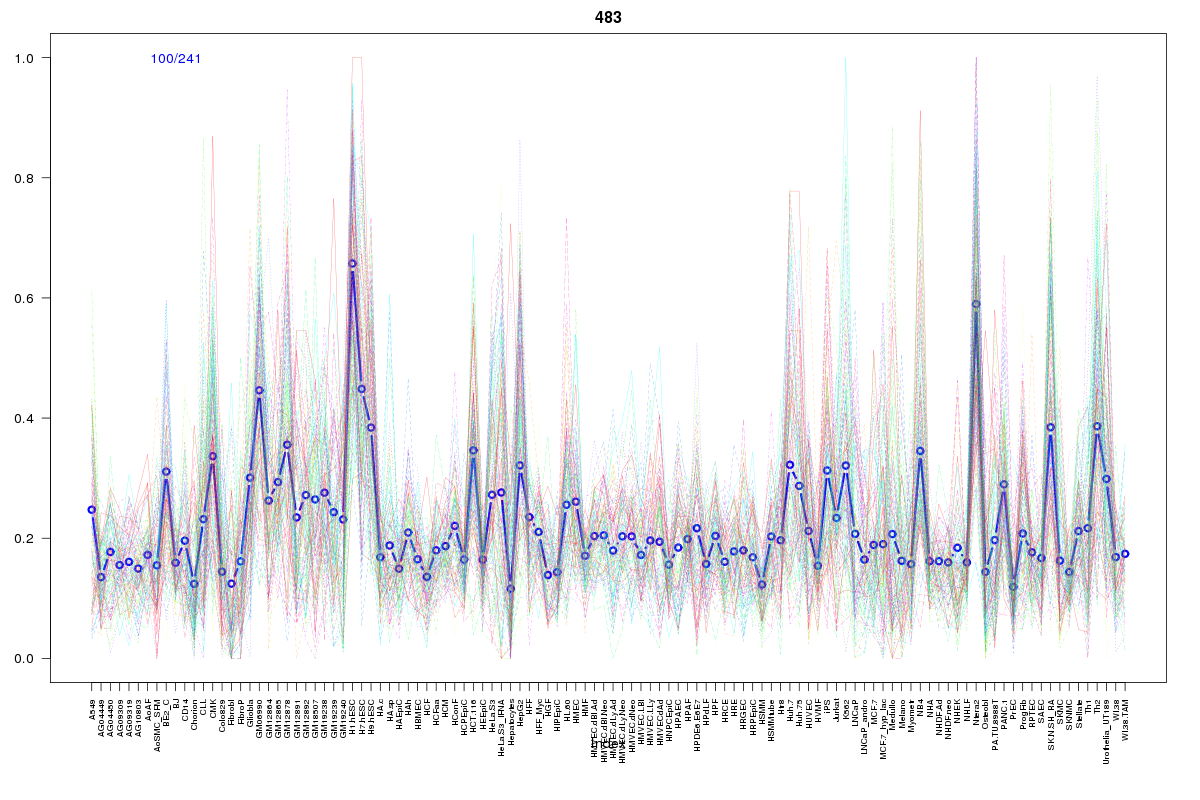 | 483 | 1 |
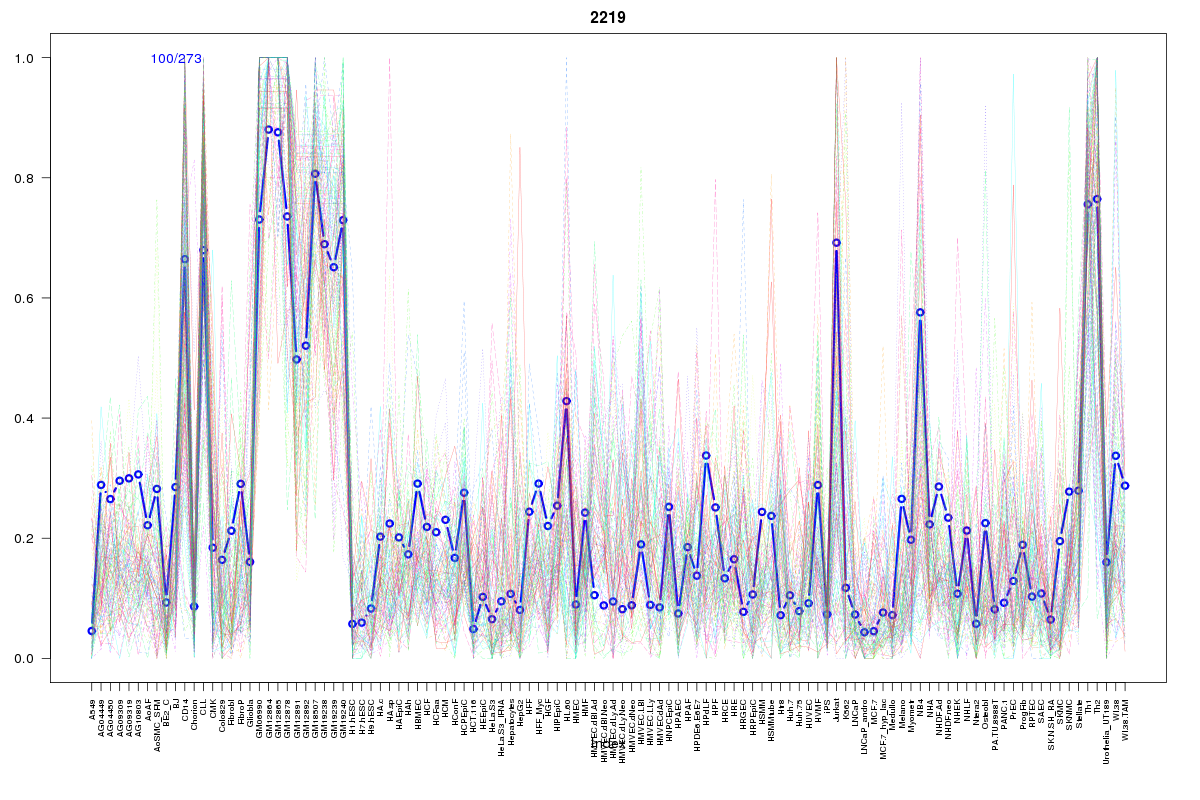 | 2219 | 1 |
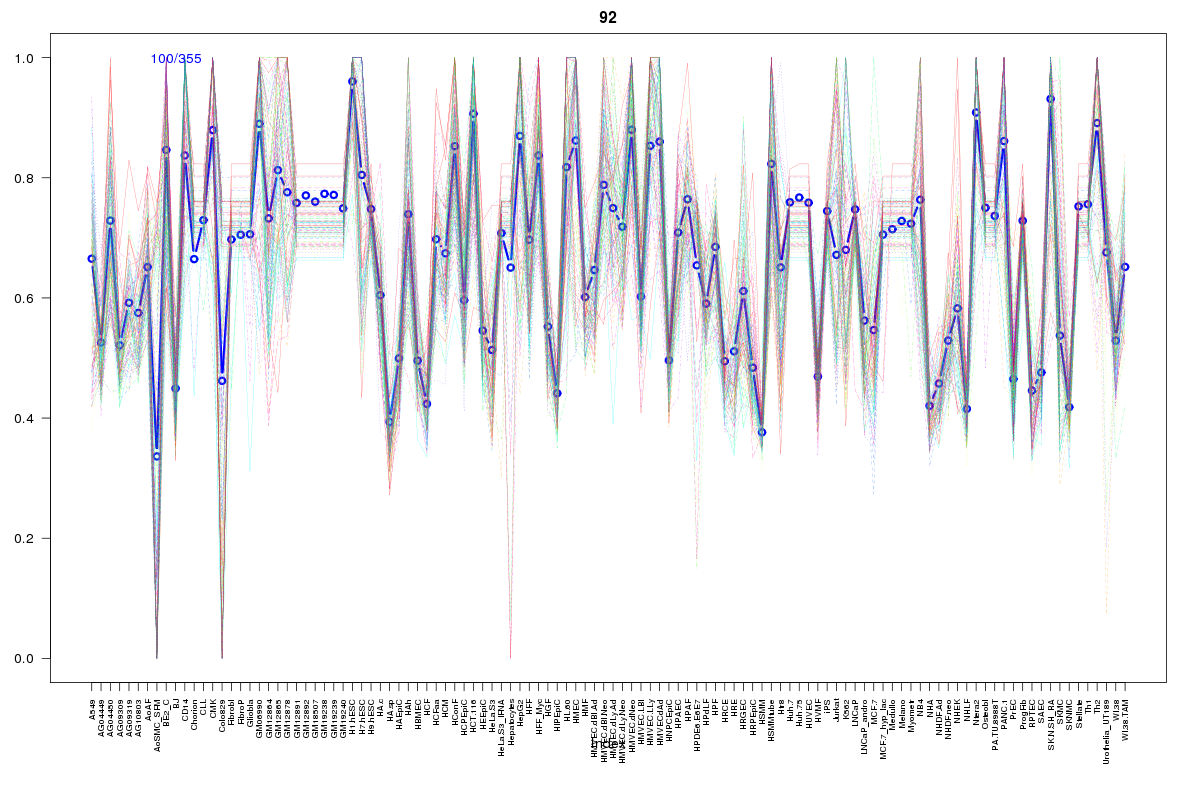 | 92 | 1 |
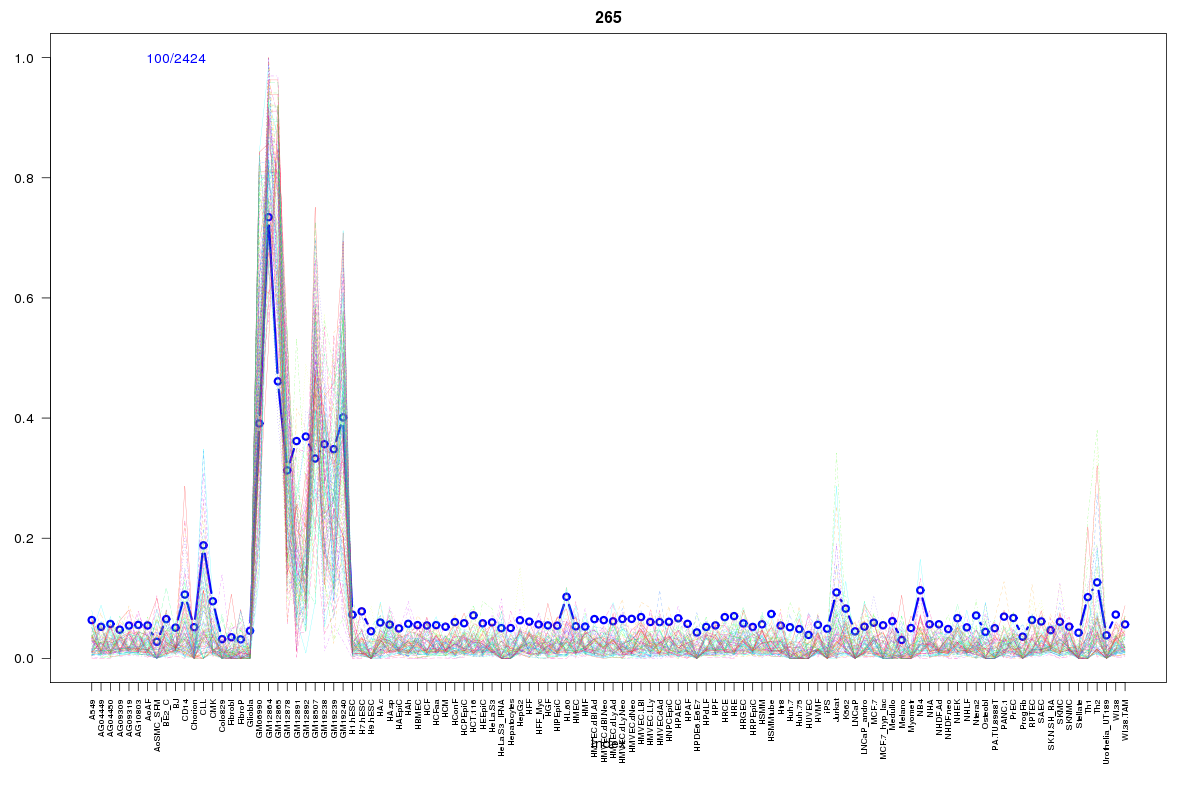 | 265 | 1 |
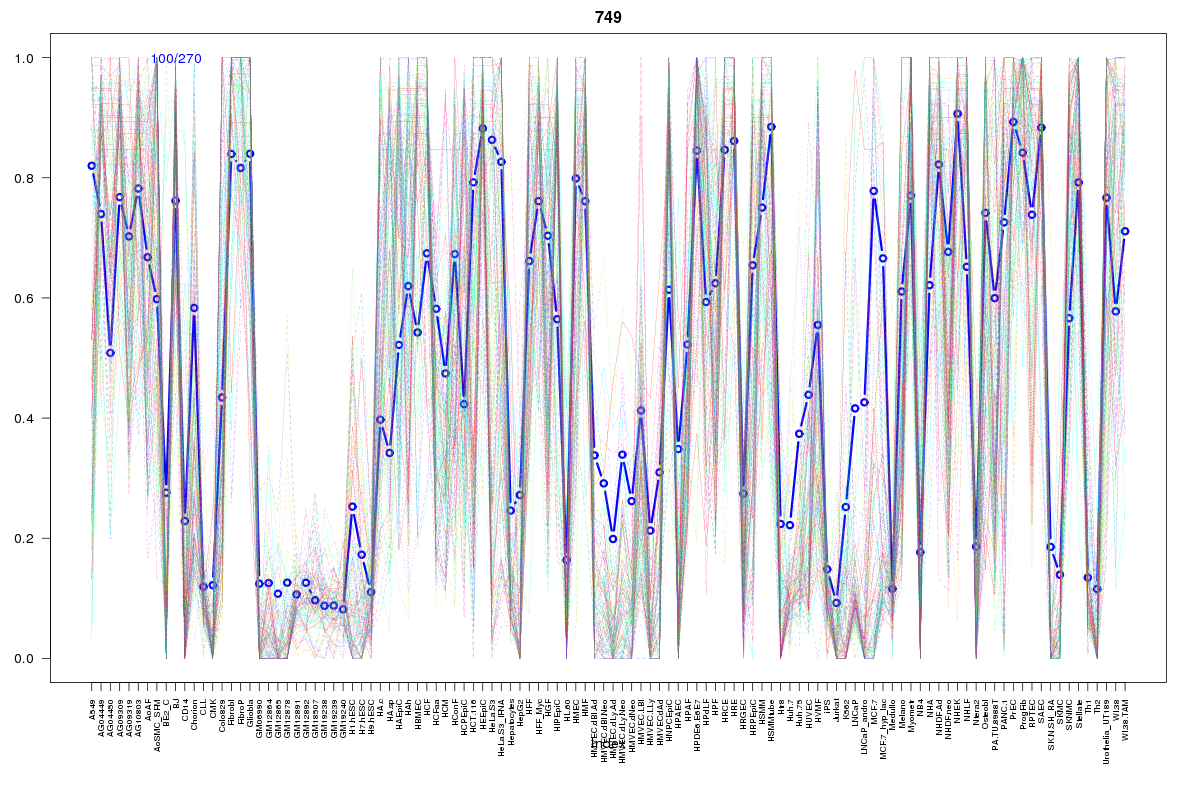 | 749 | 1 |
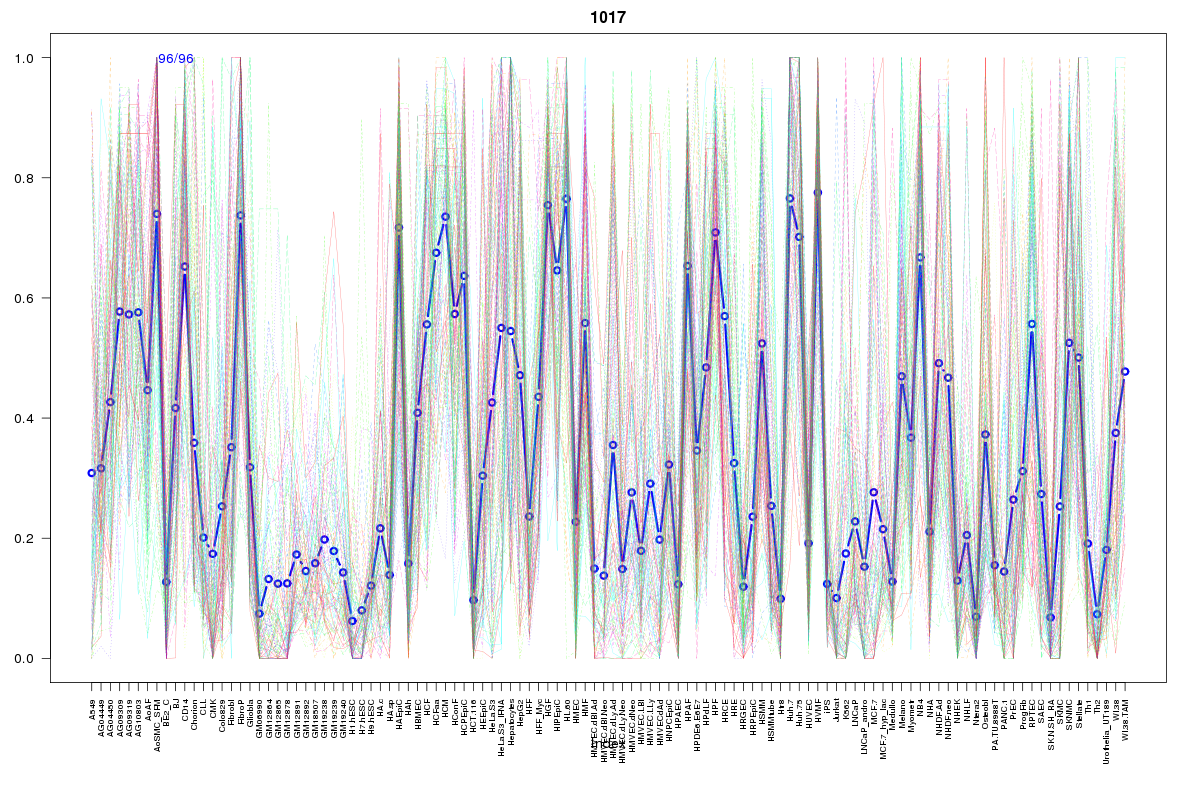 | 1017 | 1 |
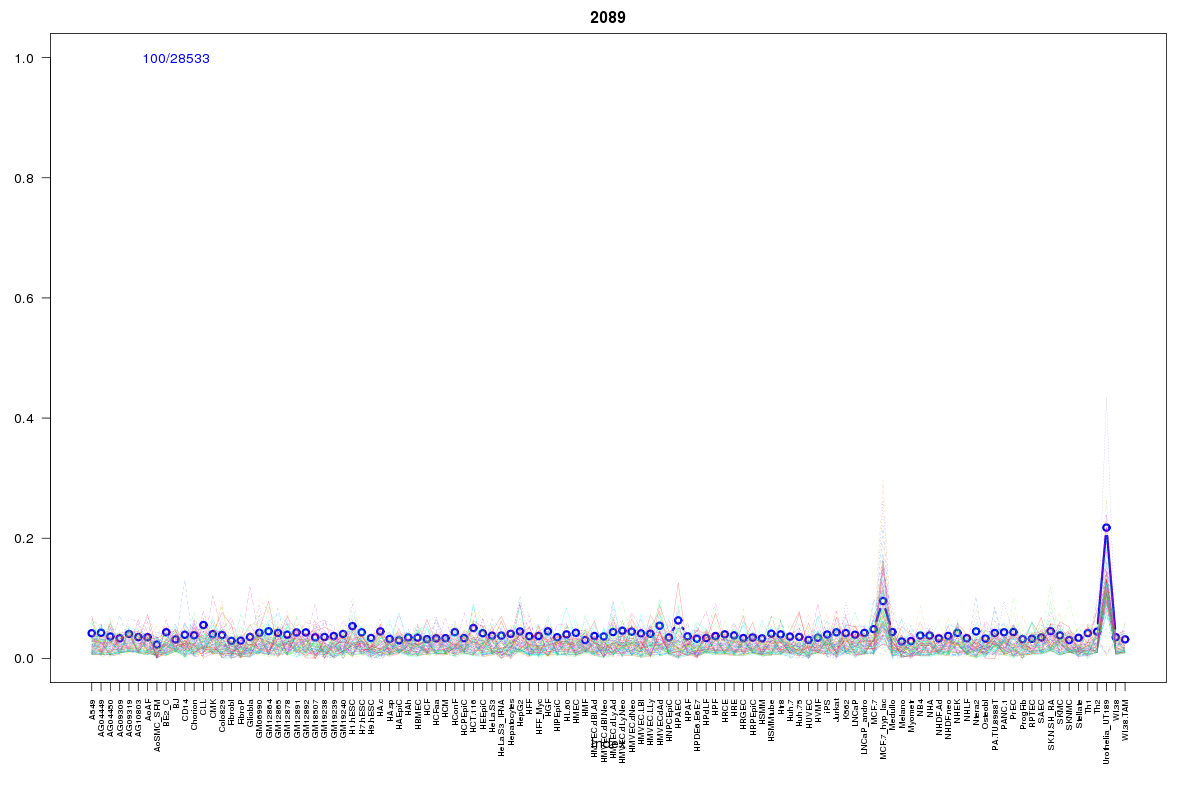 | 2089 | 1 |
 | 66 | 1 |
Resources
BED file downloads
Connects to 22 DHS sitesTop 10 Correlated DHS Sites
p-values indiciate significant higher or lower correlation| Location | Cluster | P-value |
|---|---|---|
| chr1:160097700-160097850 | 15 | 0.002 |
| chr1:160215945-160216095 | 1605 | 0.002 |
| chr1:160196580-160196730 | 15 | 0.003 |
| chr1:160206720-160206870 | 15 | 0.004 |
| chr1:160164945-160165095 | 509 | 0.004 |
| chr1:160147080-160147230 | 2211 | 0.004 |
| chr1:160142120-160142270 | 10 | 0.004 |
| chr1:160232980-160233130 | 265 | 0.011 |
| chr1:160139560-160139710 | 103 | 0.014 |
| chr1:160139400-160139550 | 352 | 0.015 |
| chr1:160131820-160131970 | 66 | 0.016 |
External Databases
UCSCEnsembl (ENSG00000143318)