Gene: EPOR
chr19: 11488235-11494988Expression Profile
(log scale)
Graphical Connections
Distribution of linked clusters:
You may find it interesting if many of the connected DHS sites belong to the same cluster.| Cluster Profile | Cluster ID | Number of DHS sites in this cluster |
|---|---|---|
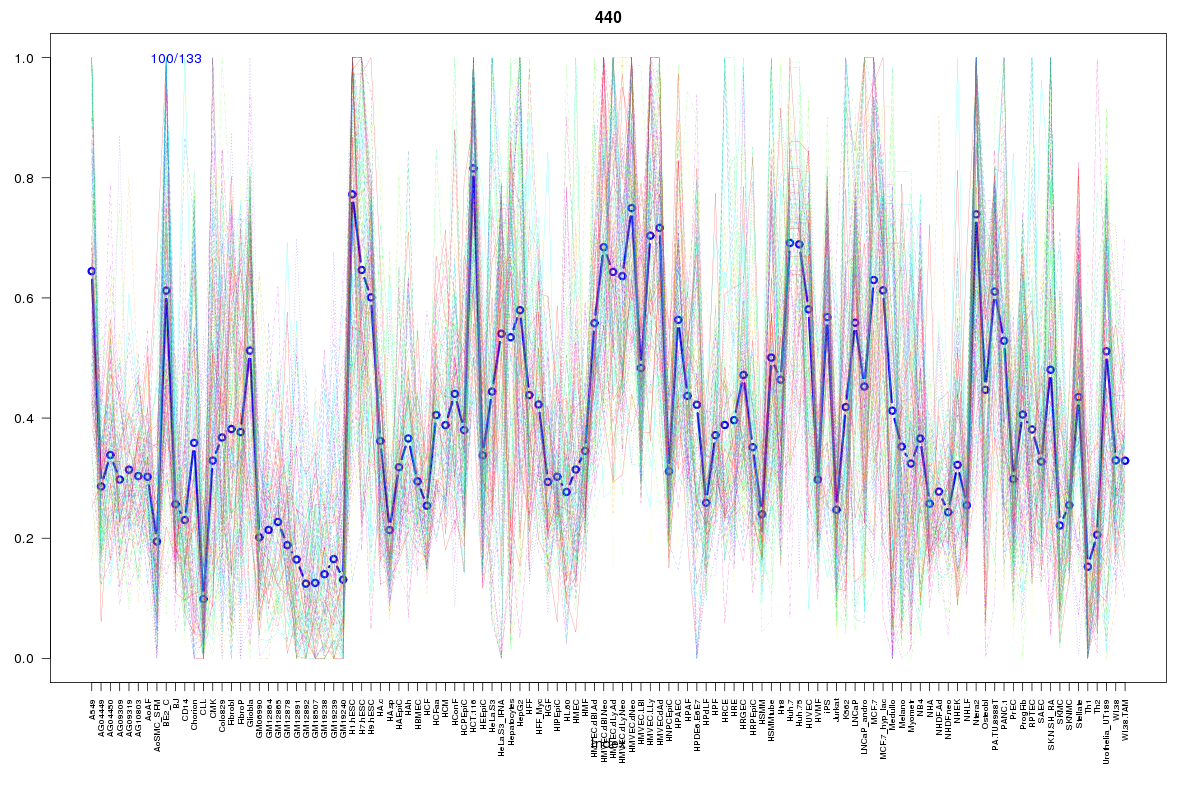 | 440 | 1 |
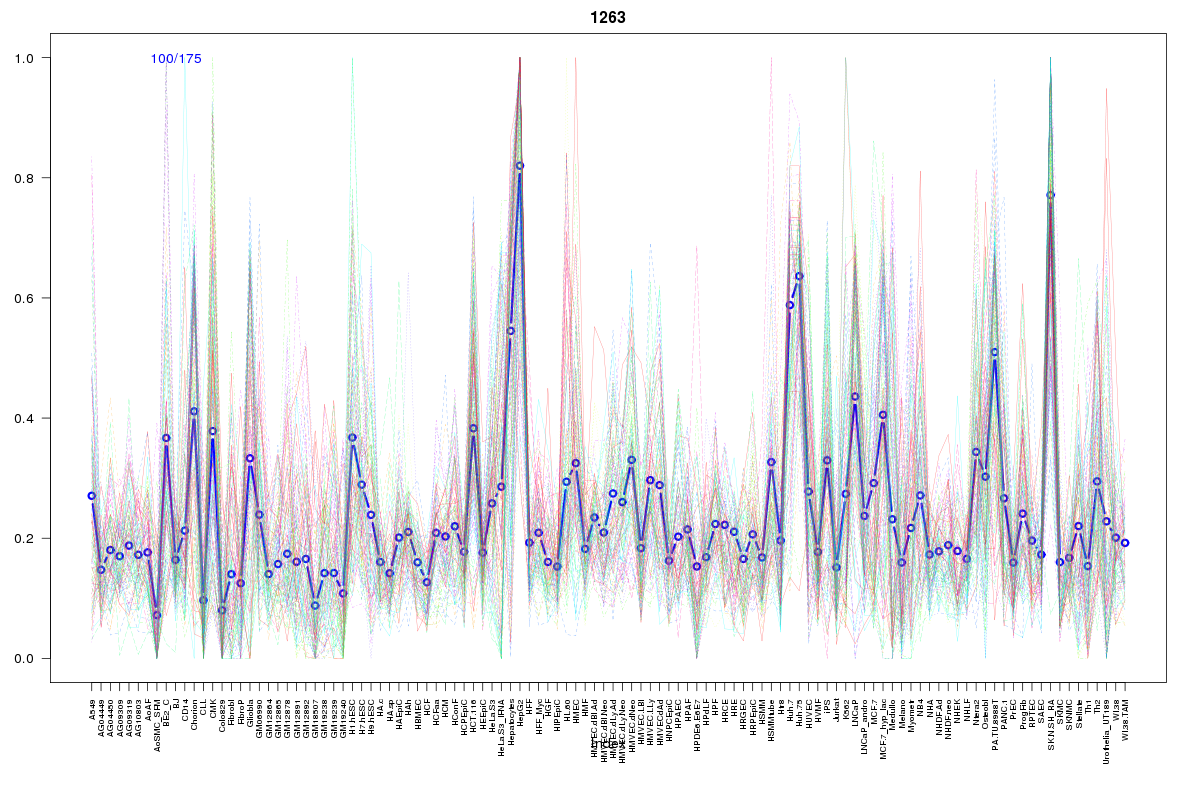 | 1263 | 1 |
 | 130 | 1 |
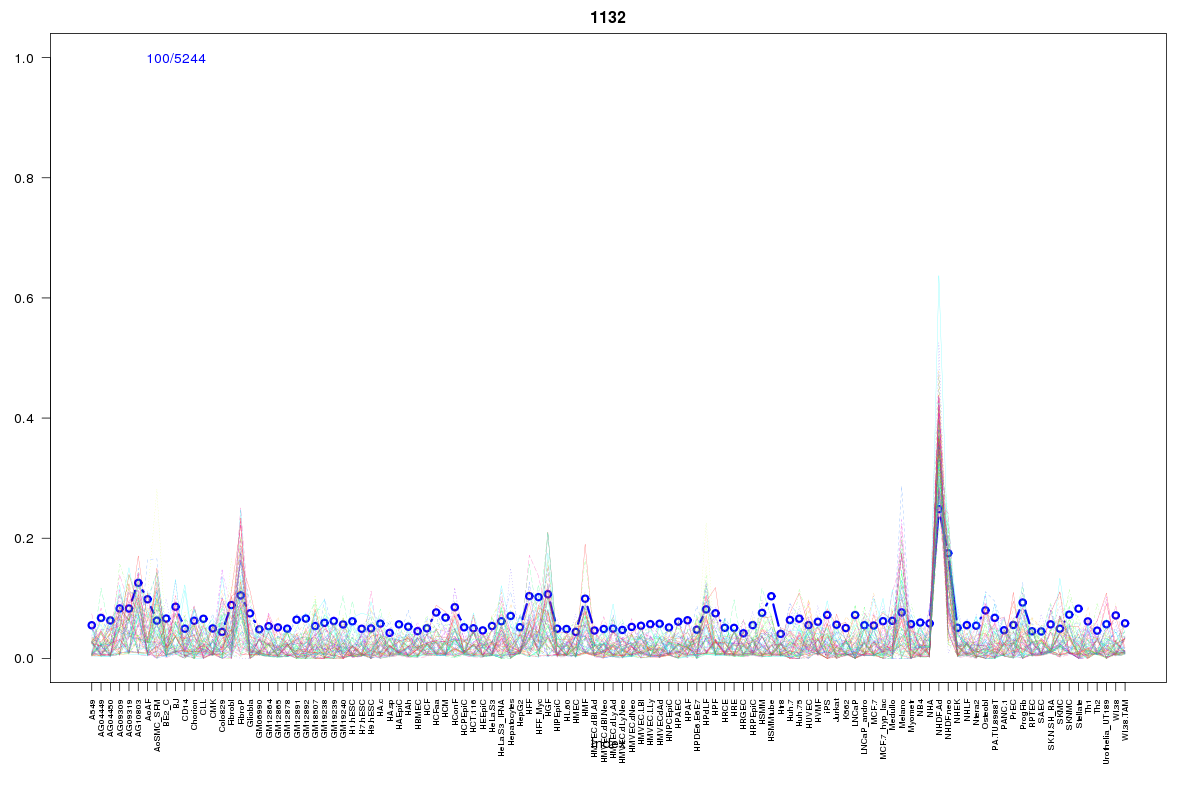 | 1132 | 1 |
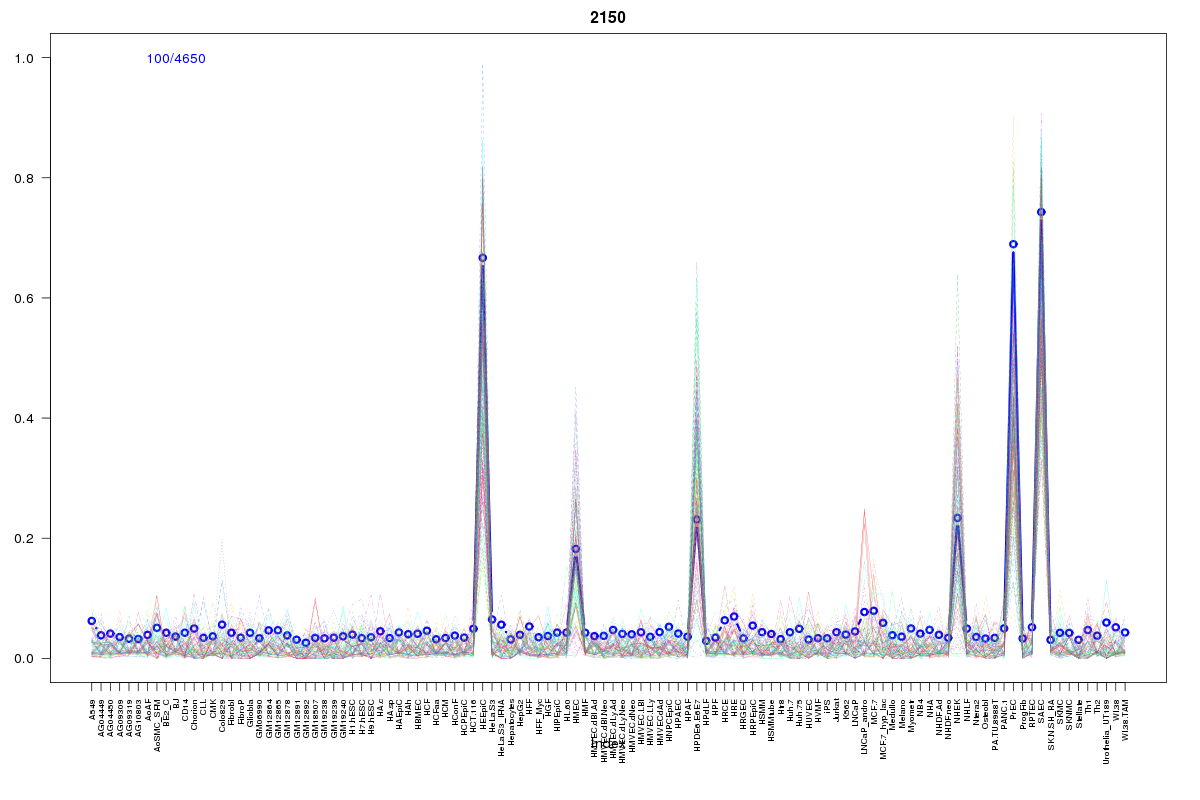 | 2150 | 1 |
 | 1008 | 1 |
 | 2017 | 1 |
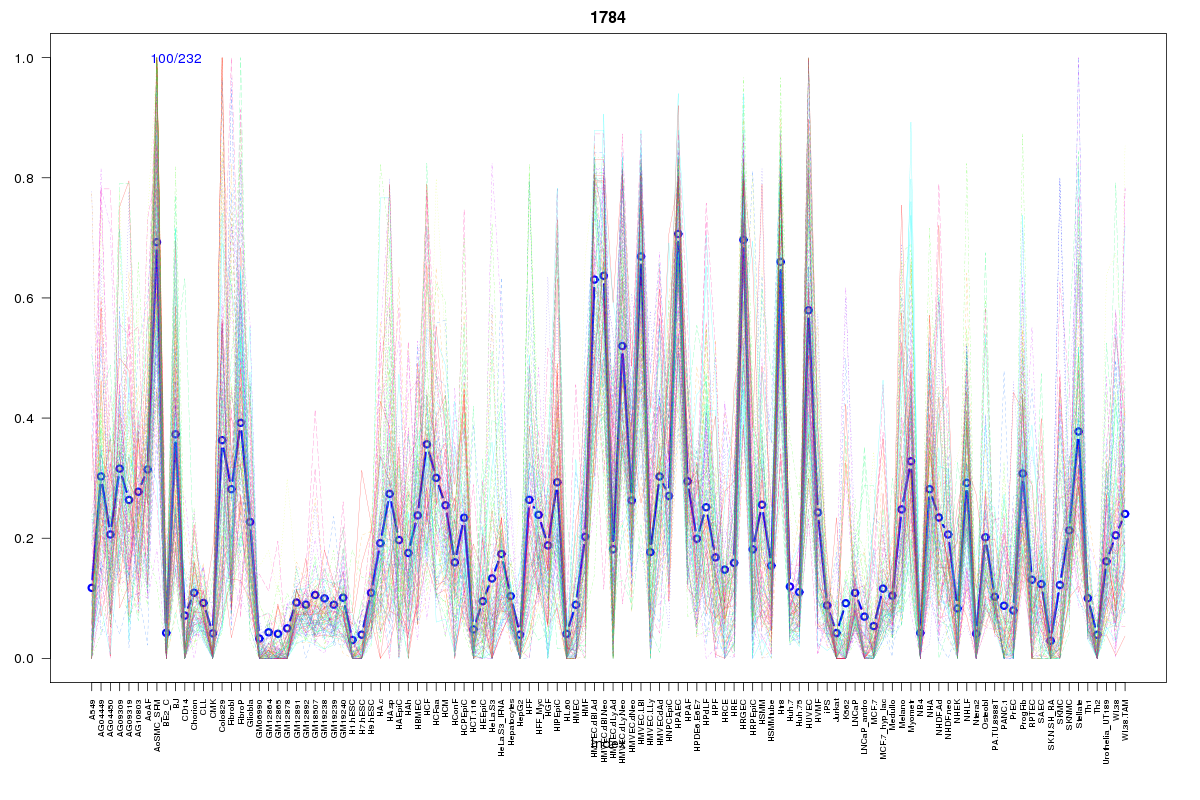 | 1784 | 1 |
 | 510 | 1 |
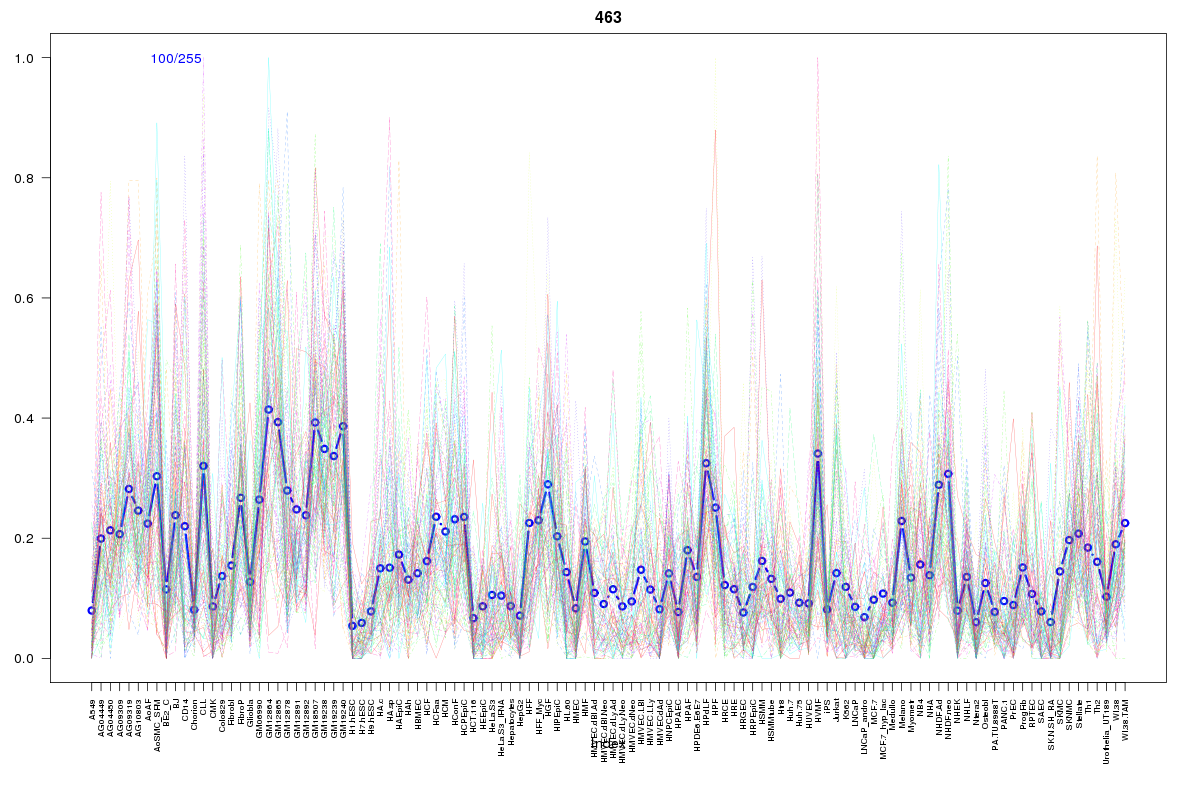 | 463 | 1 |
 | 312 | 1 |
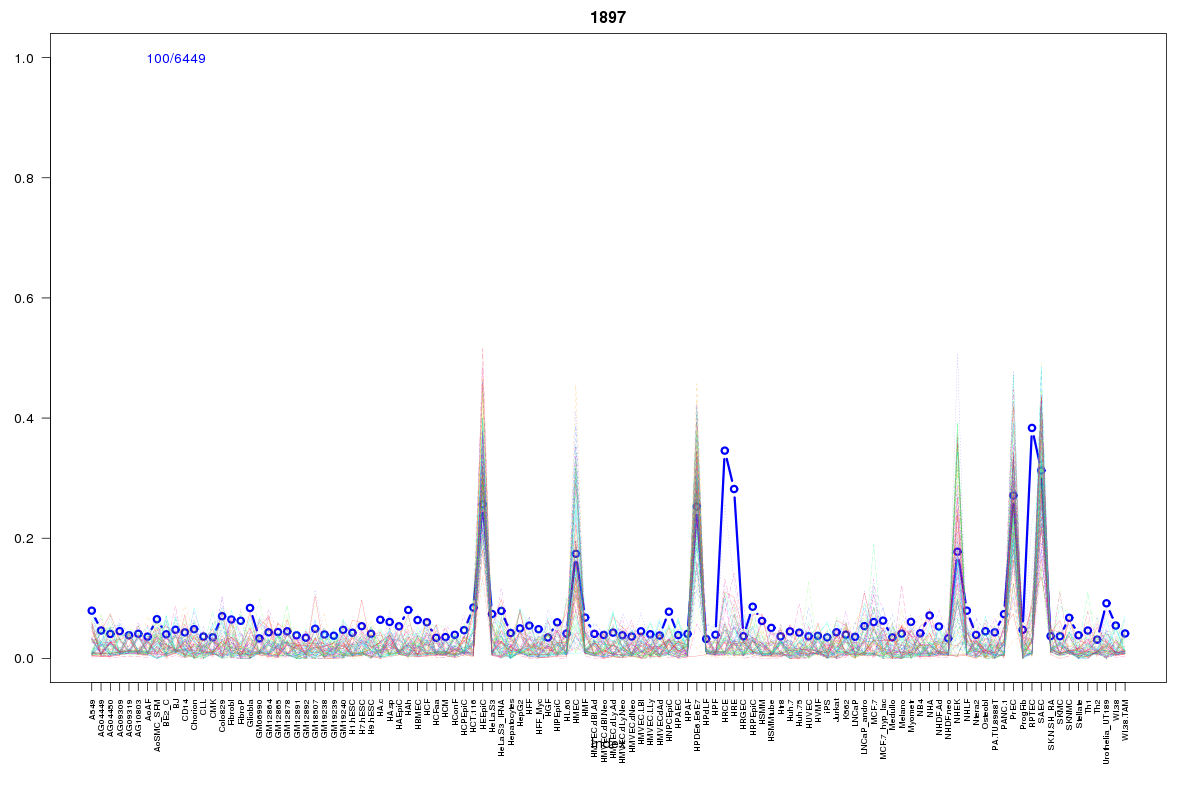 | 1897 | 1 |
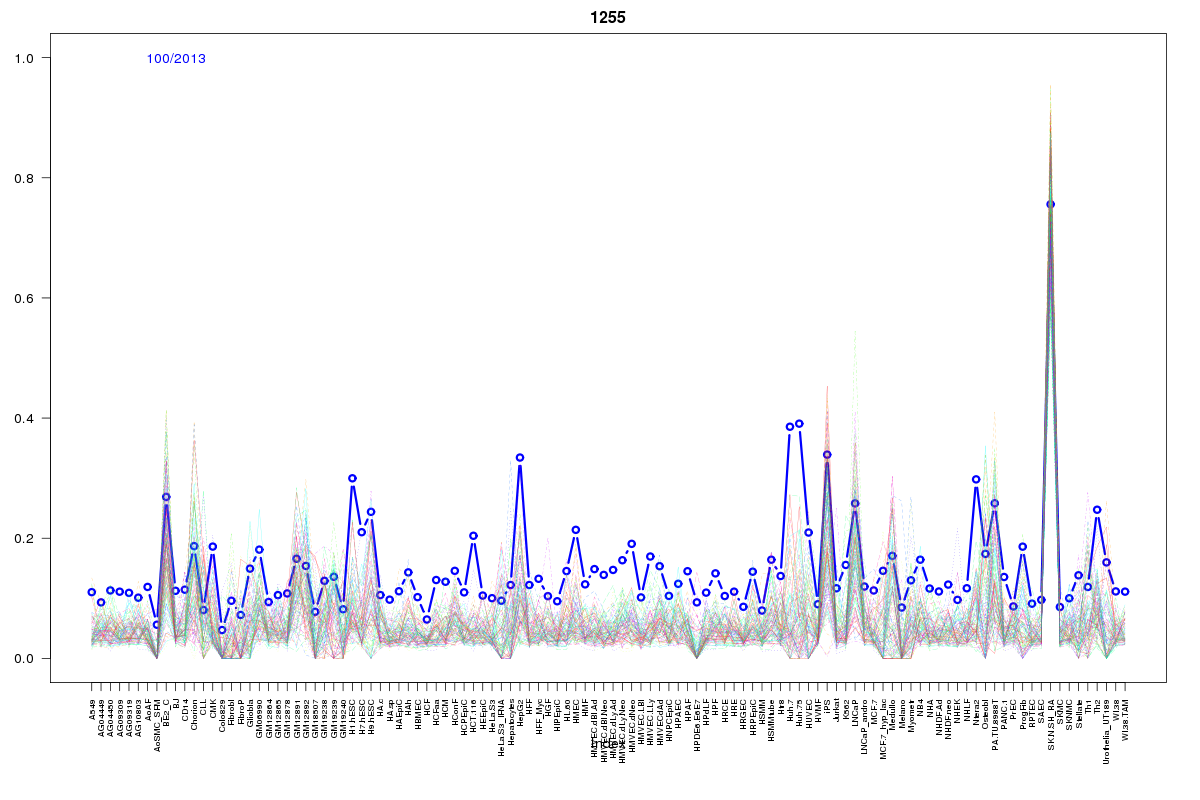 | 1255 | 1 |
Resources
BED file downloads
Connects to 13 DHS sitesTop 10 Correlated DHS Sites
p-values indiciate significant higher or lower correlation| Location | Cluster | P-value |
|---|---|---|
| chr19:11494980-11495130 | 440 | 0 |
| chr19:11529980-11530130 | 1263 | 0.013 |
| chr19:11569640-11569790 | 2017 | 0.013 |
| chr19:11494805-11494955 | 1255 | 0.014 |
| chr19:11472220-11472370 | 312 | 0.015 |
| chr19:11569065-11569215 | 1008 | 0.015 |
| chr19:11397360-11397510 | 1784 | 0.015 |
| chr19:11554980-11555130 | 2150 | 0.023 |
| chr19:11483920-11484070 | 1897 | 0.018 |
| chr19:11410005-11410155 | 510 | 0.012 |
| chr19:11428520-11428670 | 463 | 0.011 |
External Databases
UCSCEnsembl (ENSG00000187266)