Gene: PTPLAD2
chr9: 20995305-21031608Expression Profile
(log scale)
Graphical Connections
Distribution of linked clusters:
You may find it interesting if many of the connected DHS sites belong to the same cluster.| Cluster Profile | Cluster ID | Number of DHS sites in this cluster |
|---|---|---|
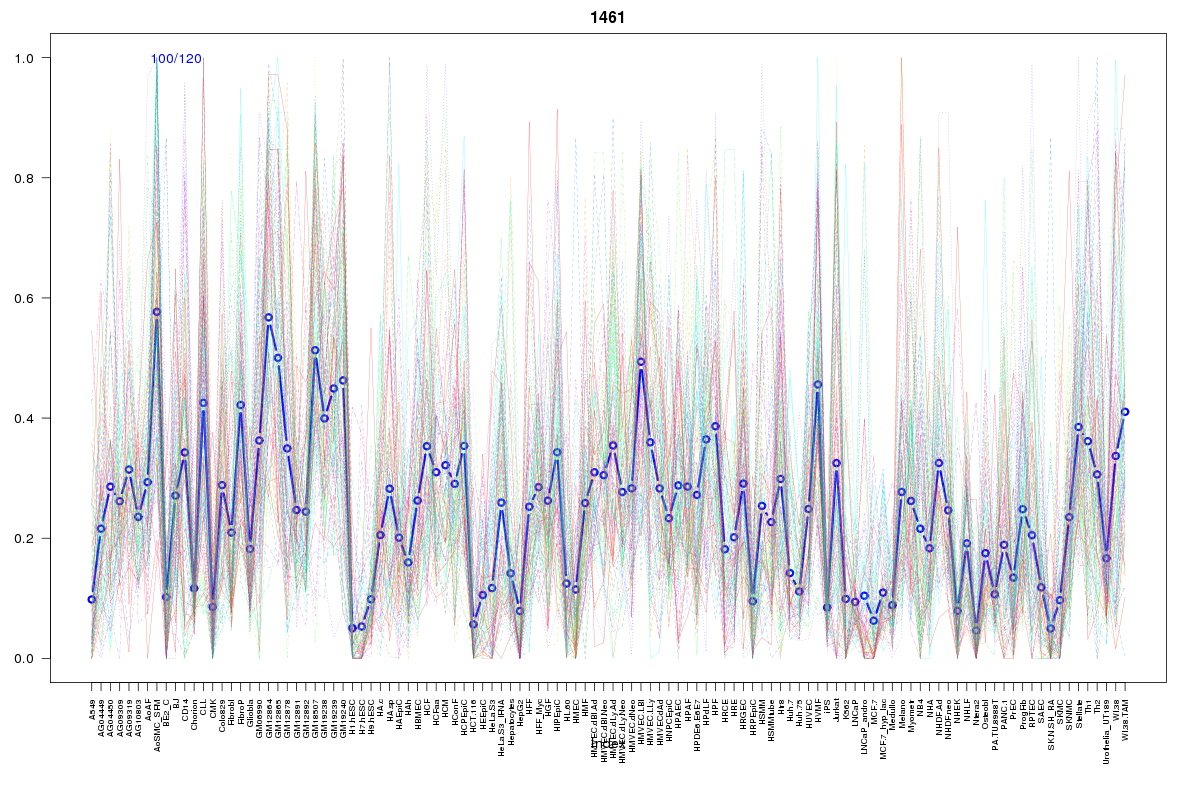 | 1461 | 2 |
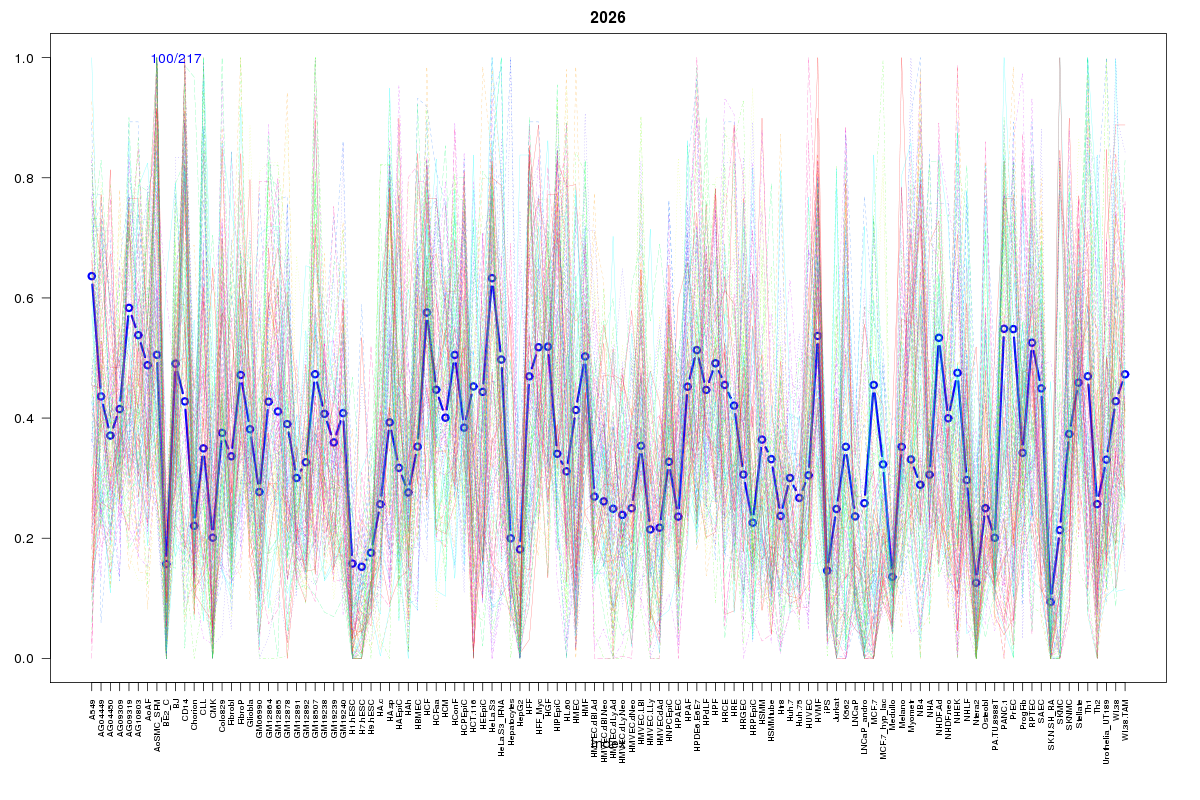 | 2026 | 1 |
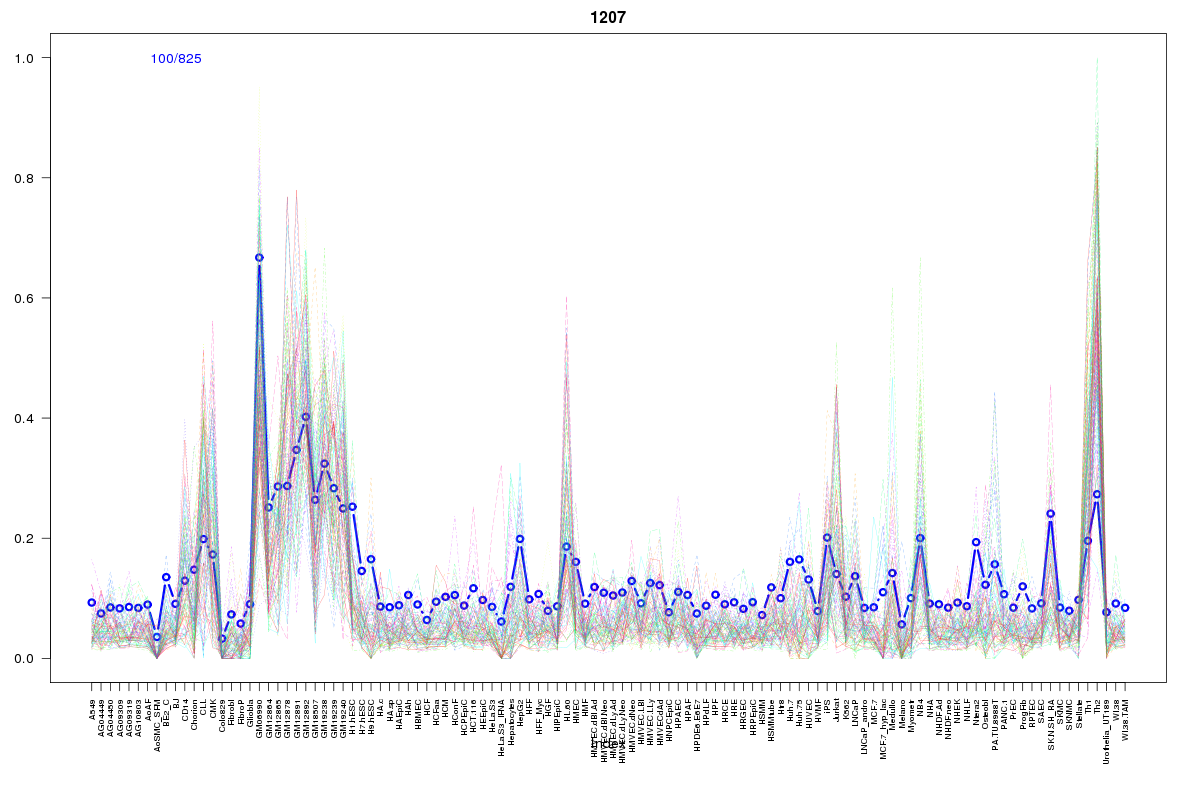 | 1207 | 1 |
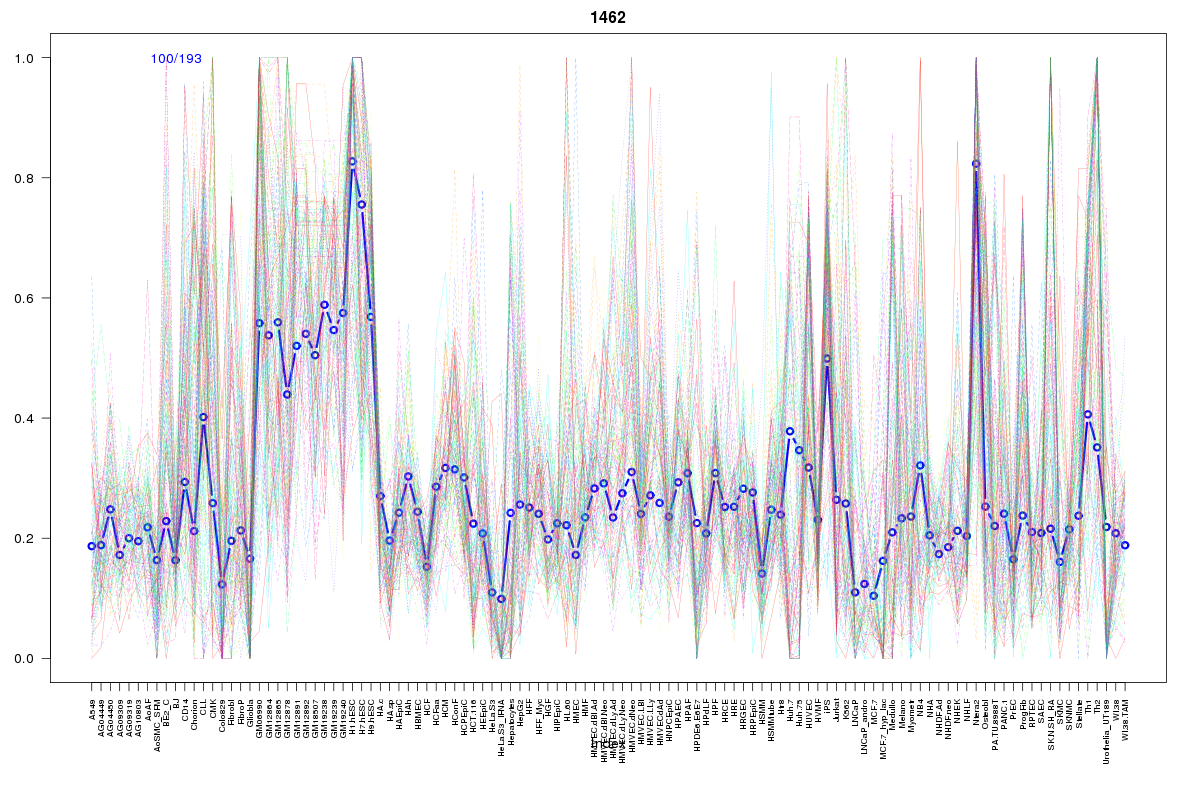 | 1462 | 1 |
 | 860 | 1 |
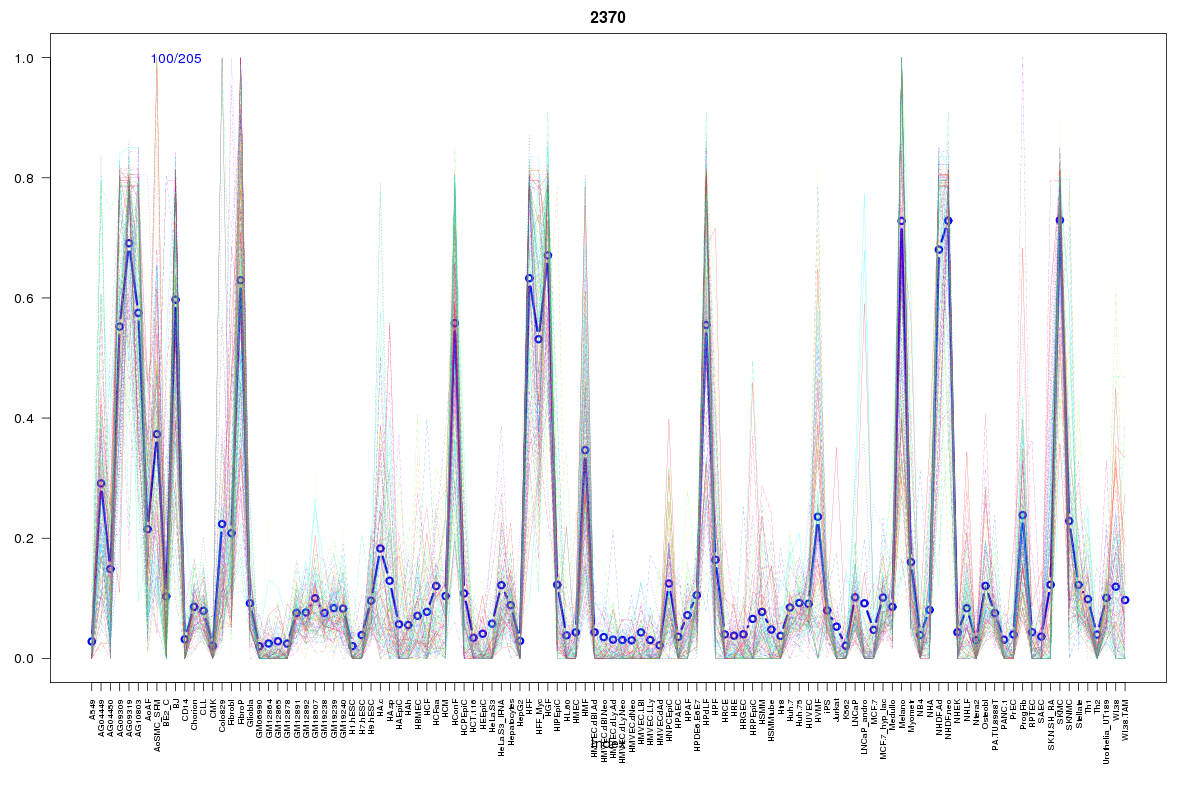 | 2370 | 1 |
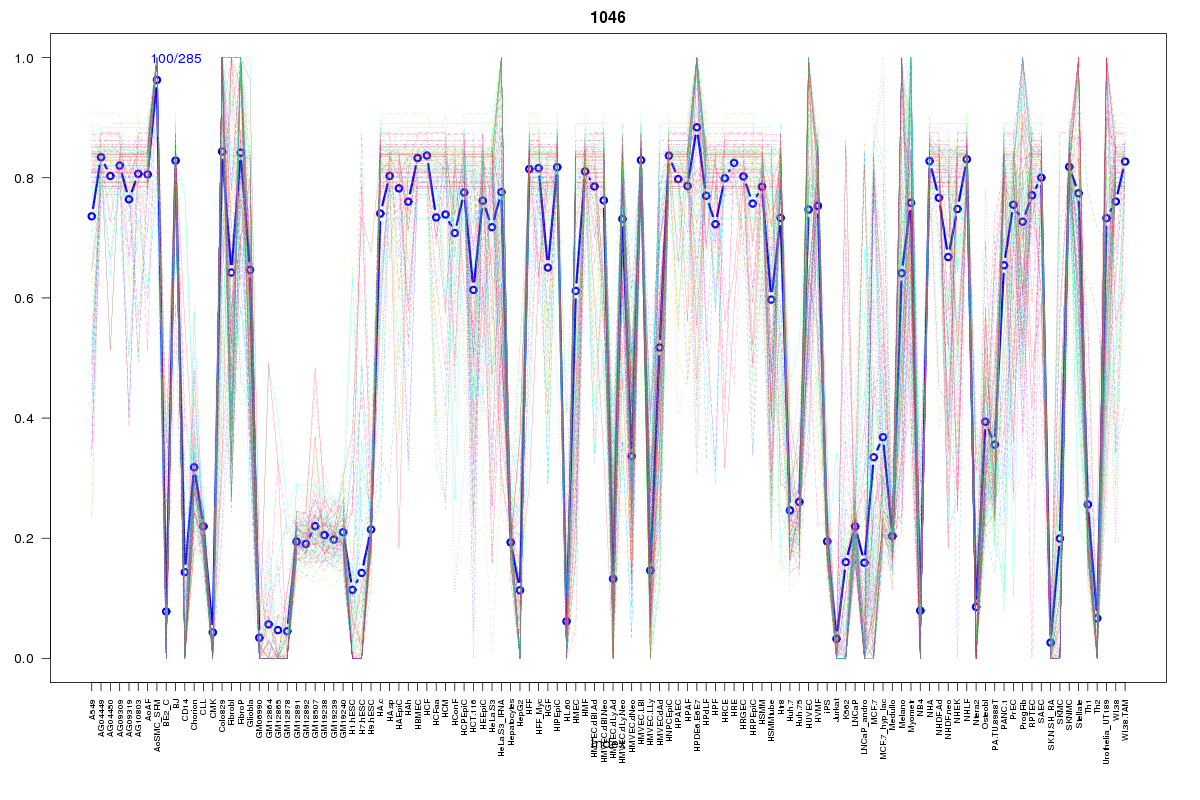 | 1046 | 1 |
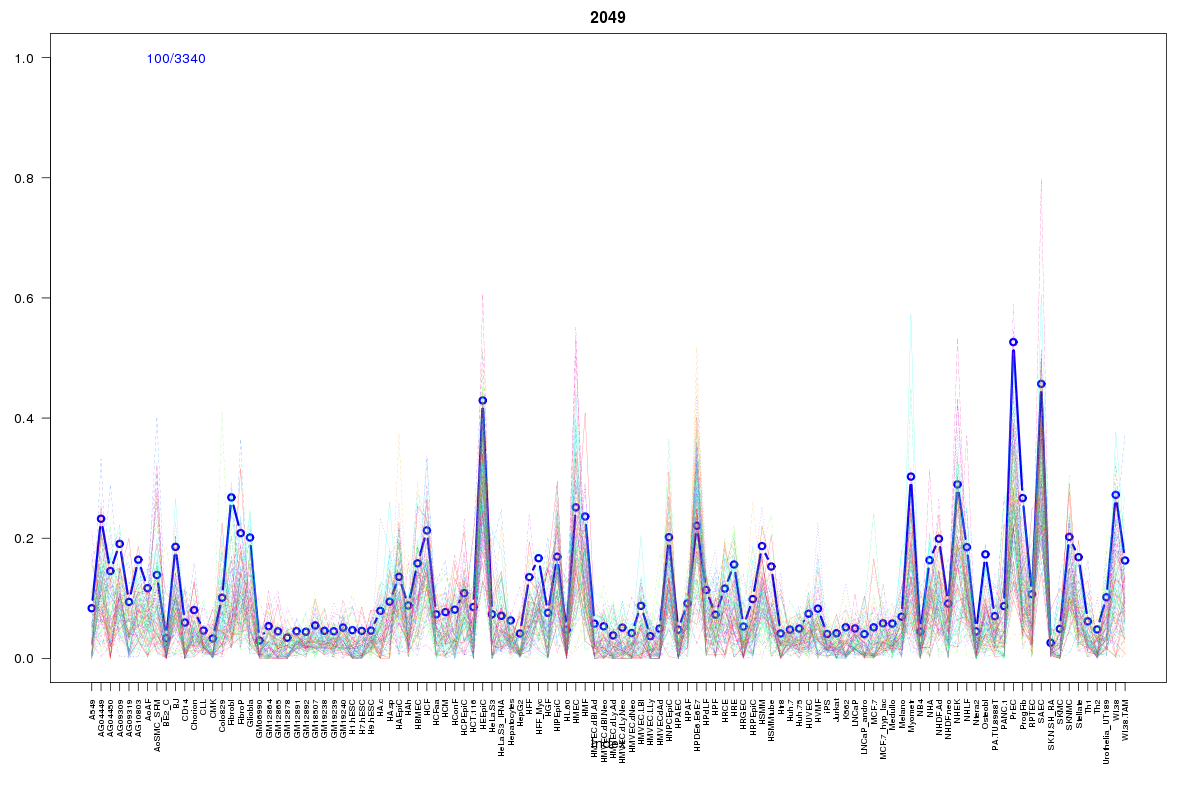 | 2049 | 1 |
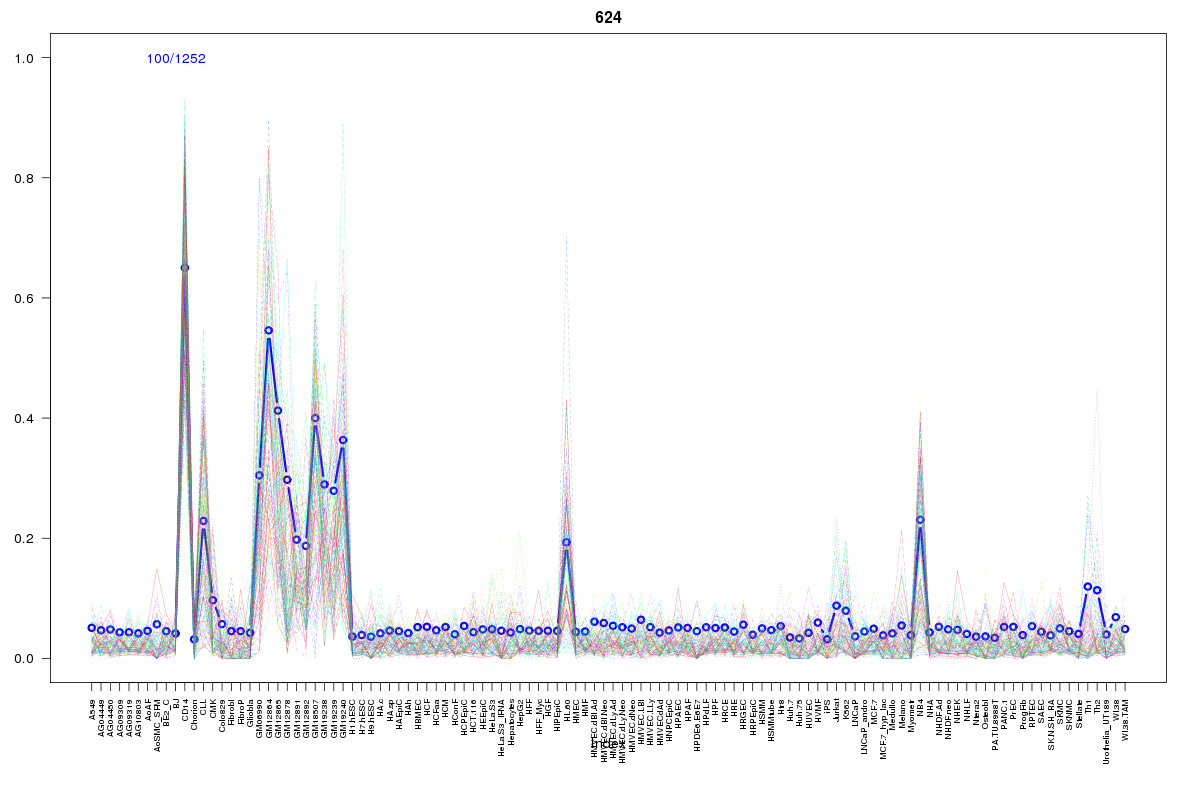 | 624 | 1 |
 | 15 | 1 |
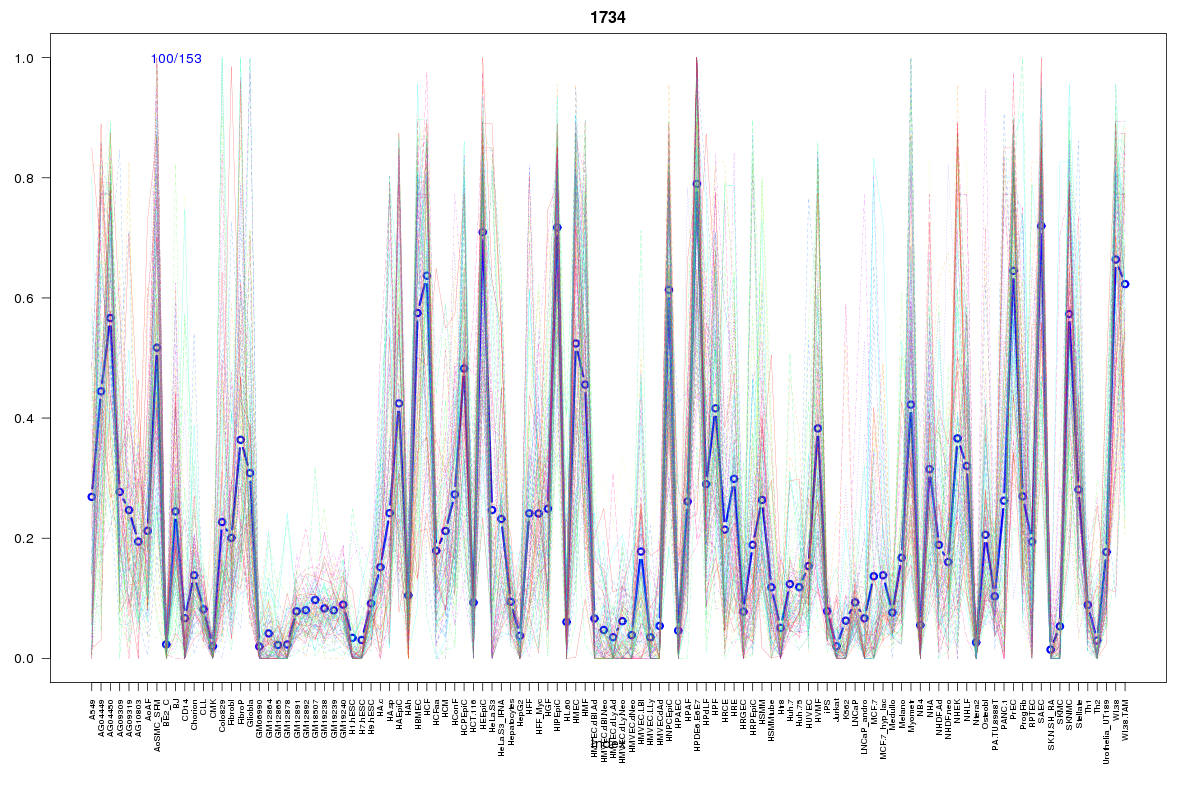 | 1734 | 1 |
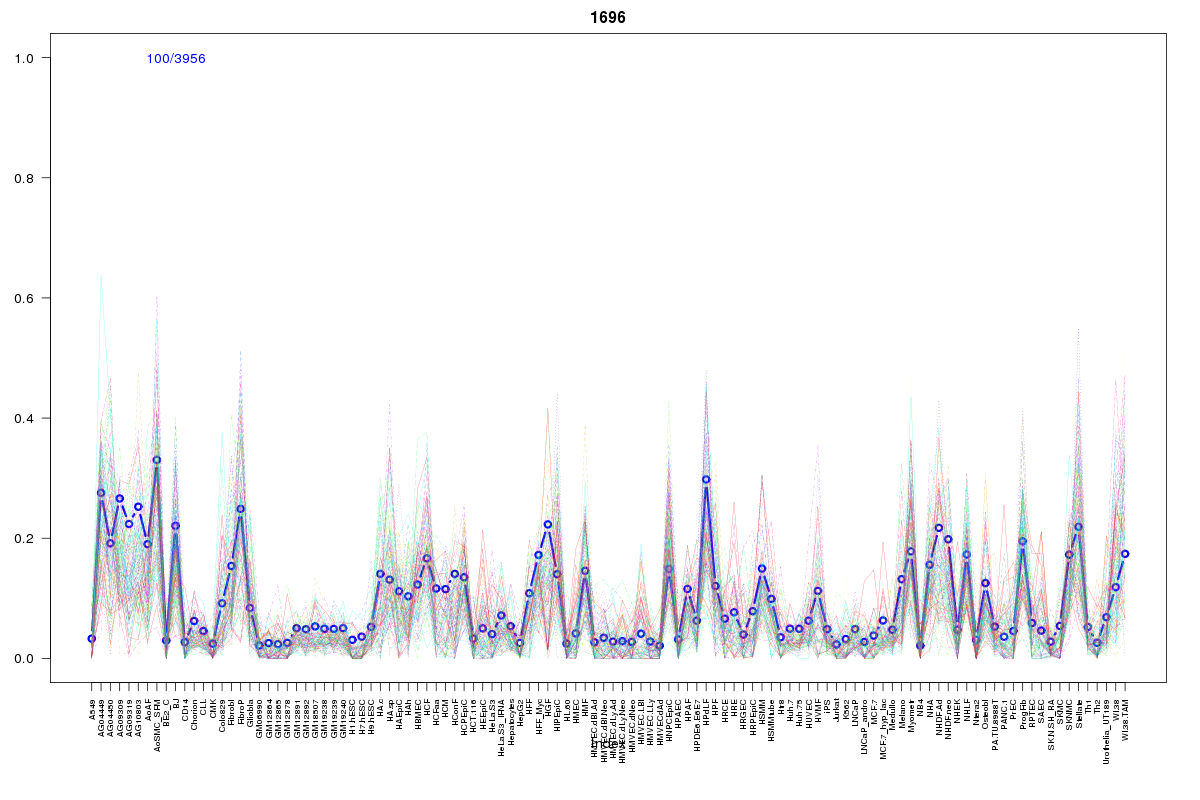 | 1696 | 1 |
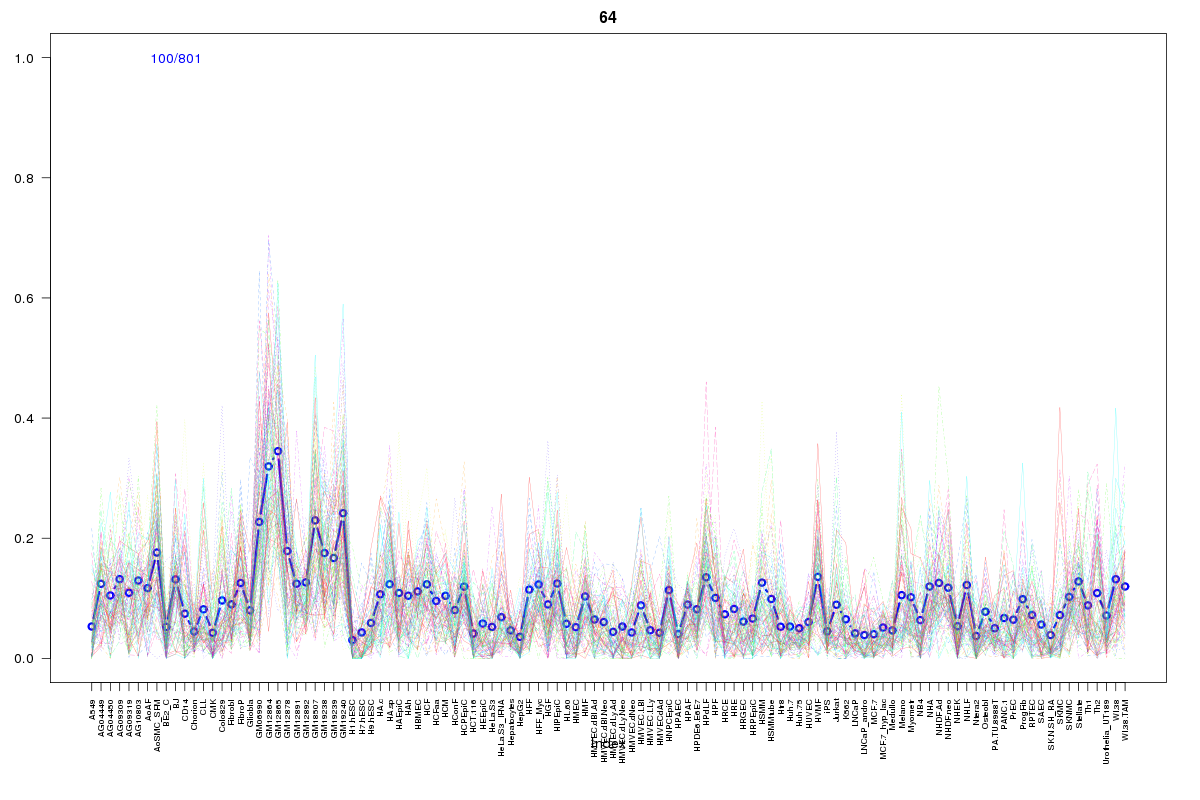 | 64 | 1 |
Resources
BED file downloads
Connects to 14 DHS sitesTop 10 Correlated DHS Sites
p-values indiciate significant higher or lower correlation| Location | Cluster | P-value |
|---|---|---|
| chr9:21031580-21031730 | 1462 | 0.001 |
| chr9:21096480-21096630 | 1461 | 0.001 |
| chr9:21096300-21096450 | 1461 | 0.001 |
| chr9:21027480-21027630 | 1696 | 0.001 |
| chr9:21030740-21030890 | 2026 | 0.001 |
| chr9:21031220-21031370 | 1207 | 0.001 |
| chr9:21061300-21061450 | 2370 | 0.001 |
| chr9:21030540-21030690 | 64 | 0.003 |
| chr9:21034705-21034855 | 860 | 0.007 |
| chr9:21096760-21096910 | 2049 | 0.008 |
| chr9:21017200-21017350 | 1734 | 0.014 |
External Databases
UCSCEnsembl (ENSG00000188921)