Gene: NACAP1
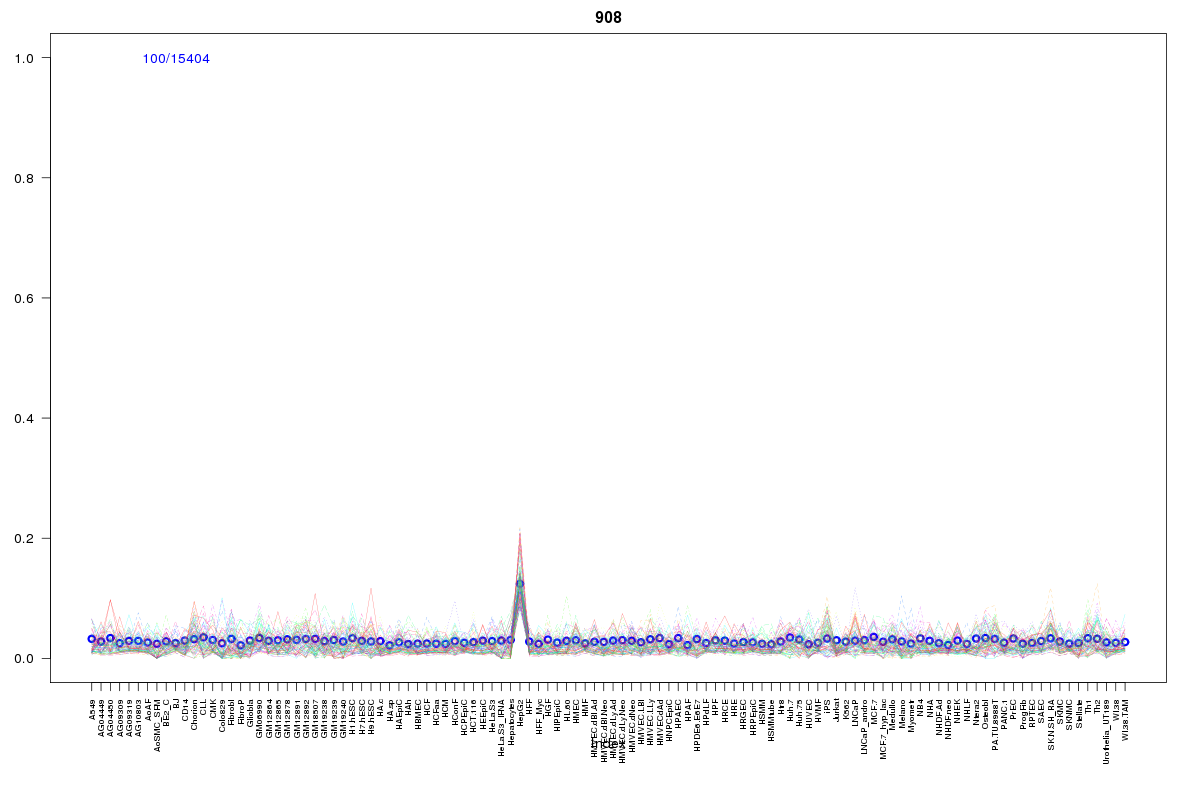
chr8: 102374021-102384935Expression Profile
(log scale)
Graphical Connections
Distribution of linked clusters:
You may find it interesting if many of the connected DHS sites belong to the same cluster.| Cluster Profile | Cluster ID | Number of DHS sites in this cluster |
|---|---|---|
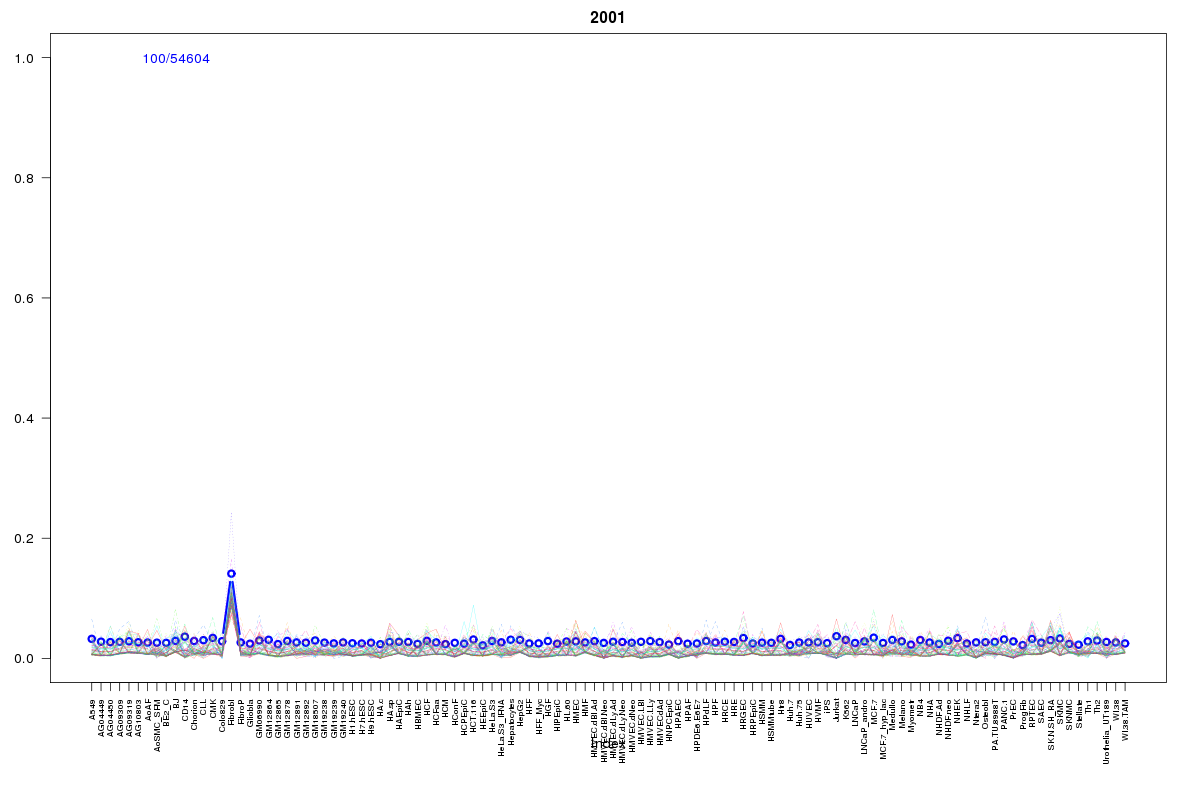 | 2001 | 2 |
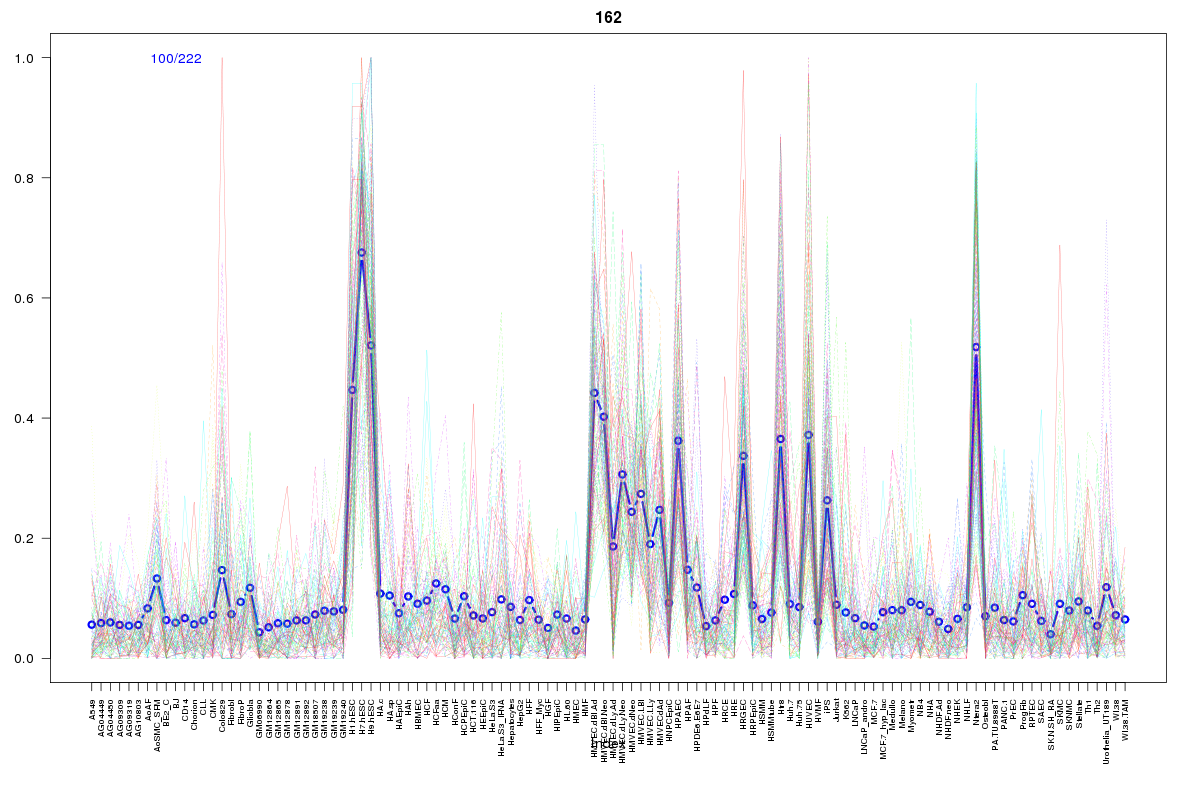 | 162 | 1 |
 | 934 | 1 |
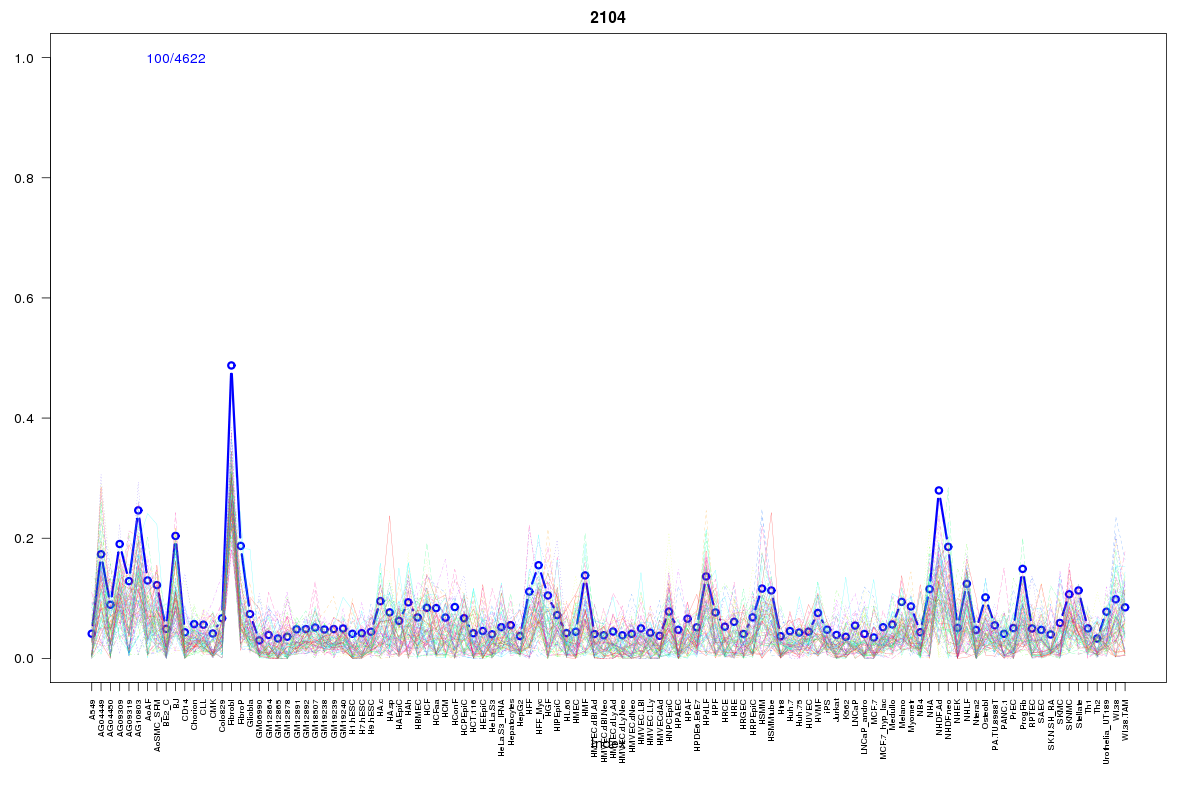 | 2104 | 1 |
 | 66 | 1 |
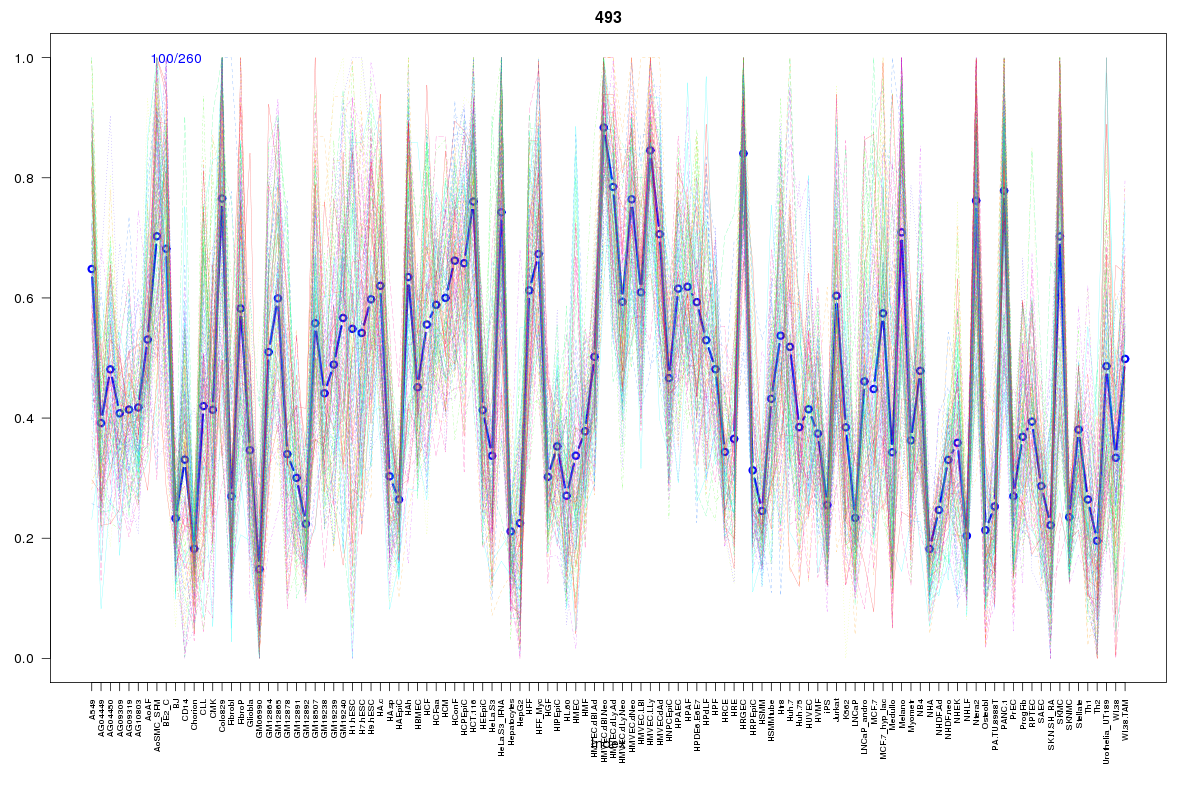 | 493 | 1 |
 | 2055 | 1 |
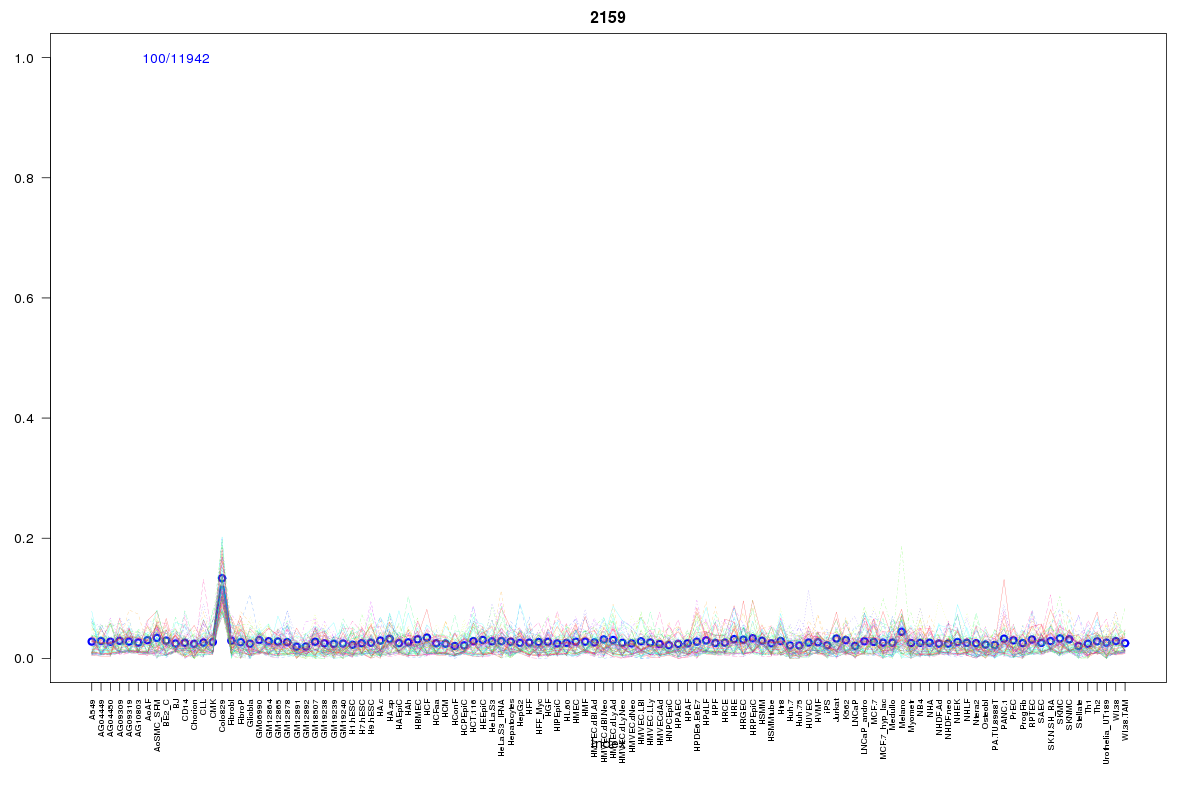 | 2159 | 1 |
 | 687 | 1 |
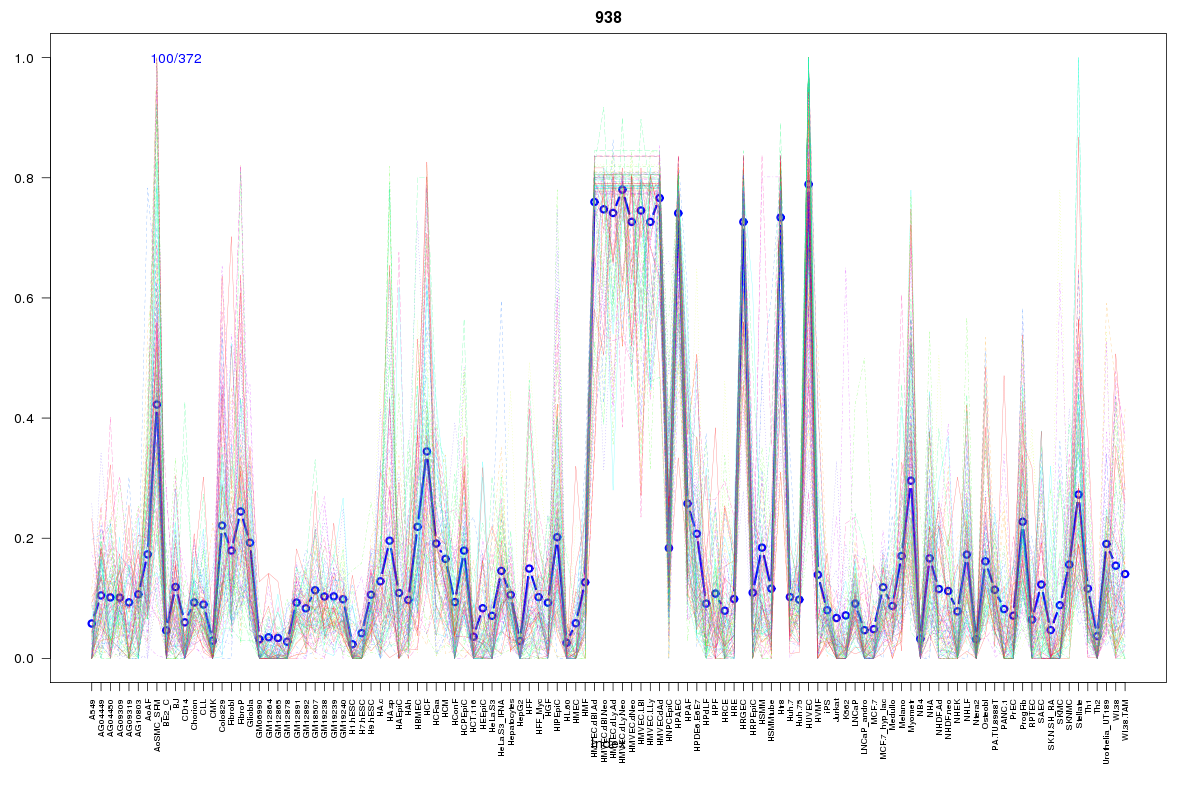 | 938 | 1 |
 | 739 | 1 |
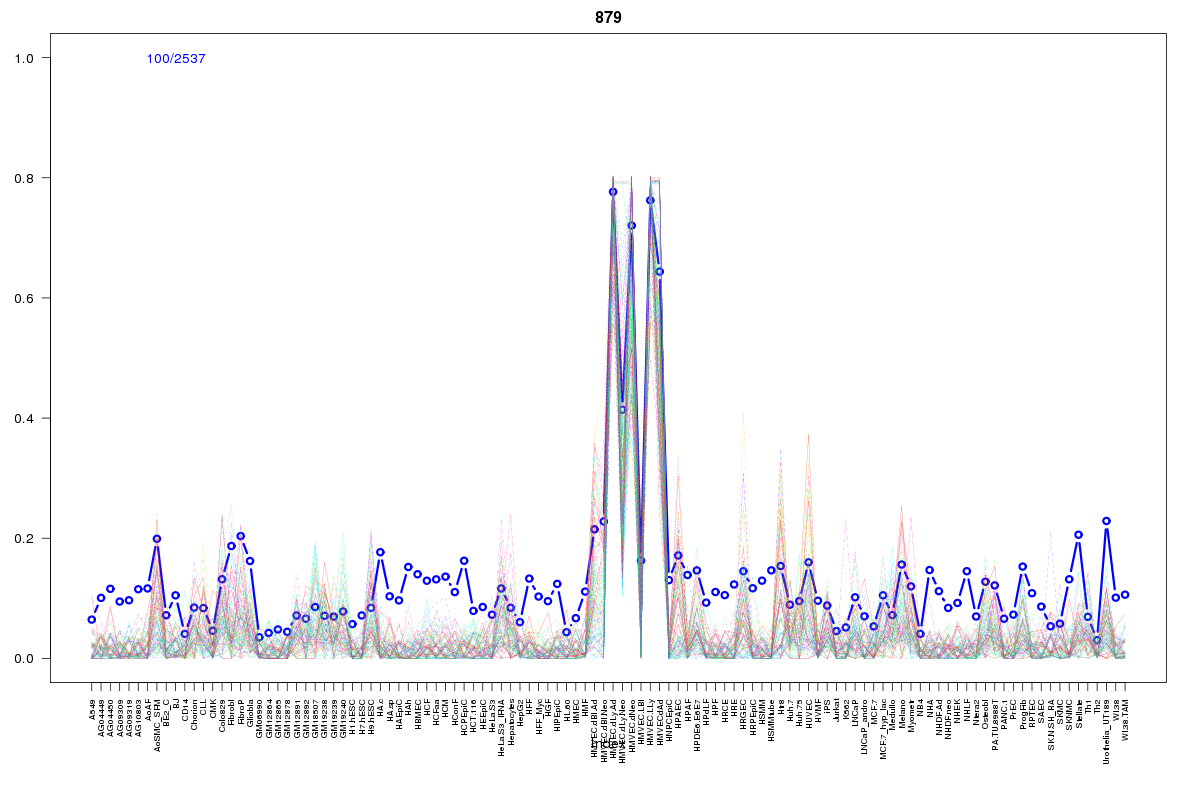 | 879 | 1 |
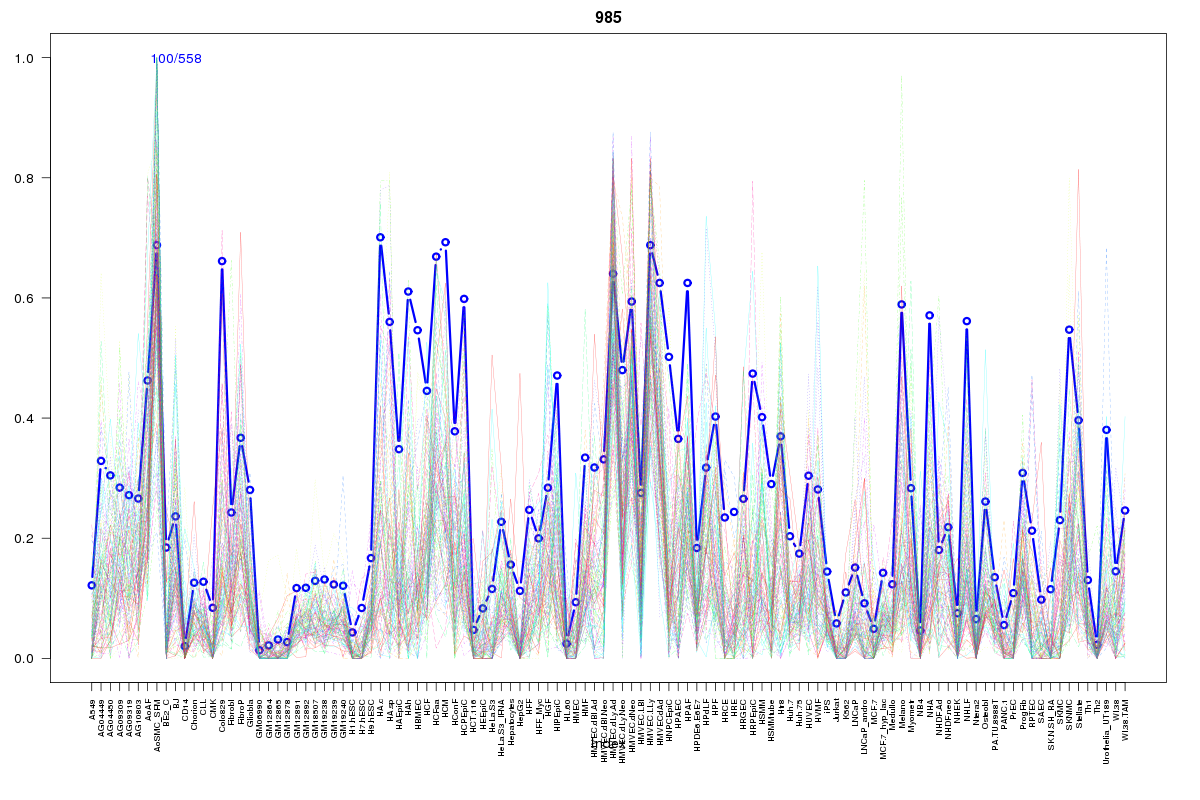 | 985 | 1 |
 | 416 | 1 |
 | 860 | 1 |
 | 908 | 1 |
Resources
BED file downloads
Connects to 17 DHS sitesTop 10 Correlated DHS Sites
p-values indiciate significant higher or lower correlation| Location | Cluster | P-value |
|---|---|---|
| chr8:102331900-102332050 | 2104 | 0.006 |
| chr8:102423980-102424130 | 908 | 0.012 |
| chr8:102336540-102336690 | 66 | 0.021 |
| chr8:102296565-102296715 | 2001 | 0.024 |
| chr8:102404545-102404695 | 879 | 0.024 |
| chr8:102472805-102472955 | 934 | 0.024 |
| chr8:102368480-102368630 | 687 | 0.024 |
| chr8:102408305-102408455 | 860 | 0.022 |
| chr8:102349640-102349790 | 2159 | 0.019 |
| chr8:102339300-102339450 | 493 | 0.019 |
| chr8:102375185-102375335 | 2001 | 0.018 |
External Databases
UCSCEnsembl (ENSG00000228224)