Gene: ECEL1P3
chr2: 233214463-233216019Expression Profile
(log scale)
Graphical Connections
Distribution of linked clusters:
You may find it interesting if many of the connected DHS sites belong to the same cluster.| Cluster Profile | Cluster ID | Number of DHS sites in this cluster |
|---|---|---|
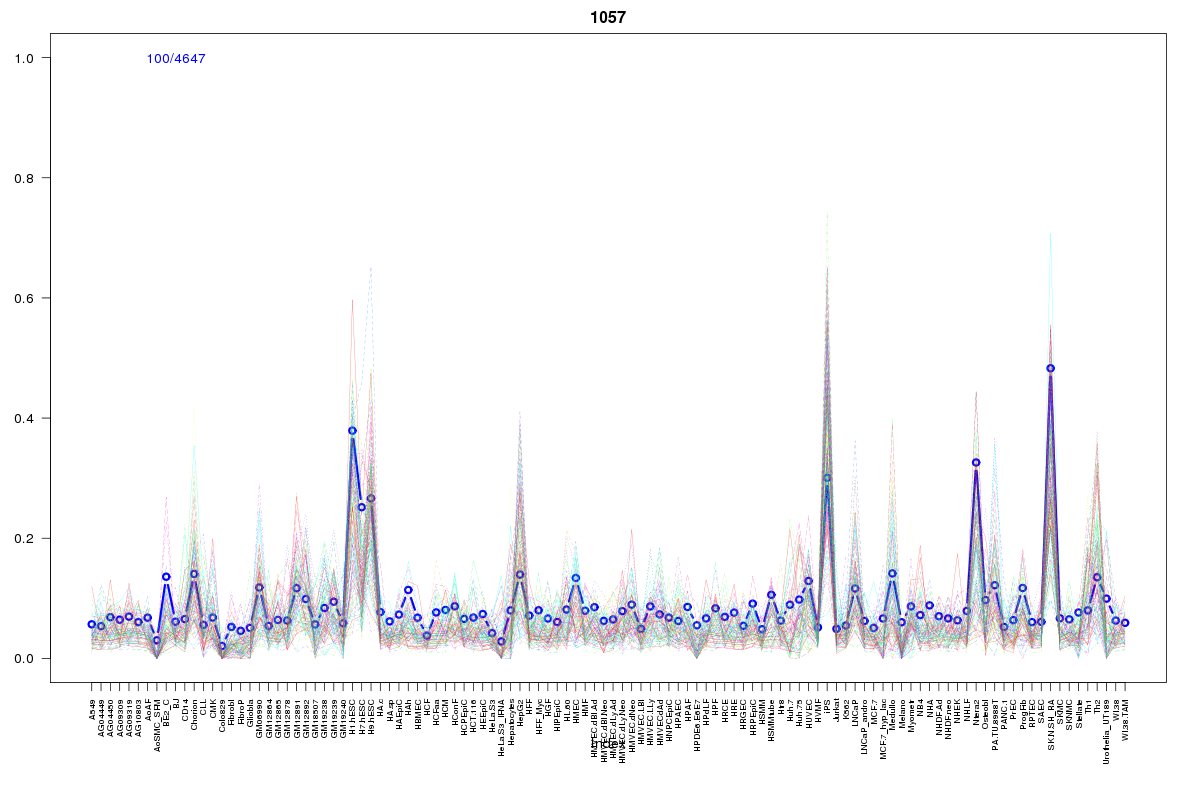 | 1057 | 5 |
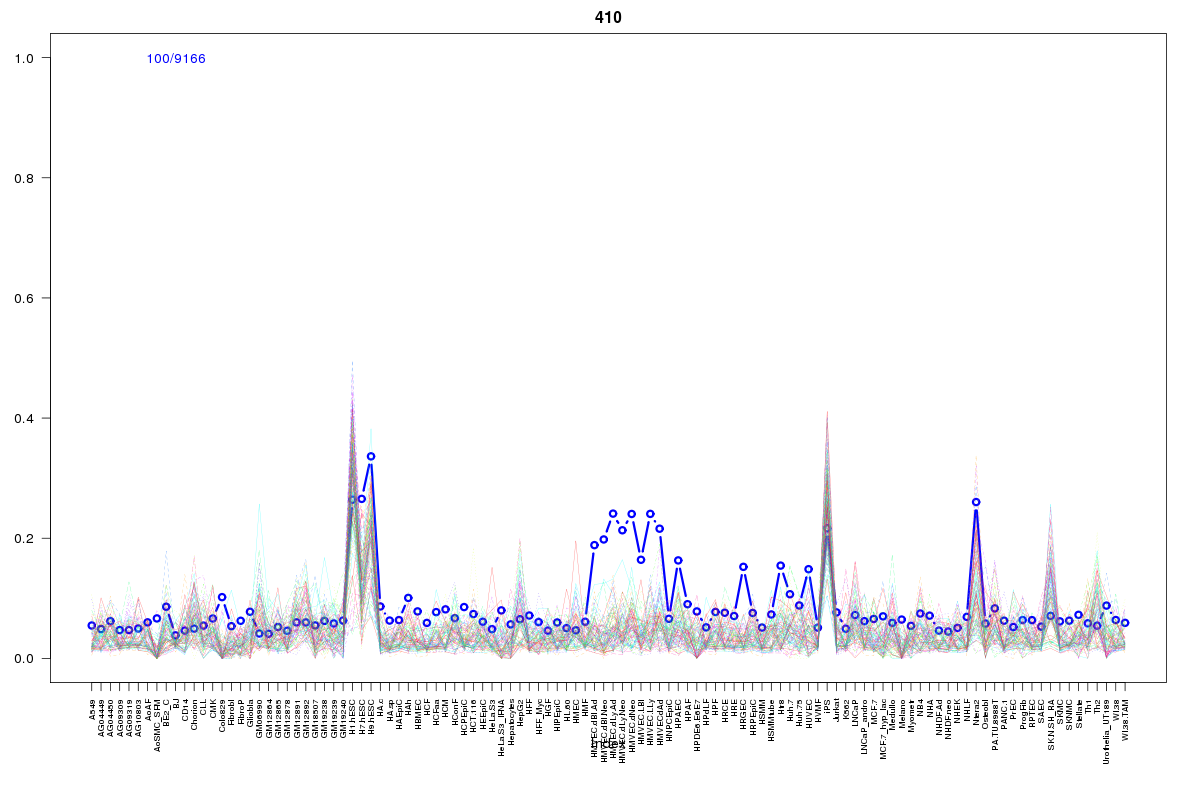 | 410 | 5 |
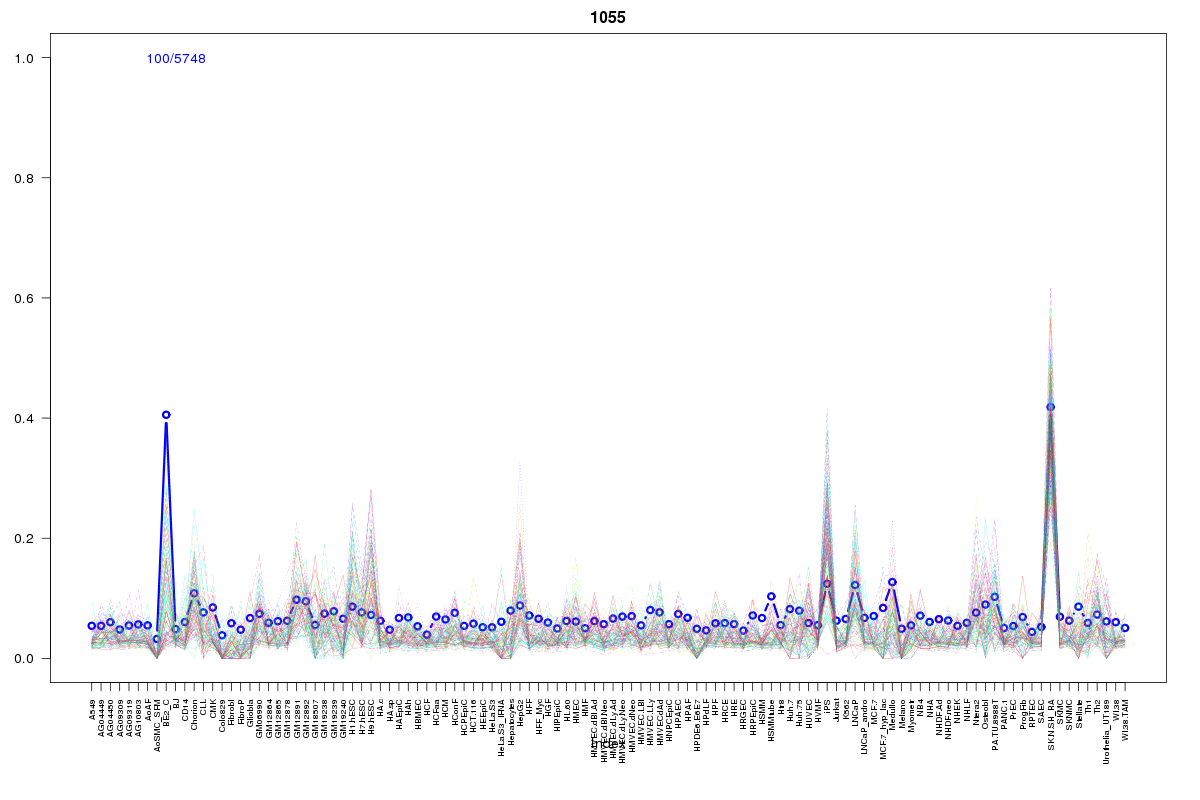 | 1055 | 2 |
 | 1078 | 2 |
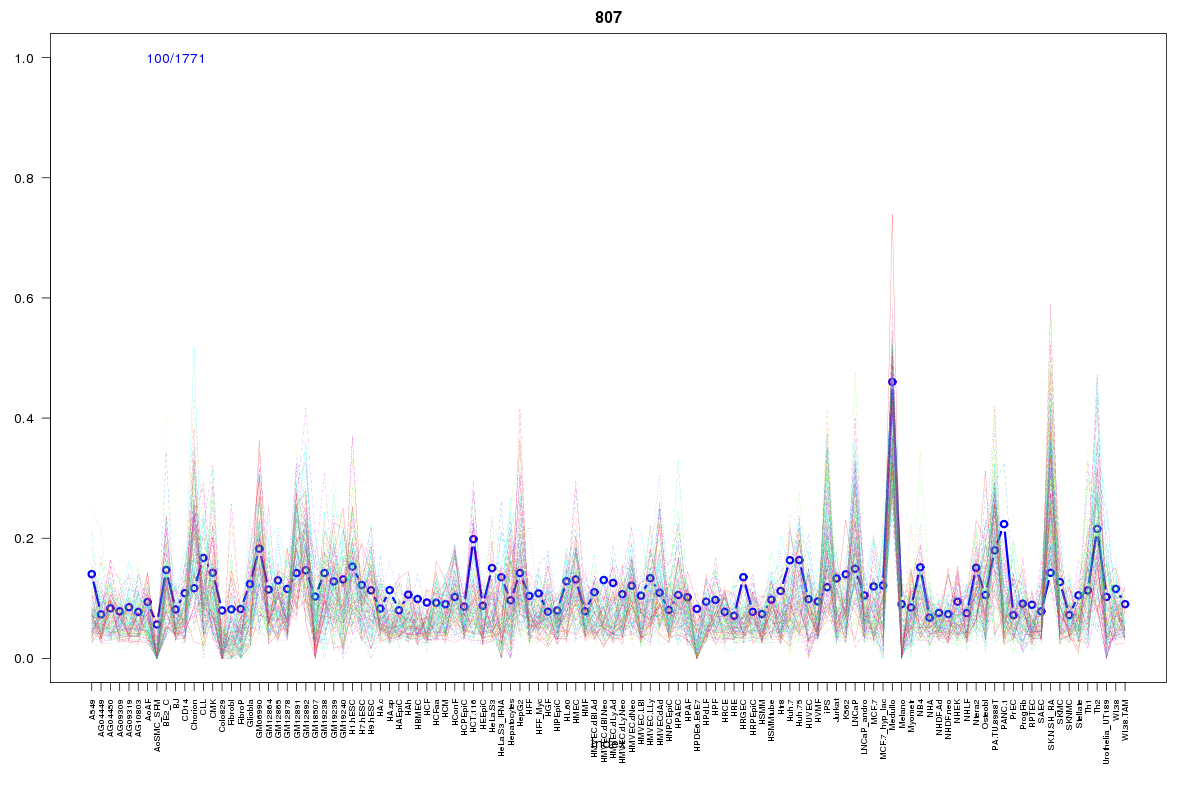 | 807 | 2 |
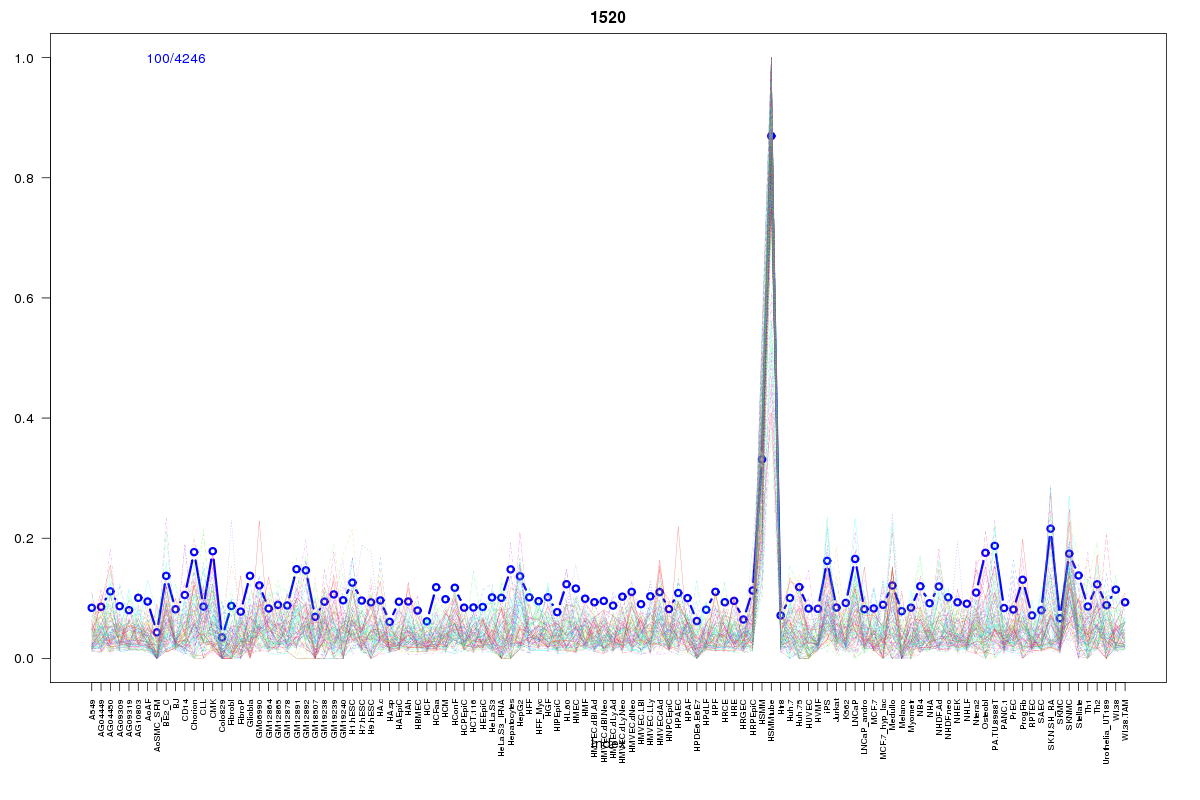 | 1520 | 1 |
 | 655 | 1 |
 | 927 | 1 |
 | 1008 | 1 |
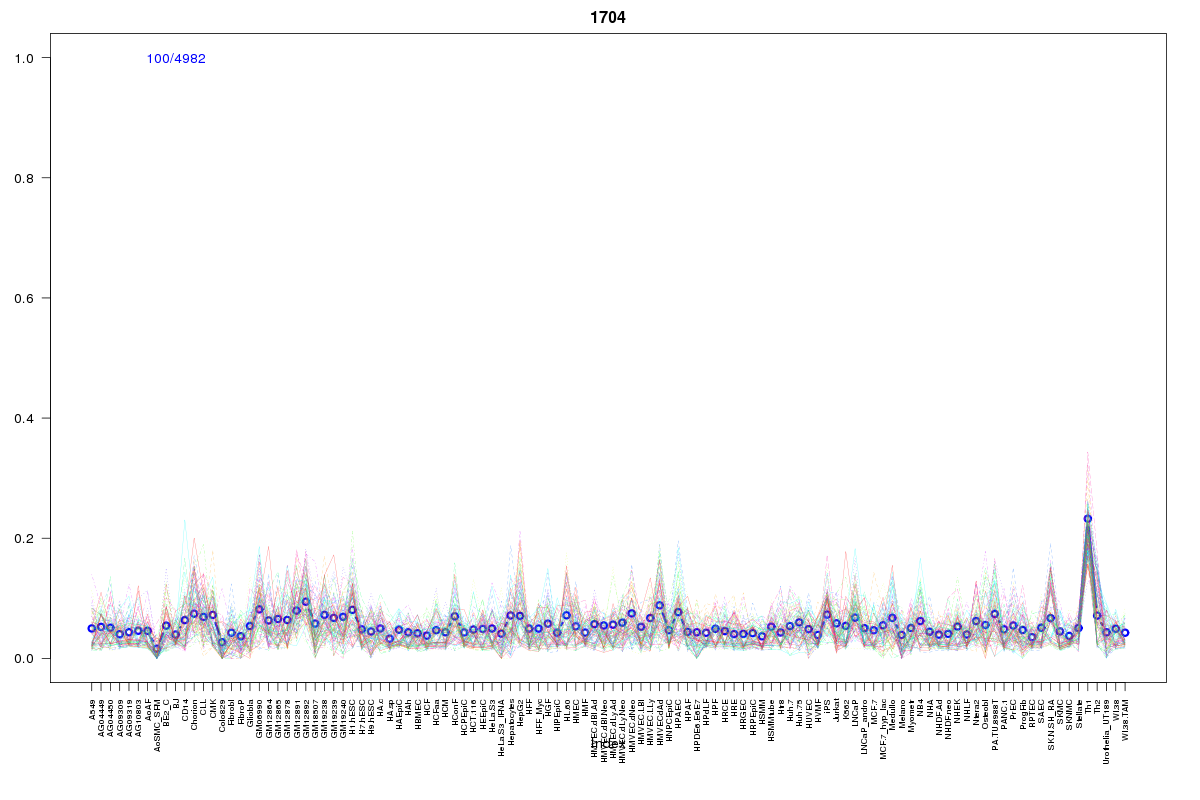 | 1704 | 1 |
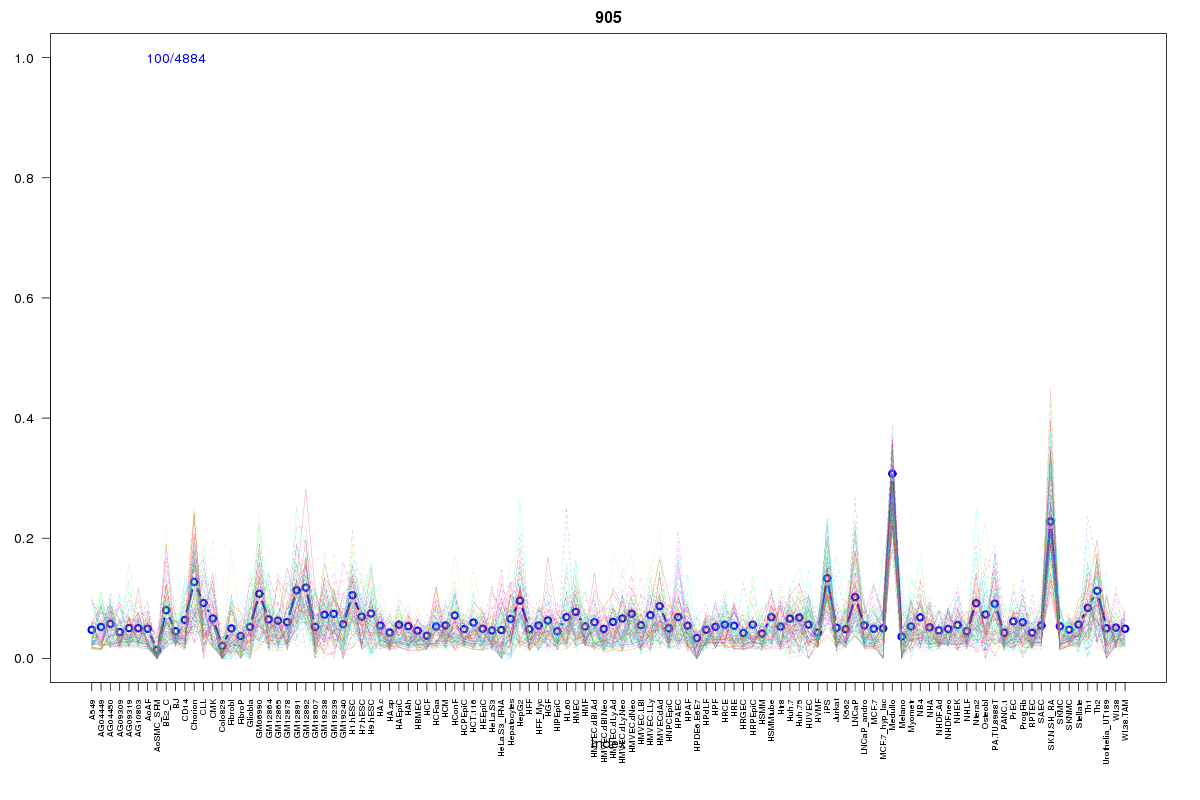 | 905 | 1 |
 | 860 | 1 |
 | 547 | 1 |
 | 1605 | 1 |
Resources
BED file downloads
Connects to 25 DHS sitesTop 10 Correlated DHS Sites
p-values indiciate significant higher or lower correlation| Location | Cluster | P-value |
|---|---|---|
| chr2:233121845-233121995 | 860 | 0.001 |
| chr2:233124880-233125030 | 547 | 0.005 |
| chr2:233211520-233211670 | 927 | 0.023 |
| chr2:233281705-233281855 | 1704 | 0.024 |
| chr2:233297725-233297875 | 410 | 0.022 |
| chr2:233200345-233200495 | 807 | 0.022 |
| chr2:233190425-233190575 | 1078 | 0.019 |
| chr2:233215800-233215950 | 1057 | 0.016 |
| chr2:233242545-233242695 | 1008 | 0.016 |
| chr2:233284505-233284655 | 905 | 0.016 |
| chr2:233203565-233203715 | 655 | 0.015 |
External Databases
UCSCEnsembl (ENSG00000230122)